Abstract
More than 22,000,000 m3 of soil was contaminated with cesium (Cs) radioisotopes following the accident at the Fukushima Daiichi Nuclear Power Plant. For site remediation, it is necessary to reduce this huge volume of contaminated soil. To achieve this, we investigated the distribution of contamination within soil particles. We measured the radioactivity distribution in soil particles using an autoradiogram (ARG) method, with a resolution of 50 × 50 μm, and also determined the elemental distributions with energy-dispersive X-ray spectroscopy. The ARG showed that almost all particles were uniformly contaminated with Cs radioisotopes, while the elemental distributions indicated that the particles were clay aggregates. These results suggest that, by impacting contaminated particles with each other and classifying them, we can reduce the volume of contaminated soil.
Public Interest Statement
More than 22,000,000 m3 of soil was contaminated with cesium radioisotopes following the accident at the Fukushima Daiichi Nuclear Power Plant. For site remediation, it is necessary to reduce this huge volume of contaminated soil. To achieve this, we investigated the distribution of contamination within soil particles. And we offered classification processes which are a simple and effective means of volume reduction.
1. Introduction
The Fukushima Daiichi Nuclear Power Plant (FDNPP) accident in 2011 resulted in the widespread contamination of Fukushima Prefecture with cesium (Cs) radioisotopes. On the basis of guidance provided by the Japanese Ministry of the Environment, which advised the removal of contaminated soil, Cs radioisotopes have been removed together with the soil from the ground surface to a depth of 5 cm. The quantity of soil removed in Fukushima Prefecture is about 22,000,000 m3 (Ministry of the Environment, Government of Japan, Citation2017). The soil removed from each contaminated site in Fukushima has been placed in an interim storage facility. Because of the huge amount of contaminated soil collected, it is necessary to reduce its volume. Vaporization, dissolution and desorption have been suggested as potential soil decontamination methods (Hirao et al., Citation2016; Mukai, Hirose et al., Citation2016; Yin, Takahashi, Inabe, & Takeshita, Citation2016). It is generally considered that Cs radioisotopes are mainly associated with small soil particles (McKinley et al., Citation2001, Citation2004; Mukai, Motai, Yaita, & Kogure, Citation2016; Mukai, Hirose et al., Citation2016); size classification may therefore offer a simple and effective means of volume reduction (Ishii et al., Citation2012). Moreover, if Cs radioisotopes are distributed on the surface of small soil particles, it would also be possible to reduce the activity by removing the surface of highly contaminated soil particles. In this study, we evaluated this hypothesis by measuring the radioactive distribution of a cross section of contaminated soil particles using an autoradiogram (ARG) method, with a spatial resolution of 50 × 50 μm.
2. Sampling
We selected Iitate village as a sampling location because its residents are still evacuated due to the potentially high radiation doses in the area. We located a hot spot of contaminated soil in the village and sampled the highly contaminated soil (see Figure ). This hot spot is considered to have been formed by an accumulation of radioactive materials transported from a dip in an asphalt road.
3. Methods
3.1. Classification of contaminated soil particles
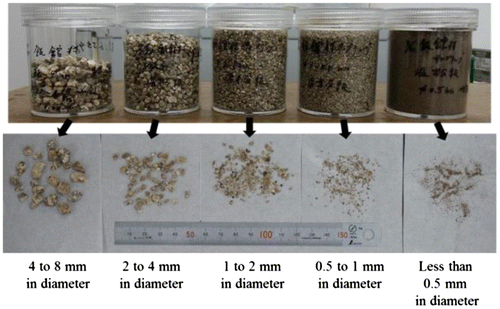
We classified contaminated soil particles using five stainless steel sieves, with mesh sizes of 8, 4, 2, 1, and 0.5 mm. Because small particles may have adhered to the surface of large particles, the classification was conducted in water.
3.2. Measurement of radioactivity
The radioactivity of soil particles, classified as a function of particle diameter, was measured by a germanium semiconductor detector (GX2018 type, CANBERRA).
3.3. Measurement of the radioactivity distribution in cross sections of contaminated soil particles using ARG
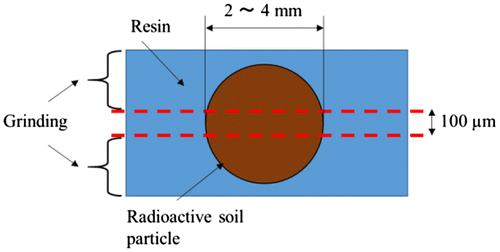
Considering the resolving power of ARG (50 × 50 μm), we measured the radioactive distributions of contaminated soil particles over the size range of 2–4 mm. We embedded soil particles into a resin (53 type, Sankei Co., Ltd.) and then hardened the resin to fix the soil particles, as shown in Figure . We ground the top and bottom parts of the soil particles with abrasive paper (FUJISTAR waterproof abrasive paper, Sankyo Rikagaku Co., Ltd.), maintaining a thickness of about 100 μm.
We lined up the resin slices containing a contaminated soil particle on the bottom of the storage box. Then we covered them with an imaging plate (Type BAS-III, Fuji Corporation) and exposed it in a lead sealed box for 72 h. We measured the radiation dose with a BAS-1800II (Fuji Corporation).
3.4. Measurement of the elemental distributions in cross sections of contaminated soil particles
We measured the elemental distributions of the cross sections of particles by scanning electron microscopy (SEM; JSM-6510, JEOL Ltd.) and energy-dispersive X-ray spectroscopy (EDS; X-Max20, Oxford Instruments, Inc.).
4. Results
4.1. Particle size distribution and radioactivity of contaminated soil
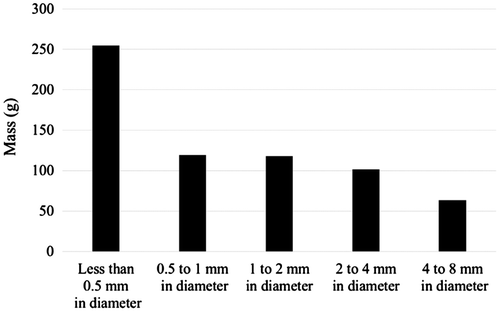
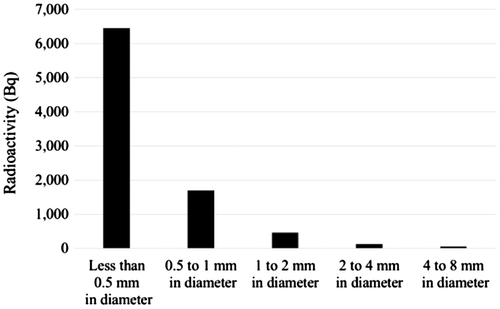
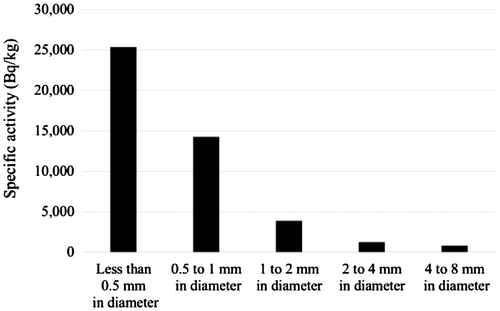
An overview of the classified soils is presented in Figure . The mass distribution of the dried soil particles as a function of particle diameter and the radioactivity of the soil particles are shown in Figures and , respectively. Using these results, the specific activities of the soil particles were estimated (Figure ).
4.2. Relationship between radioactivity and element distributions
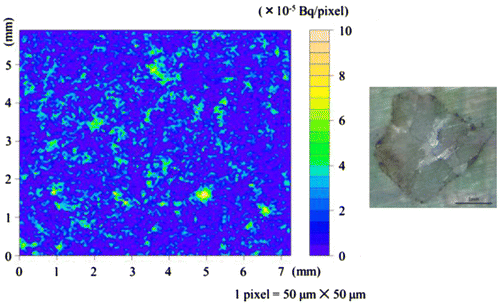
The activity images obtained for various soil particles are shown in Figure . As seen in this figure, there were two types of contamination, namely, whole body (particle Nos. 2, 4, 5, 7, 8, 9, 12, 14, 15, 16, 19, and 20) and surface (particle Nos. 1, 3, 6, 11, 17, and 18). Contamination was not recognized in particle Nos. 10 and 13.
Figure 7. Autoradiogram (ARG) images of contaminated particles, with diameters in the range of 2–4 mm.

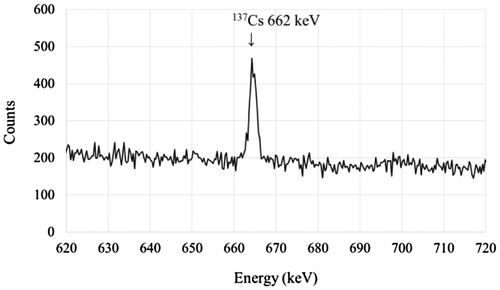
We measured 662 keV γ-rays of 137Cs in particle No. 8 using a germanium semiconductor detector (see Figure ) and estimated its activity from the γ-ray count.
By normalizing the total intensity of the ARG of particle No. 8 to its activity measured with the germanium semiconductor detector, we obtained the activity of each pixel in the ARG image, which is shown in the right column on the left side of Figure . Among the pixels in this figure, the highest radioactivity in the pixel of the ARG image was 100 μBq/(50 × 50 μm).
Figure 9. Image of the radioactivity (μBq/pixel) (left side) and a photograph (right side) of particle No. 8.
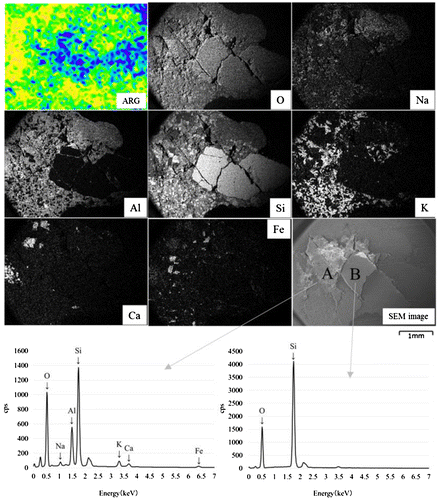
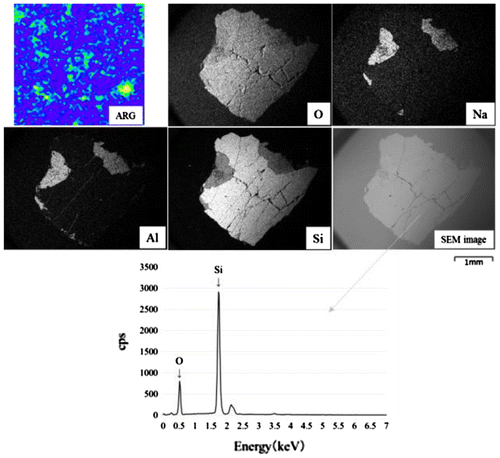
The elemental distribution images are shown in Figure together with the ARG image. The bottom of Figure shows the X-ray energy spectra at points A and B in the SEM image. It can be seen from the concentrations of O, Al, and Si that the material at point A is clay. The ARG image indicated that almost all of the particle was uniformly contaminated with Cs radioisotopes. In contrast, the energy spectrum of point B indicates only the presence of O and Si. Therefore, the dark region in the ARG image of Figure corresponds to quartz (Akiba, Hashimoto, & Kanno, Citation1989).
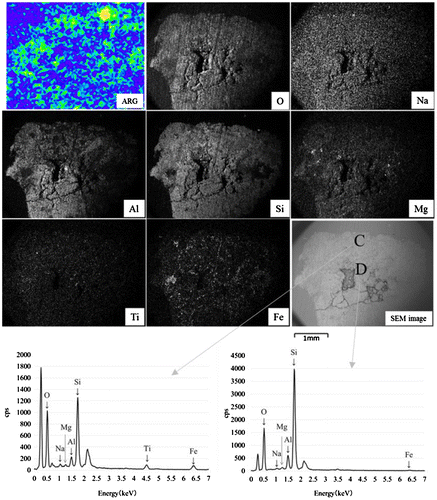
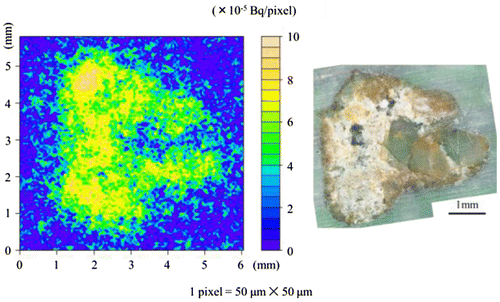
Figure shows the surface contamination of particle No. 1. The elemental distributions and SEM image of particle No. 1 are shown in Figure together with its ARG image. The components of particle No. 1 at points C and D are O, Al, and Si; therefore, the whole body of particle No. 1 is pure clay. In contrast to particle No. 8, activity was observed on the surface of the particle.
Figure 11. Image of the radioactivity (μBq/pixel) (left) and a photograph (right) of particle No. 1.
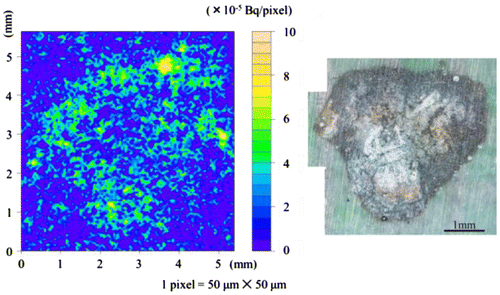
Figure shows particle No. 13 and does not indicate any activity. The elemental distributions and SEM image of particle No. 13 are shown in Figure . The X-ray energy spectrum results indicate that particle No. 13 is quartz (Akiba et al., Citation1989).
5. Discussion
We studied the contamination of the clay particles. For particle sizes of 10–350 μm, it was found that the specific radioactivity was inversely proportional to particle size (Ishii et al., Citation2014). This suggests that the Cs radioisotopes are distributed within a certain thickness of the soil particle surface. When the Cs distribution of soil particles was investigated by micro-computed tomography, it was found that the Cs atoms were distributed within a depth of 10 μm from the surface (Ishii et al., Citation2016). We considered whether this could be extended to particles with sizes of several millimeters. Figure shows that the specific activity of contaminated soil particles with a diameter of 0.5–8 mm was roughly proportional to the inverse of the particle diameter. However, as shown in the ARG images in Figure , there were several contamination patterns (i.e. whole, part, and surface), although we are yet to confirm this result. Almost all particles in Figure (particle Nos. 2, 4, 5, 7, 8, 9, 12, 14, 15, 16, 19, and 20) were aggregates of clay particles. Therefore, it is possible that the volume of contaminated soil could be reduced by strongly impacting these particles against each other and breaking the clay aggregates.
The results shown in Figure for particle No. 1 differ from those of other particles. Despite being an aggregate of clay particles, only the surface was contaminated. An aggregate of clay particles normally acts like a sponge, but particle No. 1 did not. From the photograph of the cross section of particle No. 1 in Figure , the center of the particle seems to be different from the surrounding parts of the particle. Our results show that such cases are very rare and do not contribute to the activity of contaminated soil.
6. Conclusions
To study the structure of Cs contamination in soil particles, we selected a specific sampling site where soil particles were transported from various locations. Soil particles that were contaminated with Cs radioisotopes under various conditions were investigated in this study.
We measured the distribution of radioactivity on the contaminated soil particles by an ARG method, with a resolution of 50 × 50 μm. Almost all parts of the soil particles were uniformly contaminated, and through the measurement of elemental distribution with EDS, the particles were determined to be clay aggregates. Therefore, by impacting contaminated particles against each other, the aggregates could be loosened and reduced to small clay particles. By classifying them, the quartz and clay particles could be separated.
Funding
The authors received no direct funding for this research.
Acknowledgments
We would like to thank Dr T. Yamaguchi and Dr S. Takyu for their help with the experiment. We are also grateful to Prof S. Matsuyama, Prof A. Terakawa, and Prof A. Hasegawa for their helpful advice. One of the authors, Tohru Ohnuma, greatly appreciates the support of Prof Y. Niibori and Prof C. Inoue. The authors are also grateful to anonymous editors for their language edits in this article.
Additional information
Notes on contributors
Tohru Ohnuma
Our group is researching on a remediation engineering of living environments contaminated with radioisotopes. This paper contributes to recovery of Fukushima Prefecture contaminated by the Fukushima Daiichi nuclear power plant accident.
References
- Akiba, K., Hashimoto, H., & Kanno, T. (1989, December). Distribution coefficient of cesium and cation exchange capacity of minerals and rocks. Journal of Nuclear Science and Technology, 26, 1130–1135.10.1080/18811248.1989.9734437
- Hirao, N., Shimoyama, I., Baba, Y., Izumi, T., Okamoto, Y., Yaita, T., & Suzuki, S. (2016). Desorption behavior of Cs from clay minerals by thermal heating in a vacuum: analyses by thermal desorption spectroscopy and synchrotron radiation X-ray photoelectron spectroscopy. The Japan Society for Analytical Chemistry, 65, 259–266.
- Ishii, K., Hatakeyama, T., Itoh, S., Sata, D., Ohnuma, T., Yamaguchi, T., … Kim, S. (2016). Application of micron X-ray CT based on micro-PIXE to investigate the distribution of Cs in silt particles for environmental remediation in Fukushima Prefecture. Nuclear Instruments and Methods in Physics Research Section B: Beam Interactions with Materials and Atoms, 371, 387–391.10.1016/j.nimb.2015.09.054
- Ishii, K., Terakawa, A., Matsuyama, S., Hasegawa, A., Nagakubo, K., Sakurada, T., … Fujiwara, M. (2012). Measures against radioactive contamination due to Fukushima first nuclear power plant accidents part III: Removing and decontamination of contaminated soil. International Journal of PIXE, 22, 13–19.10.1142/S0129083512400323
- Ishii, K., Terakawa, A., Matsuyama, S., Kikuchi, Y., Fujishiro, F., Ishizaki, A., … Kim, S. (2014). Reducing logistical barriers to radioactive soil remediation after the Fukushima No. 1 nuclear power plant accident. Nuclear Instruments and Methods in Physics Research Section B: Beam Interactions with Materials and Atoms, 318, 70–75.10.1016/j.nimb.2013.06.067
- McKinley, J. P., Zachara, J. M., Heald, S. M., Dohnalkova, A., Newville, M. G., & Sutton, S. R. (2004). Microscale distribution of cesium sorbed to biotite and muscovite. Environmental Science & Technology, 38, 1017–1023.10.1021/es034569m
- McKinley, J. P., Zeissler, C. J., Zachara, J. M., Serne, R. J., Lindstrom, R. M., Schaef, H. T., & Orr, R. D. (2001). Distribution and retention of 137Cs in sediments at the Hanford Site, Washington. Environmental Science & Technology, 35, 3433–3441.10.1021/es0018116
- Ministry of the Environment, Government of Japan. (2017). Progress on off-site cleanup and interim storage facility in Japan. Retrieved from http://josen.env.go.jp/en/pdf/progressseet_progress_on_cleanup_efforts.pdf
- Mukai, H., Hirose, A., Motai, S., Kikuchi, R., Tanoi, K., Nakanishi, T., … Kogure, T. (2016). Cesium adsorption/desorption behavior of clay minerals considering actual contamination conditions in Fukushima. Scientific Reports, 6, 511.10.1038/srep21543
- Mukai, H., Motai, S., Yaita, T., & Kogure, T. (2016). Identification of the actual cesium-adsorbing materials in the contaminated Fukushima soil. Applied Clay Science, 121-122, 188–193.10.1016/j.clay.2015.12.030
- Yin, X., Takahashi, H., Inabe, Y., & Takeshita, K. (2016). Desorption of cesium ions from vermiculite with sea water by hydrothermal process. The Chemical Society of Japan, 45, 256–258.


