
Abstract
The accident at the Fukushima Daiichi Nuclear Power Plant caused widespread contamination in Fukushima Prefecture. The area was mainly contaminated with radioisotopes of iodine 131, cesium 134, and cesium 137. The surface soil has been removed in an attempt to decontaminate the evacuated area (1,150 km2). Rainfall erosion is believed to decontaminate mountains, so the surface soil has not been removed there. We thus investigated whether the mountains had been decontaminated by analyzing soil from the sedimentary layers found at the mouth of a stream that passes through these mountains. The volumeand radioactivity distributions of the sedimentary layers showed that the heavy rainfall right after the earthquake contained a large amount of radioactive cesium. We confirmed that most small soil particles, those with diameters less than 210 μm, were not deposited at intermediate positions as they were transported downstream. Hence, rainfall erosion is a very effective means of decontaminating the mountains.
Public Interest Statement
The accident at the Fukushima Daiichi Nuclear Power Plant caused widespread contamination in Fukushima Prefecture. Rainfall erosion is believed to decontaminate mountains. We thus investigated whether the mountains had been decontaminated by analyzing soil from the sedimentary layers found at the mouth of a stream that passes through these mountains. We confirmed that most small soil particles, those with diameters less than 210 μm, were not deposited at intermediate positions as they were transported downstream. Hence, rainfall erosion is a very effective means of decontaminating the mountains.
1. Introduction
The Fukushima Daiichi Nuclear Power Plant accident occurred on 11 March, 2011. On 14 March, there was a hydrogen explosion in the reactors. This released a large amount of iodine 131 (131I: half-life 8 days), cesium 134 (134Cs: half-life 2 years), and cesium 137 (137Cs: half-life 30 years) into the air and contaminated parts of Fukushima Prefecture (Tagami et al., Citation2011).
The Japanese government dealt with the contamination by evacuating 11 municipalities and removing 5 cm of earth from the surface of the ground. This reduced the residents’ radiation exposure to less than 0.23 μSv/h. Residents started to return to areas with radiation doses of less than 20 mSv/y in April 2017 (Ministry of the Environment, Citation2017).
The decontamination reduced the radiation doses in the surroundings of the houses and fields in these areas to less than 1 μSv/h (8.7 mSv/y) (Ishii et al., Citation2012). The mountains in Fukushima Prefecture were not decontaminated even though 11 of the municipalities in the contaminated area are in the mountains (1,150 km2) (Ministry of Education, Citation2013).
The levels of 134Cs present in these municipalities have dropped significantly. Hence, in these areas, the radiation levels caused by the accident are now less than half their original values. There are still many places in the difficult-to-return-to area (337 km2) where the radiation dose exceeds 20 mSv/y (2.2 μSv/h) (Ministry of Education, Citation2013). However, there is less radiation than expected because the 137Cs levels have decreased.
In our previous work (Ishii et al., Citation2012), we confirmed that 137Cs atoms firmly adhere to the clay and are not dissolved in water either acid or alkaline solution. Therefore, it is thought that frequent rainfall erosion can remove the clay particles containing 137Cs and decontaminate mountainous areas (Laceby et al., Citation2016; Thai et al., Citation2015). The aim of this study was to explain the decrease in radiation levels in the mountains by analyzing the soil sediments formed at the mouth of a stream that passes through the mountains.
Iitate Village is one of the 11 municipalities in the evacuation area. Hiso River is a small river that runs through Iitate Village. We studied a part of this village that is difficult to return to at present. The location of this area, which has not yet been decontaminated, is indicated by the green dashed line in Figure . The green dashed line is a mountain ridge that surrounds two tributaries (see in Figure ). Rainfall causes soil from the mountain to flow into the tributaries. The restricted residential area upstream of Hiso River (see in Figure ) has been decontaminated.
Figure 1. Sampling location.
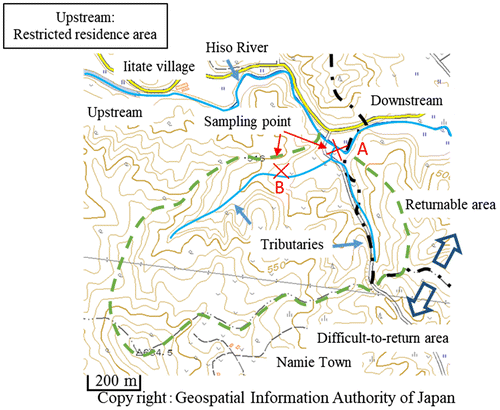
We took soil samples from Point A, which is at the mouth of the stream, and Point B, which is on the mountain. We found the sedimentary layer shown in Figure at Point A. The erosion of the topography along the stream as it passes close to Point B would cause soil to flow into the left tributary. This soil would have been deposited onto the sedimentary layer when the water level of the main river was so high that the layer was submerged.
Figure 2. Sedimentary layer.
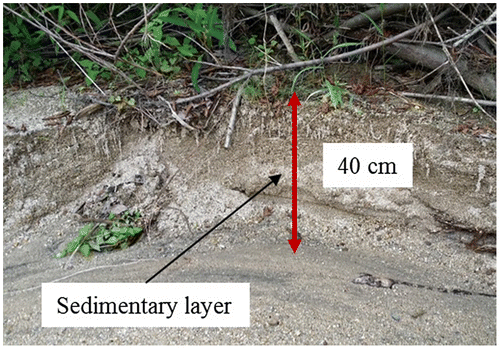
Table shows the dates that rainfall exceeded 50 mm/day in the area of interest in the period from September 2010 until the sampling date. As there was 69.5 mm of rain on 22 August 2016, the sedimentary layer was a few centimeters under the surface of the water on 23 August 2016. We believe that soil is deposited onto the sedimentary layer when rainfall exceeds 50 mm/day. Moreover, the formation of the layer was made possible due to the erosion caused by the daily flow of the tributary.
Table 1. Dates when rainfall in Iitate village exceeded 50 mm/day
In this study, we analyzed the soil in this sedimentary layer and investigated the extent to which rainfall erosion on the mountain decontaminates radioactive cesium.
2. Experiment
2.1. Sampling
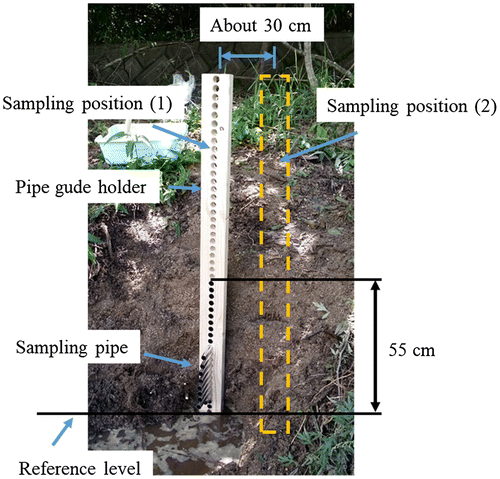
We took soil samples from the sedimentary layer using the sampling pipes shown in Figure . The sampling pipe is an iron pipe with a length of 20 cm, an external diameter of 1.9 cm, and an internal diameter of 1.7 cm. The pipe guide shown in Figure is a piece of wood with length 120 cm, width 10 cm, and depth 5 cm. The guide contains holes with diameters of 20 mm at 25-mm intervals. We took samples from two locations that were separated by a distance of 30 cm. As shown in Figure , we sampled approximately 50 cm of sediment at 25-mm intervals.
Figure 3. Schematic diagram of the sampling pipe and the pipe guide holder.
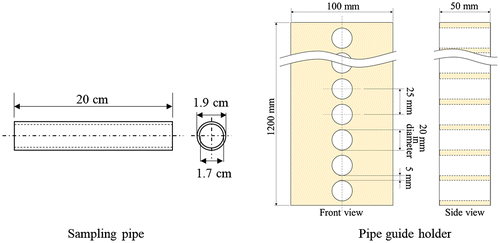
Figure 4. Sampling soil from the sedimentary layer at Point A.
We also sampled soil from locations 2 m downstream and 5 m upstream of Point A. The soil from the former is believed to have been transported from the area of the mountain indicated by the dashed line in Figure following the rainfall on 22 August 2016. We think that the soil from upstream of Point A came from the restricted residence area that lies upstream of Hiso River.
Hiso River is muddy after rainfall. Hence, we sampled this muddy water to determine how the soil is transported by rainfall.
2.2. Radioactivity measurement
We used a germanium semiconductor detector (GX 2018 type, CANBERRA) to detect 662 keV γ-rays from 137Cs in the soil samples. Figure shows the results of the measurements of the radioactivity of the soil samples obtained at height intervals of 25 mm with respect to a reference level. The reference level varied in association with the water level of the river on the day we collected the soil samples, which was 25 August 2016, and was close to a sign on the riverbank that indicated the water level.
Figure 5. Radioactivity as a function of height with respect to the reference level.
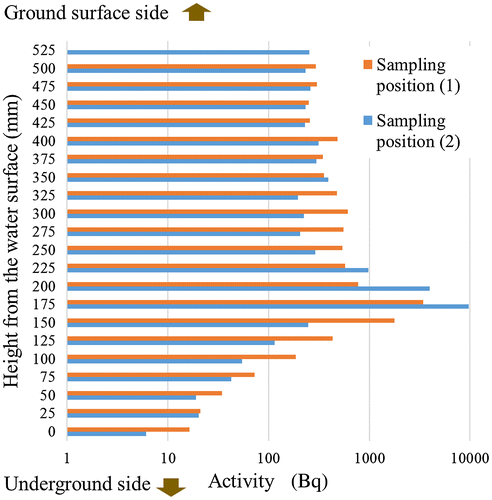
The highest radioactivity from both sampling points occurred at a height of 175 mm. The radioactivity decreased at heights less than 175 mm, and remained constant at heights greater than 250 mm.
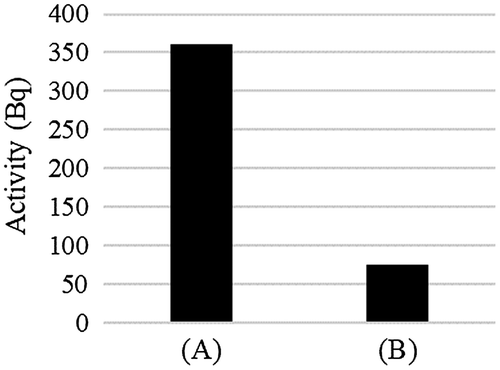
Figure shows the radioactivity of the soil sample transported from the area of the mountain in the difficult-to-return-to area and from the restricted residence area upstream of Hiso River by the rainfall on 22 August 2016. The radioactivity of the soil sample from the restricted residence area is about one-seventh that of the soil sample from the difficult-to-return-to area. We can see from Figure that the radioactivity of the soil sample from the difficult-to-return-to area is almost the same as that of the soil at a height of 500 mm of the sedimentary layer.
Figure 6. Radioactivity of the soil samples transported from the mountain in the difficult-to-return-to area (A) and from the restricted residence area (B).
We precipitated, dried, and extracted the fine particles from the muddy water collected from Hiso River. Their specific radioactivity was 20,093 Bq/kg.
3. Results and discussion
3.1. Dependence of radioactivity level on height in sedimentary layer
Figure shows that the radioactivity remains constant when the height is greater than 175 mm, so the erosion decontaminates the ground at a constant rate. The distributions of the radioactivity at sampling points (1) and (2) were almost the same. This indicates that the sedimentation at Point A was uniform.
Assuming that the sedimentary layer was formed by rainfall, the layer at 175 mm would have been formed by the rainfall on 30 May, 20 September, and 21 September 2011.
3.2. Analysis with classification
We used three stainless steel sieves (SANPO), with mesh sizes of 45 μm, 210 μm, and 2 mm, to classify the soil samples from the sedimentary layers at Points A and B on the Hiso River tributary, the soil samples collected from the mountain on 22 August 2016, and those transported from the upstream restricted residence area. As fine particles adhered to the surfaces of the large particles (Ishii et al., Citation2014, Citation2016; Ohnuma & Ishii, Citation2017), we separated the particles in water before classifying them.
We classified the soil samples from the sedimentary layer at heights of 75, 100, 125, 150, 175, 200, 300, 400, and 500 mm from sampling position (1), and at heights of 50, 125, 150, 175, 200, 225, 250, 375, and 525 mm from sampling position (2). The volumeof each sample was 45.4 cm3 as this is the volumeof the sampling pipe.
Figure shows the volumedistribution as a function of soil particle diameter at the top and the radioactivity as a function of soil particle diameter at the bottom. The volumedistributions from both sampling positions at a height of 175 mm differ from the distributions at other heights, which are all almost identical. This means that many contaminate particles were displaced when the ground had been cracked by the earthquake prior to being eroded by rainfall then the bare surface of ground was contaminated (Malamud, Turcotte, Guzzetti, & Reichenbach, Citation2004). These particles formed the sediment at a height of 175 mm. A similar relationship was observed for the radioactivity as a function of the soil particle diameter, shown at the bottom of Figure .
Figure 7. volumeand radioactivity of the soil samples as a function of soil particle diameter for sampling positions (1) and (2).
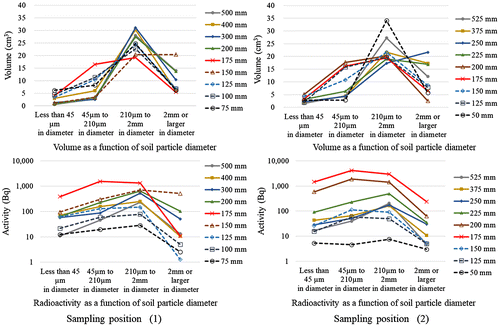
Figure shows the volumedistributions of the soil samples with volume45.4 cm3 from the sediment formed before the earthquake (75 mm) (a), the sediment formed right after the earthquake (175 mm) (b), the sediment formed after the earthquake (500 mm) (c), and the soil sample from Point B (d).
Figure 8. Soil sample volumeas a function of soil particle diameter from the sediment formed before the earthquake (75 mm) (a), the sediment formed right after the earthquake (175 mm) (b), the sediment formed after the earthquake (500 mm) (c), and the soil sample from Point B (d).
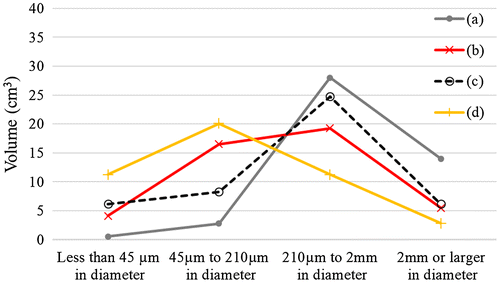
The samples from Point B contain soil particles with diameters ranging from 45 to 210 μm and less than 45 μm in diameter is large. However, the volumes of the particles in the soil samples from the sedimentary layers were small. We believe that rainfall transported the small particles with diameters in the range of 0–210 μm.
The top of Figure shows the volumedistributions as a function of particle diameter for samples taken from heights 75 mm and 500 mm from sampling position (1), at heights 50 mm and 525 mm from sampling position (2), from the soil samples transported from the mountain on 22 August 2016, and from the restricted residence area upstream of Hiso River. Similar distributions are observed before and after the disaster.
Figure 9. The volumeand radioactivity distributions as a function of particle diameter for the samples from the sedimentary layer, the soil samples transported from the mountain on 22 August 2016, and from the restricted residence area upstream of Hiso River.
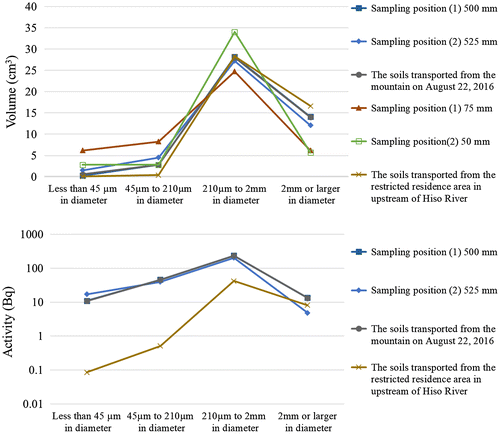
The bottom of Figure shows the radioactivity as a function of particle diameter for samples taken from a height of 500 mm from sampling position (1), at a height of 525 from sampling position (2), from the soil samples transported from the mountain on 22 August 2016, and from the restricted residence area upstream of Hiso River. The distributions of the soil samples transported from the mountain on 22 August 2016, are the same as the distributions of the sediment samples formed after the disaster. On the other hand, the soil samples transported from the restricted residence area upstream of Hiso River were almost one percent as radioactive as the samples collected from the sedimentary layers and the mountain. The soil sample transported from the restricted residence area was taken from the center of the river, and the soil sample transported from the mountain on 22 August 2016, was taken from the riverside. When rainfall raises the water level, the water flows quickly at the center of the river, and slowly along the riverside. It is possible that the small particles with diameters less than 210 μm collected from the restricted residence area upstream of Hiso River were transported downstream without sedimentation, while the larger particles were deposited at the center of the river.
We analyzed the muddy water samples obtained from the river after rainfall. We used a particle counter (Morphologi G3, Malvern, detection limit 0.2 μm, The Morphologi G3 measures the size and shape of particles by static image analysis technique using optical microscope image) to count the particles in the soil as a function of particle size over the range 0.2–100 μm. Figure shows the results for the particles taken from the mountain soil at Point B, which lies upstream of the Hiso River tributary, with diameters less than 45 μm, the sediment particles taken from a height of 500 mm at sampling position (1) with diameters less than 45 μm, and the precipitated (20,093 Bq/kg) river water, indicated in 2–2. We only measured soil particles that had diameters less than 45 μm because the maximum diameter of the particles in the precipitate from Hiso River was 45 μm.
Figure 10. The particle size distributions of the particles of mountain soil from Point B with diameters less than 45 μm, sediment particles with diameters less than 45 μm from a height of 500 mm at sampling position (1), and samples precipitated from the water of Hiso River.
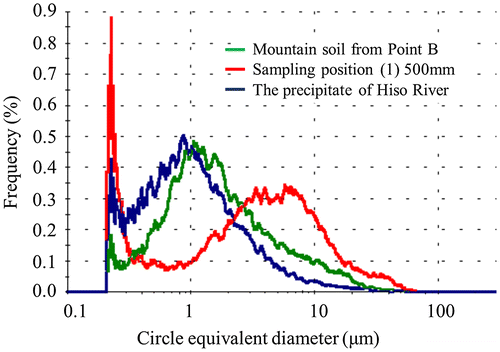
The particle size distribution of the precipitate from the river water was almost the same as that of the soil sample from Point B, but different from that of the sediment. This result can be understood as follows: The soil samples from the mountain at Point B contained mainly small particles. The muddy water contained very small particles that had been transported from the mountain by rainfall. Therefore, most of the particles in the precipitate had diameters close to 1 μm. The soil particles in the sediment at a height of 500 mm were transported from the mountain then deposited at the riverside and small particles with diameters less than 1 μm were transported further downstream along Hiso River.
We also measured the weights of the soil samples. We calculated the specific radioactivity of the soil from Point B, the soil particles with diameters less than 45 μm from the sediment from a height of 500 mm of sampling position (1), and the precipitate from Hiso River. The results are shown in Figure .
Figure 11. Specific radioactivity of mountain soil from Point B, sediment from a height of 500 mm at sampling position (1), and precipitate from Hiso River.
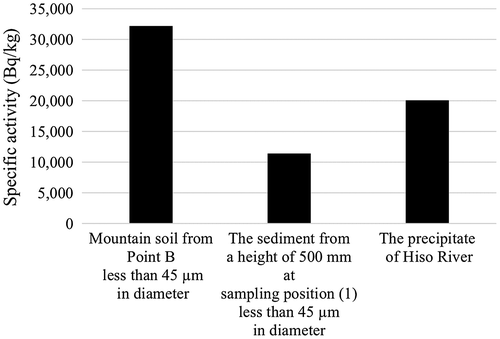
The specific radioactivity levels were greater than 10,000 Bq/kg. The specific radioactivity of the soil from Point B was equal to the sum of the specific radioactivity of the soil from sampling position (1) and the precipitate from Hiso River. This result supports the hypothesis presented above.
In Figure , we plot the radioactivity of the soil samples as a function of height in the sedimentary layer. We plot the radioactivity of the particles in the sediment as a function of particle size in Figure . These were very high in particles with diameters from 45 to 210 μm and from 210 μm to 2 mm.
In Figure , we plot the radioactivity of the particles with diameters in the ranges of 45 to 210 μm and 210 μm to 2 mm as a function of height in the sedimentary layer. The top left plot shows the radioactivity of the soil particles collected from sampling point (1) with diameters in the range of 45 to 210 μm; the bottom left plot shows the same for particles with diameters in the range of 210 μm to 2 mm; the top right plot shows the radioactivity of the soil particles collected from sampling point (2) with diameters in the range of 45 to 210 μm; and the bottom right plot shows the same for particles with diameters in the range of 210 μm to 2 mm.
Figure 12. Radioactivity as a function of height in the sediment layer for particles with diameters in the ranges of 45 to 210 μm and 210 μm to 2 mm from sampling positions (1) and (2).
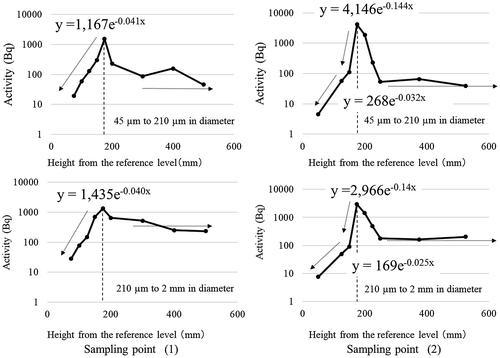
Each graph has a peak in radioactivity at 175 mm. When the height is lower than 175 mm in the plots on the left side of Figure , the radioactivity can be approximated by the function y = 1,167e−0.041x where x is the penetration depth for diameters in the range of 45–210 μm, and by y = 1,435e−0.040x for diameters in the range of 210 μm–2 mm. On the right side of Figure , the radioactivity of the particles in the sedimentary layer can be approximated by y = 4,146e−0.144x for heights from 175 to 150 mm, and y = 169e−0.025x for heights from 150 to 50 mm. These results indicate that the rainfall transported the soil particles with diameters from 45 to 210 μm and 210 μm to 2 mm into the water (Laceby et al., Citation2016). The radioactivity is almost constant at heights greater than 250 mm. Because, at present, the volumeof radioactive cesium is little by little transported from the large source, that is, the surface of the mountain.
4. Conclusions
We analyzed contaminated sedimentary layers from the bank of Hiso River in a difficult-to-return-to area in Iitate Village. This area has not yet been decontaminated following the Fukushima accident. We sampled the sedimentary soil as a function of height with respect to a reference level, and investigated the particle volumeand radioactivity for different heights in the sedimentary layer and different particle sizes.
Erosion by rainfall supplies the sedimentary layer with soil from the mountain. Hence, we also analyzed soil samples from the mountain; from the center of the river upstream of the sedimentary layer; from the riverside downstream of the sampling point; and precipitated from muddy water collected from the river.
Our analysis implies the following conclusions. (1) Rainfall caused radioactive cesium to pour into cracks in the ground formed by the earthquake. The cesium adhered mainly to soil particles with diameters less than 210 μm. (2) Rainfall transported most of the soil particles with diameters less than 210 μm downstream without depositing them at intermediate positions. (3) The cracks caused by the earthquake and the heavy rainfall right after the earthquake contributed to the massive outflow of cesium from the mountains. (4) At present, erosion by rainfall decontaminates the mountains at a constant rate.
Funding
The authors received no direct funding for this research.
Acknowledgments
We would like to thank Dr T. Yamaguchi and Dr S. Takyu for their help with the experiment. We are also grateful to Prof. S. Matsuyama, Prof. A. Terakawa, and Prof. A. Hasegawa for their helpful advice. One of the authors, T. Ohnuma, greatly appreciates the support of Prof. Y. Niibori and Prof. C. Inoue. The authors are also grateful to anonymous editors for their language edits in this article.
Additional information
Notes on contributors
Tohru Ohnuma
Our group is researching on a remediation engineering of living environments contaminated with radioisotopes.
We are aiming for regeneration from radiation disaster and investigating radioactivity, composition and morphology of soil that is in paddy field, swamp, river and mountain and so on in contaminated area.
This paper contributes to recovery of Fukushima Prefecture contaminated by the Fukushima Daiichi nuclear power plant accident.
References
- Ishii, K. , Hatakeyama, T. , Itoh, S. , Sata, D. , Ohnuma, T. , Yamaguchi, T. , … Kim, S. (2016). Application of micron X-ray CT based on micro-PIXE to investigate the distribution of Cs in silt particles for environmental remediation in Fukushima Prefecture. Nuclear Instruments and Methods in Physics Research Section B: Beam Interactions with Materials and Atoms , 371 , 387–391.10.1016/j.nimb.2015.09.054
- Ishii, K. , Terakawa, A. , Matsuyama, S. , Hasegawa, A. , Nagakubo, K. , Sakurada, T. , … Fujiwara, M. (2012). Measures against radioactive contamination due to Fukushima first nuclear power plant accidents part III: Removing and decontamination of contaminated soil. International Journal of PIXE , 22 , 13–19.10.1142/S0129083512400323
- Ishii, K. , Terakawa, A. , Matsuyama, S. , Kikuchi, Y. , Fujishiro, F. , Ishizaki, A. , … Kim, S. (2014). Reducing logistical barriers to radioactive soil remediation after the Fukushima No. 1 nuclear power plant accident. Nuclear Instruments and Methods in Physics Research Section B: Beam Interactions with Materials and Atoms , 318 , 70–75.10.1016/j.nimb.2013.06.067
- Laceby, J. P. , Chartin, C. , Evrard, O. , Onda, Y. , Garcia-Sanchez, L. , & Cerdan, O. (2016). Rainfall erosivity in catchments contaminated with fallout from the Fukushima Daiichi nuclear power plant accident. Hydrology and Earth System Sciences , 20 , 2467–2482.10.5194/hess-20-2467-2016
- Malamud, B. D. , Turcotte, D. L. , Guzzetti, F. , & Reichenbach, P. (2004). Landslides, earthquakes, and erosion. Earth and Planetary Science Letters , 229 , 45–59.10.1016/j.epsl.2004.10.018
- Ministry of Education, Culture, Sports, Science and Technology, Kikankonnankuikinituite [The data about the difficult-to-return-to area] . (2013). Retrieved from http://www.mext.go.jp/b_menu/shingi/chousa/kaihatu/016/shiryo/__icsFiles/afieldfile/2013/10/02/1340046_4_2.pdf
- Ministry of the Environment, Government of Japan, Progress on off-site cleanup and interim storage facility in Japan . (2017). Retrieved from http://josen.env.go.jp/en/pdf/progressseet_progress_on_cleanup_efforts.pdf
- Ohnuma, T. , & Ishii, K. (2017). An analysis of radioactivity distribution in soil particles using an autoradiogram method. Cogent Engineering , 4 , Article ID: 1326200.
- Tagami, K. , Uchida, S. , Uchihori, Y. , Ishii, N. , Kitamura, H. , & Shirakawa, Y. (2011). Specific activity and activity ratios of radionuclides in soil collected about 20 km from the Fukushima Daiichi Nuclear Power Plant: Radionuclide release to the south and southwest. Science of the Total Environment , 409 , 4885–4888.
- Thai, P. K. , Suka, Y. , Sakai, M. , Nanko, K. , Yen, J. H. , & Watanabe, H. (2015). Export of radioactive cesium from agricultural fields under simulated rainfall in Fukushima. Environmental Science Processes & Impacts , 17 , 1157–1163.10.1039/C5EM00063G