
 ?Mathematical formulae have been encoded as MathML and are displayed in this HTML version using MathJax in order to improve their display. Uncheck the box to turn MathJax off. This feature requires Javascript. Click on a formula to zoom.
Abstract
In this current research, the mechanical, physical and tribological properties of kenaf fibre particle reinforced epoxy (KPafRE) composite was investigated. Randomly distributed kenaf fibre particles were used as reinforcement, with fibre particle loading up to 20%wt. Five mechanical tests were conducted: tensile, compression, flexural, hardness and impact tests, also an additional water absorption test. For tribology investigation, dry sliding test was conducted on a Pin on Disk (POD) machine under 5–20 N applied load at 2.8 m/s, for 6.72 km sliding distance. The results from these tests were compared with Neat Epoxy (NE). It was found that KPafRE composite showed improved mechanical properties compared to NE. The results also suggest that 15%wt. KPafRE composite is the optimum fibre particle loading condition. Applications for this composite would include for construction industry for parts such as sliding door and window panels, also hinges (replacing expensive aluminum ones currently in use). In the automotive industry, the composite could replace plastic parts currently being used in door linkages, dashboard or door aesthetic piece, also bearing or bushes.
PUBLIC INTEREST STATEMENT
From powering our homes and vehicles to bathing soap and cell phones, human dependency on crude oil and petroleum based products has never been higher. However, the environmental impacts associated with crude oil extraction, transporting and processing is of grave concern. Accidental oil spills, oil discharge into the ocean causes degrading marine and human life, and causes ecological and environmental damage to the surrounding areas. On top of that, one day the world’s oil wells will be depleted. As a consequence, for decades researches have been sourcing alternatives for fuel and materials. Natural fibres have been used as fillers to reduce plastic dependency and save weight for some time. For example, in the automobile industry, large car makers are using natural fibres to make interior parts. Therefore, understanding the behavior of natural fibres such as kenaf is crucial to determine its potential applications in the near future.
1. Introduction
Composite materials have been in use for centuries. Early types of composite materials include plywood and straw reinforced mudbricks used for construction (Pihtili, Citation2009). In the early nineteenth century, discovery of polymers has spearheaded the development of composite materials based on synthetic fibres (Chawla, Citation2012). Today, composite materials are used in bridges, structures, gears, boats and even in airplane bodies. However, widespread concerns with the biodegradability and environmental impacts associated with the usage of synthetic fibres have led researches to develop composites based on natural fibres. Compared with synthetic fibres, natural fibres offer advantages such as high specific strength, low density, less abrasive to processing equipment and environmentally friendliness (Faruk, Bledzki, Fink, & Sain, Citation2012; Saheb & Jog, Citation1999; Yousif & El-Tayeb, Citation2013). Also as these fibres grow in abundance, they are cheap and relatively easy to obtain (Raju, Ratnam, Ibrahim, Rahman, & Yunus, Citation2008).
Natural fibres consist primarily of cellulose and lignin, followed by hemicelluloses and pectin (Khalil, Ismail, Rozman, & Ahmad, Citation2001; Mahjoub, Mohamad Yatim, & Mohd, Citation2014). These four constituents contribute to the overall property of the natural fibre, and the proportions can vary, depending on the fibre type. For example, cellulose is a semi-crystalline polysaccharide component, and has molecules which consist of many polar hydroxyl groups. This gives the fibre its hydrophilic characteristics, as well as influencing its mechanical properties (Fuqua, Huo, & Ulven, Citation2012) (Kelly, Citation1994). Hemicellulose controls moisture absorption and biodegradation (Thakur & Thakur, Citation2014; Venkateshwaran, Perumal, & Arunsundaranayagam, Citation2013). Lignin is a cross linked biopolymer which give the fibre rigidity, and is responsible for thermal stability (Venkateshwaran et al., Citation2013).
Although there are many benefits of using natural fibres, its hydrophilic nature causes it to absorb high amounts of moisture from the environment. When used to form a composite, this leads to poor interfacial adhesion strength between the fibre and polymer matrix (Nam, Ogihara, Tung, & Kobayashi, Citation2011), the most important parameters which determine the properties of the composite (Eichhorn et al., Citation2001; Huber et al., Citation2012). Fibre treatment with 5–6% sodium hydroxide (NaOH) for a limited period of time has been widely reported to improve interfacial adhesion strength between fibres and polymer matrix. It increases surface roughness, decreases the number of cellulose exposed on the fiber surface, removes lignin, hemicellulose, wax and oils covering the surface of the fiber (Li, Tabil, & Panigrahi, Citation2007). The chemical process of fibre treatment using NaOH can be summarized as below:
Fibre—OH + NaOH = Fibre—O−NA+ + H2O
Mahjoub and associates have investigated the effects of using various percentage and immersion time in alkaline treatment on tensile strength of kenaf fibre (Mahjoub et al., Citation2014). It was reported that 5% alkaline fibre treatment for three hours showed the highest tensile strength. The SEM images showed that using 10% and 15% alkaline treatment, the fibres showed damaged texture, and made it brittle and twisted, reducing the tensile properties. A similar trend was observed for the tensile modulus. In another work, Hameem and associates have investigated the effect of water absorption on tensile and flexural properties of both treated and untreated napier grass fibre reinforced polyester composite (Haameem et al., Citation2016). They reported that all tested specimens showed degradation in properties once immersed in water. However, untreated napier grass fibre composites showed higher water absorption, which resulted in reduced tensile and flexural strength compared to treated napier grass fibre composites.
Another important parameter which influences composite properties are the fibre loading, or weight percentage. Mechanical properties such as tensile, flexural and impact strength are greatly affected by adding more fibre. However, the addition of fibre beyond its optimum loading condition leads to insufficient wetting of the fibres, which leads to poor stress transfer from the polymer matrix to fiber (Kaewtatip & Thongmee, Citation2012; Ku, Wang, Pattarachaiyakoop, & Trada, Citation2011; Singha & Thakur, Citation2010). Prasad and associates have investigated the mechanical properties of jowar, sisal and bamboo reinforced polyester composite at different fibre volumefractions, up to 40% (Prasad & Rao, Citation2011). It was reported that all three types of composite showed similar trend, whereby tensile and flexural properties of the composites showed a maximum at 40%vol. In another study, Anbukarasi and associates have studied the effect of treated and untreated fibre volumefractions on mechanical and water absorption behavior of luffa reinforced epoxy composites (Anbukarasi & Kalaiselvam, Citation2015). It was reported that in general, treated fibres performed much better than untreated ones. Also, for tensile, compressive and impact test, the optimum fibre volumewas found to be 40%. This indicates that 30%vol. fibres were too little, while at 50%vol. there were too much fibres to provide sufficient blend of fibres and matrix. In the water absorption test, it was found that specimens with higher fibre %vol. resulted in more water being absorbed. However, treated fibre composites absorbed less water than untreated ones, which shows the benefits of surface treatment in changing the fibre surface and improving interfacial strength between fibre and matrix.
Kenaf is a plant in the Malvaceae family. It is a variety of hibiscus, and has a pithy stem surrounded by fibres (Chia, Zakaria, Nguyen, & Abdullah, Citation2008). The bark constitutes 25–30% of the whole plant and is made up of relatively long fibre while the core contains relatively short fibre. These plants can grow up to 5 to 6 m tall, and has a maturity period of three to four months. They are found primarily in Africa, China, India and Bangladesh (Wong, Mat Daham, Abdul Aziz, & Abdullah, Citation2008). The fibres can be used for animal feed and bedding, pulp for paper industry, composite boards, food packaging, automotive components, and construction materials (Annual Report, Citation2012).
In Malaysia, Kenaf is an industrial crop. It is grown primarily in the states of Kelantan, Terengganu, and Pahang. Safe to stay that there is an abundance in supply, and as a result, the Malaysian government and National Kenaf and Tobacco Board has for years strived to grow and research this crop as a national commodity (Wong et al., Citation2008) (Hadi, Abdu, Junejo, Abdul Hamid, & Ahmed, Citation2014). Several works have been published on the mechanical properties of kenaf fibre reinforced composites (Fairuz, Sapuan, Zainudin, & Jaafar, Citation2016; Krishna & Kanny, Citation2016; Saba, Paridah, & Abdan, Citation2016; Saba, Paridah, Abdan, & Ibrahim, Citation2016a, Citation2016b; Yusoff, Takagi, & Nakagaito, Citation2016). However, to the authors’ best knowledge, no work has been published on the mechanical properties of treated kenaf fibre particles in epoxy composite, using various weight fractions and hand layup method.
2. Methodology
2.1. Fibre particle preparation
Kenaf fibres were obtained from the Board of Kenaf and Tobacco (LKTN), Malaysia. The received fibres were a combination of long fibres, short fibres as well as particles, as shown in Figure . These particles were separated from the fibres by using a steel mesh, with an opening size of 0.05 mm.
Figure 1. Kenaf fibre particles.
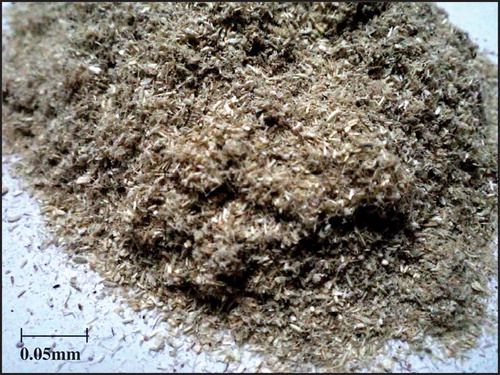
These extracted particles were then rinsed and soaked for 48 h, at room temperature (28ºC). After that, the particles were treated by soaking in 6% NaOH solution for half-hour at room temperature. The particles were then rinsed in distilled water and left for dry. Finally, post-curing is done in an oven for 5 h, at 45ºC.
2.2. Composite fabrication
Prior to composite fabrication, the particles were weighted. The weight fractions were calculated using the Eqn. 1:
where;
% Wf is the weight fraction of kenaf particle fillers in the composite.
Wk is the weight of kenaf fillers.
Wr is the weight of the resin.
A two-part epoxy resin was used as polymer matrix. Auto-Fix 1710A and its hardener Auto-Fix 1345B epoxy resin was purchased from Bonding Technology Resources Sdn. Bhd., Malaysia had been used to develop the kenaf fibre particle reinforced epoxy (KPafRE) composites. The epoxy was in liquid form with density 1100kg/m3 and viscosity 15,000 mPa.s (properties at 25°C) and it is generally used in various applications such as automotive, yacht and other composite component fabrication. First, Auto-Fix 1710A epoxy resin was mixed with 5 %wt. of kenaf fibre particles by means of an electrical stirrer before hardener was added with ratio of 1:1 to the resin. A closed mould with a dimension of 200 mm × 100 mm × 20 mm was used in the preparation of the composite by means of hand layup method. The inner surfaces of the mould were sprayed with a thin layer of silicone as a release agent. When the mould was completely filled with the mixture, it was covered with a steel plate and a pressure of 5 kPa was applied as to force out the trapped air. Keeping the pressure intact, the composite block was cured for 24 h at room temperature (28 ± 2°C). The hardened composite was removed from the mould and post cured in an oven at 80°C for one hour for complete curing. Similar method was used to fabricate other composites with 10, 15 and 20%wt. of kenaf fibre particles. For comparison purpose, the results will be compared with Neat Epoxy (NE).
Table shows the length and density properties for kenaf particle, resin, as well as the fabricated composite used for testing.
Table 1. Particle, resin and composite characteristics
3. Testing procedure
3.1. Mechanical tests
3.1.1. Tensile test
The tensile test was performed on a Universal Testing Machine (Brand: Instron, Model: 3367), in accordance to ASTM D638-02. For each test, the test specimens were clamped on the top and bottom clamps of the UTM prior to the test starting. Once started, the cross-head moves vertically upward at a speed of 5 mm/min until specimen failure. The force and displacement values are then recorded. Five specimens were tested for each composite type, and the average results was calculated.
Tensile strength, tensile strain and modulus of elasticity were obtained by using the following formulas:
Tensile strength, (2)
where;
F = Applied Load (N)
A o = Cross-sectional area of test composite (m2)
Strain, (3)
where;
l i = Instantaneous length (m)
l o = Original length (m)
Young’s Modulus, (4)
3.1.2. Flexural test
The flexural test was conducted on a Universal Material Tester (Brand: Gunt Hamburg, Model: WP300), in accordance to ASTM D790-02. A 3-point bending set up was done with supports along the specimen span. Once started, the mid-point was bent until specimen failure. Five specimens were tested for each composite type, and the average value was calculated.
Flexural strength and flexural modulus were calculated using the following formula:
Flexural Strength,
where;
P = Peak Load (N)
L = Support span (m)
b = Width of material (m)
d = Depth of specimen (m)
where;
m = The slope of the linear elastic portion of the load deflection curve.
L = Support span
b = Width of material (m)
d = Depth of specimen (m)
3.1.3. Impact test
The impact test was performed on a Charpy Impact Machine, in accordance to ASTM D6110-04. For this test, a 7.5 J (J) pendulum was used. The specimen was held in place and positioned such that the v-notch is facing away from the pendulum. The pendulum was then set at 150° height before being released. Five specimens were tested, and the average values were calculated.
3.1.4. Compression test
The compression test was performed on a Universal Material Tester (Brand: Gunt Hamburg, Model: WP300), with reference to ASTM D695-02a. First, the specimen was set up on the UMT. Load is then applied at an increment of 0.2 mm, until failure occurs. Five specimens were tested for each composite type, and the average values were calculated.
Compressive strength was calculated using the following formula:
3.1.5. Hardness test
For hardness test, a ‘Shore D’ durometer (Brand/Model: TH210, ± 0.2 Shore D) was used. The device auto-calibrates during start, has a range of up to 100 Shore D and can display readings up to 1 decimal place. First, the specimen was placed on a flat surface. The durometer was then switched on and reset to zero. The meter was held upright perpendicular to the specimen. After that, the durometer was pressed onto the specimen till the sharp pointer on the bottom of the machine pierced into the specimen surface, and the “pressure foot” of the durometer is sitting flat on the specimen. The reading on the meter was then recorded. Five specimens were tested for each composite type, and the average values were calculated.
3.1.6. Water absorption test
The water absorption test was conducted according to ASTM D570-98. Firstly, the test specimen is weighed to obtain the dry weight. The specimen was then immersed in a contained which is filled with water and enclosed. The container was left overnight for 16 h. The test specimen was removed from the container, wiped and weighed to obtain its wet weight. Three specimens were prepared for each composite type, and the average values were calculated.
The weight increase percentage was calculated based on the following formula:
3.2. Tribology testing
Wear and frictional performance of the KPafRE composite with different particle weight fractions was conducted on a POD tribo-wear test rig at room temperature (28 ± 2°C). A schematic view on the machine setup is shown in Figure , which is built based on ASTM G-99–05 standard. A digital weight indicator (Brand: Dibal, Model: VD-310) integrated directly to the load cell (Brand: Accutec, Model: B6N-50, ± 0.05 kg) was adopted to capture frictional forces up to 3 decimal places at the sliding zone.
Figure 2. Schematic illustration of a Pin-On-Disk (POD) tribo-machine.
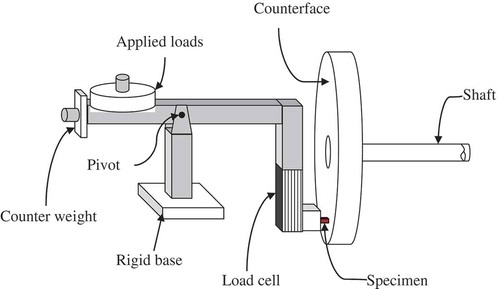
For the test, KPafRE composite specimens were subjected against a stainless steel counterface (ASTM B611, 1250HB). Before conducting the test, the counterface was polished with different grades of SiC abrasive paper; that is No.400, 600, 800, 1000. In order to ensure high intimate contact between the counterface and the test composites, the test specimens were polished with abrasive paper grade 800. The sliding surfaces of the test specimens were then cleaned with a soft clean cloth and their initial weights taken using a ± 0.1 mg digital weight indicator (model: Shimadzu AW120), capable of displaying up to 4 decimal places. In the test parameter, adhesive dry sliding test of each specimen was carried out subjected to normal applied loads of 5 N, 10 N, 20 N and 30 N through different sliding distance (0–6.72 km) with a constant sliding speed of 2.83 m/s.
4. Testing results
4.1. Mechanical test
4.1.1. Tensile test
Figure shows the average tensile strength for NE and KPafRE composite at different fibre particle weights. It can be seen that all KPafRE composites showed higher tensile strength compared to NE, that is NE has the lowest tensile strength of 6.17 MPa. Improvements in tensile strength was 176% with addition of 5%wt. kenaf particles, to 370% when 15%wt. kenaf particles were added. This shows that the addition of kenaf fibre particle as reinforcement improves the tensile property of epoxy. Also, there is an increasing trend of tensile strength with particle percentage, showing a maximum of 29 MPa with when reinforced with 15%wt. kenaf particles. This trend is seen because higher particle content increases the composite stiffness (Yousif, Lau, & Mcwilliam, Citation2010; Faruk et al., Citation2012). However, upon reaching maximum particle weight percentage, additional percentage of kenaf only reduces the tensile strength due to the insufficient polymer present for good particle wettability as well as an increase in structural porosity component in the composite (Krishnaprasad et. al., Citation2009; Madsen & Lilholt, Citation2003). A similar trend was observed for the modulus of elasticity, as shown in Figure .
Figure 3. Average tensile strength for NE and KPafRE composite at different fibre particle weight percentages.
Figure 4. Average modulus of elasticity for NE and KPafRE composite at different fibre particle weight percentages.
4.1.2. Flexural test
Figure shows the average flexural strength for NE and KPafRE composite at different particle weight fractions. It can be seen that all KPafRE composites showed higher flexural strength compared to NE, except for 5%wt. kenaf particle, which was nearly same with NE i.e. 46.14 MPa. Improvement achieved by reinforcing epoxy with kenaf particles were in the range of 40% to 80%, with 15%wt. KPafRE showing the maximum with a flexural strength of 83.05 MPa. Beyond the 15%wt. optimal fibre particle loading condition, the flexural strength reduces. Similar trend could be observed from the flexural modulus comparisons, Figure . The improvement in flexural strength with kenaf particles was due to the improved adhesion between matrix and particles as well as the improved capability of particle to support the bending stress, compared to NE (Anbukarasi & Kalaiselvam, Citation2015).
Figure 5. Average flexural strength for NE and KPafRE composite at different fibre particle weight percentages.
Figure 6. Average flexural modulus for NE and KPafRE composite at different fibre particle weight fractions.
4.1.3. Impact test
Figure shows the average impact strength for NE and KPafRE composite at different particle weight fractions. It can be seen that all KPafRE composites showed higher impact strength compared to NE, that is NE showed the lowest impact strength of 0.1 J. Improvement in impact strength was in the range of 270% to 700%, with 15%wt. KPafRE showing the maximum with an impact strength of 0.8 J. This shows that in its pure form, epoxy has poor impact absorption capability. However, the addition of treated kenaf particles improves this up to the optimal fibre particle loading of 15%wt.
Figure 7. Average impact strength for NE and KPafRE composite at different fibre particle weight percentages.
4.1.4. Compression test
Figure shows the average compression strength for NE and KPafRE composite at different particle weight fractions. It can be seen that all KPafRE composites showed higher compression strength compared to NE, that is NE has the lowest compression strength of 45.14 MPa. Improvement achieved when reinforcing NE with kenaf particles were in the range from 59% to a maximum of 104% for 15%wt. KPafRE composite. In other words, reinforcing NE with 15%wt. kenaf helped to improve the compression strength by 104%, to 91.88 MPa. At 20% kenaf particles, the compression strength drops slightly to 84.32 MPa, still much higher than NE. This trend shows that adding kenaf particles improves the compressive strength of epoxy.
Figure 8. Average compression strength for NE and KPafRE composite at different fibre particle weight percentages.
4.1.5. Hardness test
Figure shows the average hardness for NE and KPafRE composite at different particle weight fractions. It can be seen that all KPafRE composites showed higher hardness compared to NE, that is NE has the lowest hardness of 71.1 Shore D. Percentage improvement achieved when reinforcing NE with kenaf particles were in the range from 7 % to a maximum of 18% for 10%wt. KPafRE composite. In other words, reinforcing NE with 10%wt. kenaf particles helped to improve the hardness strength by 18%, to 83.9 Shore D.
Figure 9. Average hardness for NE and KPafRE composite at different fibre particle weight percentages.
4.1.6. Water absorption test
Figure shows the water absorption percentage for NE and KPafRE composite at different particle weight fractions. It can be seen that all KPafRE composites showed higher percentage of water absorption compared to NE. Also, there is a correlation between %wt. of particles used and water absorption percentage. At 20% wt., the KPafRE composite showed maximum water absorption of 3.51%, compared to NE with only 1.6% absorption. Similar findings were reported in previous work (Anbukarasi & Kalaiselvam, Citation2015). This was expected, since natural particles are hydrophilic in nature, it tends to absorb and retain water. However, treatment with NaOH does reduce water uptake, by contracting the particle cellulose walls (Haameem J.A. et al., Citation2016).
Figure 10. Average water absorption for NE and KPafRE composite at different fibre particle weight percentages.
4.2. Tribology testing
Figure shows the average Ws for both NE and KPafRE composite at different particle weight fractions, under various applied loads, with a sliding velocity of 2.83 m/s (Nirmal, Lau, Hashim, Devadas, & Yuhazri, Citation2015). Under all applied loads, KPafRE composites showed lower Ws compared to NE. For example, for 15% particle weight fraction, Ws reduced by 65% for 5 N, 67% for 10 N and 20 N, and 58% for 30 N. This shows that the kenaf particles assisted in reducing wear during sliding. For both NE and KPafRE, it can be seen that as the load increase, the Ws reduces, with 30 N showing the lowest Ws. This was due to the effective forming of the protective layer consisting of wear debris at higher loads, as described earlier. Finally, it is clear to be seen that under all applied loads, 15% weight fraction KPafRE has the lowest Ws, which indicates it is the optimal fibre particle loading condition.
Figure 11. Average Ws for NE and KPafRE composite during steady state transitions (5.0 km) at different particle weight fractions.
Figure shows the average friction coefficient for both NE and KPafRE composite at different particle weight fractions, under various applied loads, with a sliding velocity of 2.83 m/s. It can be seen that generally, friction coefficient increases with applied load. This was due to the increase in surface contact which causes an increase in friction, as described earlier. Also under all tested loads, KPafRE shows lowest friction, with 15%wt. KPafRE showing the lowest. The reduction was 50% (5 N), 56% (10 N), 51% (20 N) and 41% (30 N) respectively compared to NE. This could help explain the low Ws results obtained with 15% wt. KPafRE as described earlier.
Figure 12. Average friction coefficient for NE and KPafRE composite during steady state transitions (3.36 km) at different particle weight fractions.
4.3. Morphology of tested specimens
Figure (a)–(e) shows the SEM images of NE and KPafRE composites after tensile test. It can be seen that in the resinous regions, the failure mechanism appears to be cracking of the epoxy. On the other hand, in the fibrous regions there appears to be minor as well as major delamination of the particles. Figure (e) shows SEM image of 20%wt. KPafRE composites after tensile test. Voids can be seen between the particles, indicating poor wettability of the particles due to insufficient polymer. This observation is in agreement with the tensile test results, as seen in Section 4.1, whereby the optimal fibre particle loading condition was found to be 15%wt. KPafRE composite.
Figure 13. SEM images of KPafRE composites after tensile test.
(Remarks: Cr = Crack, MiDI = Minor Delamination, MaDl = Major Delamination, Vo = Voids, Re = Resinous Region, Fb = Fibrous Region)
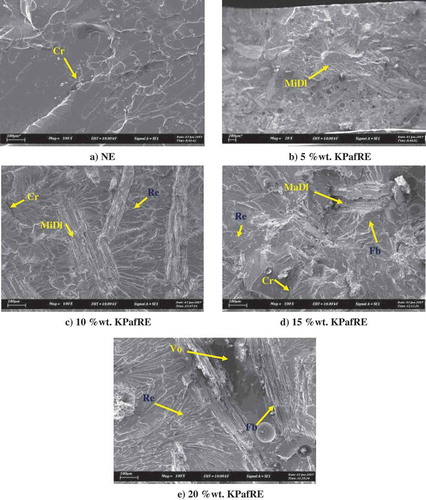
Figure (a)–(e) shows the SEM images of NE and KPafRE composites after flexural test. A similar trend is observed, whereby the failure mechanism appears to be cracking in the resinous and micro and macro delamination of the particles. Also, there appears to be slight particle debonding for 20%wt. KPafRE composite, as shown in Figure (e). This observation could help explain the lower flexural strength beyond the 15%wt. optimal fibre particle loading condition as seen in Section 4.1.
Figure 14. SEM images of KPafRE composites after flexural test.
(Remarks: Cr = Crack, MiDI = Minor Delamination, MaDl = Major Delamination, Deb = Debonding, Re = Resinous Region, Fb = Fibrous Region)
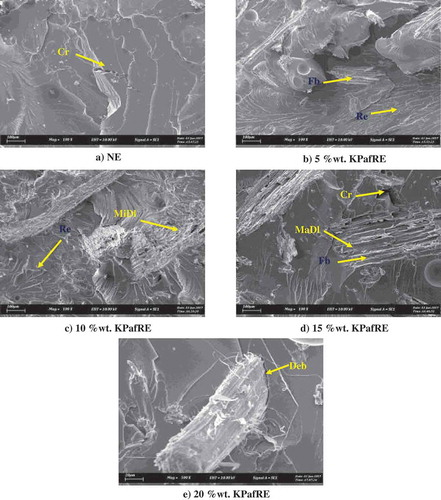
Figure (a)–(e) shows the SEM images of NE and KPafRE composites after impact test. Once again, the failure mechanism appears to be cracking in the resinous and micro delamination up to the 15%wt. optimal fibre particle loading condition. Beyond this loading, macro delamination is observed, in agreement with the impact test results as seen in Section 4.1.
Figure 15. SEM images of KPafRE composites after impact test.
(Remarks: Cr = Crack, MiDI = Minor Delamination, MaDl = Major Delamination, De = Debonding, Re = Resinous Region, Fb = Fibrous Region)
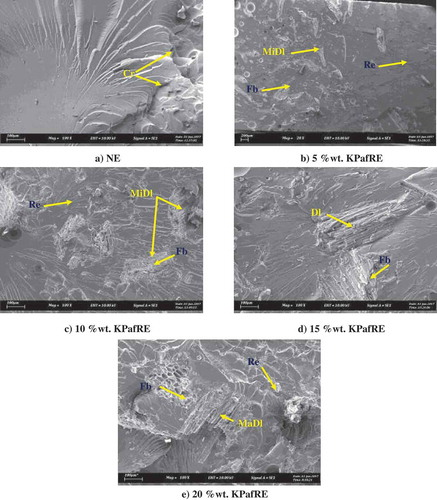
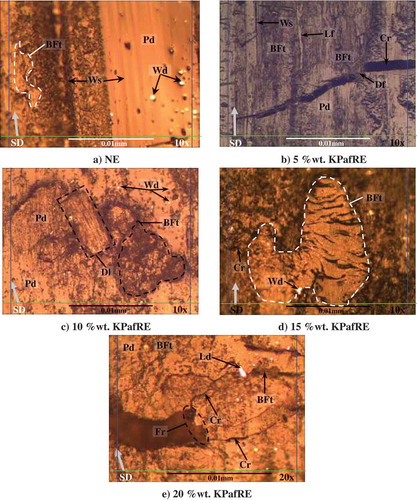
Figure (a)–(e) shows the microscopy images of tribology test specimens after sliding for 6.72 km, subjected to 30 N applied load as reported in a previous work (Nirmal et al., Citation2015). It was reported that significant amounts of back transfer film were present in the KPafRE specimens after testing, especially for 15%wt. This is strong indication that the presence of kenaf fibre particles helped to form this protective layer on the composite surface, which helped to reduce wear.
Figure 16. Optical photo micrographs of NE and KPafRE composite at 30 N applied loads subjected to 6.72 km sliding distances and 2.83 m/s counterface sliding velocity.
(Remarks: BFt = Back Film Transfer, Ws = Wear Scar, Pd = Plastic Deformation, Wd = Wear Debris, Fr = Fracture, Dl = Delamination, Cr = Crack, Ld = Large Debris, Df = Detached Fibre, Db = Debris, De = Debonding, Lf = Loose Fibre)
4.4. Statistical analysis
An ANOVA statistical analysis was conducted on the mechanical test results, to determine if the mean between groups of tested composites are “statistically different”. This tells that the results reliable and not by chance or sampling error. The following being the hypothesis, where µ1, µ2 and so on are the specific specimen mean, and µm is any of the specimen means:
Figure shows an example of the results obtained using excel:
Figure 17. ANOVA results for tensile test.
A complete set of the results covering all 6 tests are shown in Table . As can be seen, the p-value for all tests are well below 0.05, which suggest that there is good indication the mean between groups are statistically significant. Hence, we reject the null hypothesis.
Table 2. ANOVA results for mechanical tests
However, this analysis alone does not tell if every mean is different from one another in a given test; it only tells that there is at least 1 mean that is different. To look further into the results, a two-sample t-test was performed between for all two group combinations, within each test. An example of the results for the pairing of NE and 5%wt. KPafRE for tensile test using excel is shown in Figure . A summary of p-value results for every possible group pairing for each test is shown in Table .
Table 3. Summary of 2-sample t-test results for mechanical tests
Figure 18. 2-sample t-test results for NE vs. 5%wt. KPafRE.
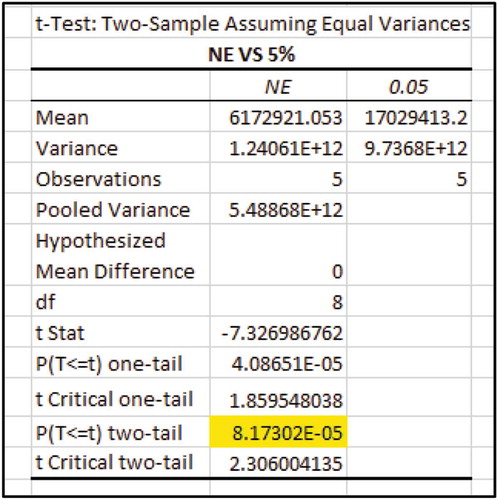
Overall the p-values for tensile, compression, impact and flexural test are less than 0.05. However, hardness and water absorption tests shows many p-values much higher (highlighted in red). This could be due to the method of testing itself, which are more manual than the others and requires consistency on the part of the person performing the tests. For example, in the case of water absorption test, specimens had to be wiped before being placed on the weighing scale. Hence there is a chance for unequal wiping of specimens for example which could lead to errors. The overlapping error bars in Figure further corroborates the results seen here.
5. Discussions
Table shows tensile, compression and flexural property comparison between the KPafRE composite and some recently published works. Comparing tensile strength, 15%wt. KPafRE composite has higher strength than NE or NP, and almost as strong as kenaf fibre mat reinforced composite, and stronger than short fibre kenaf. The tensile strength is also comparable to composites reinforced with other natural fibres like jute, coir, sisal and sugarcane fibres. For the flexural strength, 15%wt. KPafRE composite showed better results than NE and NP, and much better than previous works done on kenaf fibre, as well as other natural fibres like coir, sisal, jowar, napier grass, and bamboo. The flexural strength of 15%wt. KPafRE was even higher than glass fibre reinforced polymer. 15%wt. KPafRE composite also showed better compressive strength than sugarcane fibre reinforced polyester. Table shows the impact energy and hardness property comparison between KPafRE composite and previously reported works done on other natural and synthetic fibres. It can be seen that 15%wt. KPafRE composite has higher impact strength than NE and jute reinforced composite. In terms of hardness, 15%wt. KPafRE is only slightly lower than date palm, graphite and coconut reinforced epoxy composites. Table shows the water absorption percentage of KPafRE composite and previously reported works done on other natural fibres. It can be seen that 15%wt. KPafRE absorbs more water than luffa fibre, but lesser than short napier grass composite.
Table 4. Tensile, flexural and compressive properties of various natural and synthetic fibre based polymeric composites
Table 5. Impact energy and hardness properties of various natural and synthetic fibre-based polymeric composites
Table 6. Water absorption of various natural fibre-based polymeric composites
Table compiles the tribology results of some of the recent published works done on natural and synthetic fibre composites. From the table, it can be seen that reinforcing epoxy resin with kenaf particles makes this composite as good, if not better than the other composites. By comparing to NE and NP for example, 15%wt. KPafRE composite shows much better wear performance. This is also the case when comparing with bamboo and oil palm based composite, and close to wear performance of betelnut fibre composite as well.
Table 7. Tribological properties of various natural and synthetic fibre-based polymeric composites
6. Conclusion
After performing all testing and evaluations, the following conclusions can be made.
There was a significant improvement in mechanical properties when neat epoxy was reinforced with kenaf fibre particles. This was due to the particles which acts as load carrying members, not only helping to stiffen the composite, but improve bending, flexibility and overall load distribution.
There was a significant improvement in Ws and friction coefficient when neat epoxy was reinforced with kenaf particles. The addition of these particles helped improve Ws and friction coefficient of neat epoxy by an average of 64% and 50% respectively.
It was observed that in this case, the critical fibre loading condition was found to be 15%wt. KPafRE. Below this critical fibre loading of 15%wt., the KPafRE has too few particles to provide strength and stiffness to epoxy, whereas above it results in a more brittle and unstable KPafRE composite due to the insufficient polymer present for good particle wettability as well as an increase in structural porosity component in the composite.
Predominant failure mechanism for mechanical testing appeared to be cracking in resinous region, and delamination of kenaf fibre particles, whereas in the wear tests, it was back film transfer where it assisted in protecting the composite surface from further wear during the sliding process.
Statistical analysis showed that the mean between specimens in the mechanical test results were significant, except for both hardness and water absorption tests whereby human errors could have caused the readings to overlap by high margins.
Data Availability Statement
The author confirms that the data supporting the findings of this study are available within this article and its supplementary materials.
Additional information
Notes on contributors

Umar Nirmal
Alvin Devadas The author’s primary research is in the field of natural fibre polymeric composites. Various works have been performed to study the mechanical and tribological properties of natural fibres including kenaf, betelnut and bamboo, leading to several publications. In the present research, the properties of kenaf particles are investigated to gauge its suitability in sliding wear applications such as automotive bushings, or window panels. These particles are also waste products, often discarded or burned after fibre processing. As such, its usage minimizes wastage and reduce pollution. Very few works have been published studying the properties of kenaf fibre, even fewer of kenaf particles. This opens the door to a whole new fibre market, contributing to reducing dependency to petroleum based materials.
References
- Anbukarasi, K. , & Kalaiselvam, S. (2015). Study of effect of fibre volumeand dimension on mechanical, thermal, and water absorption behaviour of luffa reinforced epoxy composites. Materials & Design (1980-2015) , 66, 321–330. doi:10.1016/j.matdes.2014.10.078
- Annual Report . (2012). National Kenaf and Tobacco Board.
- Asumani, O. M. L., Reid, R. G., & Paskaramoorthy, R . (2012). The effects of alkali – silane treatment on the tensile and flexural properties of short fibre non-woven kenaf reinforced polypropylene composites. Composites: Part A, 43, 1431–1440. doi: 10.1016/j.compositesa.2012.04.007
- Basavarajappa, S. , & Ellangovan, S. (2012). Dry sliding wear characteristics of glass – Epoxy composite filled with silicon carbide and graphite particles. Wear , 296, 491–496. doi:10.1016/j.wear.2012.08.001
- Bisaria, H. , Gupta, M. K. , Shandilya, P. , & Srivastava, R. K. (2015). Effect of Fibre Length on Mechanical Properties of Randomly Oriented Short Jute Fibre Reinforced Epoxy Composite. Materials Today: Proceedings , 2, 1193–1199. doi:10.1016/j.matpr.2015.07.031
- Chawla, K. K. (2012). Composite materials: Science and engineering (3rd ed.). Springer-Verlag-New York.
- Chen, H. , Yu, Y. , Zhong, T. , & Wu, Y. (2016). Effect of alkali treatment on microstructure and mechanical properties of coir fibres, coir fibre reinforced-polymer composites and reinforced-cementitious composites. Construction and Building Materials, 112, 168–182. doi:10.1016/j.conbuildmat.2016.02.182
- Chia, C. H. , Zakaria, S. , Nguyen, K. L. , & Abdullah, M. (2008). Utilisation of unbleached kenaf fibers for the preparation of magnetic paper. Industrial Crops and Products , 28(3), 333–339. doi:10.1016/j.indcrop.2008.03.012
- Chin, C. W. , & Yousif, B. F. (2009). Potential of kenaf fibres as reinforcement for tribological applications. Wear , 267, 1550–1557. doi:10.1016/j.wear.2009.06.002
- Eichhorn, S. J. , Baillie, C. A. , Zafeiropoulos, N. , Mwaikambo, L. Y. , Ansell, M. P. , Dufresne, A. , … Wild, P. M. (2001). Review: Current international research into cellulosic fibres and composites. Journal of Materials Science , 36(9), 2107–2131. doi:10.1023/A:1017512029696
- El-Tayeb, N. S. M . (2009). Development and characterisation of low-cost polymeric composite materials. Materials and Design , 30 (4), 1151–1160. doi:10.5539/jmsr.v3n2p23
- Fairuz, A. M. , Sapuan, S. M. , Zainudin, E. S. , & Jaafar, C. N. A. (2016). Effect of filler loading on mechanical properties of pultruded kenaf fibre reinforced vinyl ester composites. Journal Mechanisms Engineering Sciences , 10(1), 1931–1942. doi:10.15282/jmes
- Faruk, O. , Bledzki, A. K. , Fink, H. , & Sain, M. (2012). Biocomposites reinforced with natural fibers : 2000 – 2010. Progress in Polymer Science , 37(11), 1552–1596. doi:10.1016/j.progpolymsci.2012.04.003
- Fuqua, M. A. , Huo, S. , & Ulven, C. A. (2012). Natural fiber reinforced composites. Polymer Reviews , 52(3), 259–320. doi:10.1080/15583724.2012.705409
- Haameem J.A., M. J. A. , Abdul Majid, M. S. , Afendi, M. , Marzuki, H. F. A. , Hilmi, E. A. , Fahmi, I. , Gibson, A. G. ,(2016). Effects of water absorption on Napier grass fibre/polyester composites. Composite Structures , 144, 138–146. doi:10.1016/j.compstruct.2016.02.067
- Hadi, M. A. B. , Abdu, A. , Junejo, N. , Abdul Hamid, H. , & Ahmed, K. (2014). Journey of kenaf in Malaysia : A review. Sciences Researcher Essays , 9(11), 458–470. doi:10.5897/SRE12.471
- Hameem, M. J . A., Abdul Majid, M. S., Afendi, M., MArzuki, H. F. A., Ahmad Hilmi, E., Fahmi, I., & Gibson, A. G. (2016). Effect of water absorption on napier grass fibre/polyester composites. Composite Structures, 144, 138–146. doi:10.1016/j.matdes.2011.03.015
- Huber, T. , Müssig, J. , Curnow, O. , Pang, S. , Bickerton, S. , & Staiger, M. P. (2012). A critical review of all-cellulose composites. Journal Materials Sciences , 47(3), 1171–1186. doi:10.1007/s10853-011-5774-3
- Kaewtatip, K. , & Thongmee, J. (2012). Studies on the structure and properties of thermoplastic starch/luffa fiber composites. Materials & Design , 40, 314–318. doi:10.1016/j.matdes.2012.03.053
- Kelly, A. (1994). Concise encyclopedia of composite materials . Pergamon. United Kingdom.
- Khalil, H. P. S. A. , Ismail, H. , Rozman, H. D. , & Ahmad, M. N. (2001). The effect of acetylation on interfacial shear strength between plant fibres and various matrices. European Polymer Journal , 37, 1037–1045. doi:10.1016/S0014-3057(00)00199-3
- Krishna, K. V. , & Kanny, K. (2016). The effect of treatment on kenaf fiber using green approach and their reinforced epoxy composites. Composites Part B: Engineering , 104, 111–117. doi:10.1016/j.compositesb.2016.08.010
- Krishnaprasad, R. , Veena, N. R. , Maria, H. J. , Rajan, R. , Skrifvars, M. , & Joseph, K. (2009). Mechanical and thermal properties of bamboo microfibril reinforced polyhydroxybutyrate biocomposites. Journal Polymer Environment , 17, 109–114. doi:10.1007/s10924-009-0127-x
- Ku, H. , Wang, H. , Pattarachaiyakoop, N. , & Trada, M. (2011). A review on the tensile properties of natural fiber reinforced polymer composites. Composites Part B: Engineering , 42(4), 856–873. doi:10.1016/j.compositesb.2011.01.010
- Li, X. , Tabil, Æ. L. G. , & Panigrahi, Æ. S. (2007). Chemical treatments of natural fiber for use in natural fiber-reinforced composites: A review, Journal of Polymers and the Environment (pp. 25–33).doi: 10.1007/s10924-006-0042-3
- Madsen, B. , & Lilholt, H. (2003). Physical and mechanical properties of unidirectional plant fibre composites-an evaluation of the influence of porosity. Composites Science and Technology , 63(9), 1265–1272. doi:10.1016/S0266-3538(03)00097-6
- Mahjoub, R. , Mohamad Yatim, J. , & Mohd, A. R. (2014). Sam, and S. Hamid Hashemi, “Tensile properties of kenaf fiber due to various conditions of chemical fiber surface modifications,”. Construction and Building Materials , 55, 103–113. doi:10.1016/j.conbuildmat.2014.01.036
- Nam, T. H. , Ogihara, S. , Tung, N. H. , & Kobayashi, S. (2011). Effect of alkali treatment on interfacial and mechanical properties of coir fiber reinforced poly(butylene succinate) biodegradable composites. Composites Part B: Engineering , 42(6), 1648–1656. doi:10.1016/j.compositesb.2011.04.001
- Niaz Akhtar, M. , Bakar Sulong, A. , Fadzly Radzi, M. K. , Ismail, N. F. , Raza, M. R. , & Muhamad, N ., & Azhar, M. (2016). Influence of alkaline treatment and fiber loading on the physical and mechanical properties of kenaf / polypropylene composites for variety of applications. Progress in Natural Science: Materials International, 26, 657–664. doi:10.1016/j.pnsc.2016.12.004
- Nirmal, U. , Hashim, J. , & Low, K. O. (2012). Adhesive wear and frictional performance of bamboo fibres reinforced epoxy composite. Tribology International , 47, 122–133. doi:10.1016/j.triboint.2011.10.012
- Nirmal, U. , Lau, S. T. W. , Hashim, J. , Devadas, A. , & Yuhazri, M. (2015). Effect of kenaf particulate fillers in polymeric composite for tribological applications. Textile Research Journal , 85(15), 1602–1619. doi:10.1177/0040517514563744
- Pihtili, H. (2009). An experimental investigation of wear of glass fibre-epoxy resin and glass fibre-polyester resin composite materials. European Polymer Journal , 45, 149–154. doi:10.1016/j.eurpolymj.2008.10.006
- Prabhu, R. , & Amin, A. K. (2015). Dhyanchandra, “Development and charaterization of low cost polymer composites from coconut coir,”. American Journal Materials Sciences , 5, 62–68.
- Prasad, A. V. R. , & Rao, K. M . (2011). Mechanical properties of natural fibre reinforced polyester composites: Jowar, sisal and bamboo. Materials and Design, 32, 4658–4663. doi:10.1016/j.matdes.2011.03.015
- Prasad, A. V. R. , & Rao, K. M. (2011). Mechanical properties of natural fibre reinforced polyester composites: Jowar, sisal and bamboo. Materials & Design , 32, 4658–4663. doi:10.1016/j.matdes.2011.03.015
- Raju, G. , Ratnam, C. T. , Ibrahim, N. A. , Rahman, M. Z. A. , & Yunus, W. (2008). Enhancement of PVC/ENR blend properties by poly(methyl acrylate) grafted oil palm empty fruit bunch fiber. Journal Applications Polymerica Sciences , 110, 368–375. doi:10.1002/app.v110:1
- Ramesh, M., Palanikumar, K., & Reddy, K. H. (2013). Comparative evaluation on properties of hybrid glass fiber-sisal/jute reinforced epoxy composites. Procedia Engineering , 51, 745–750. doi: 10.1016/j.proeng.2013.01.106
- Saba, N. , Paridah, M. T. , Abdan, K. , & Ibrahim, N. A. (2016a). Effect of oil palm nano filler on mechanical and morphological properties of kenaf reinforced epoxy composites. Construction and Building Materials , 123, 15–26. doi:10.1016/j.conbuildmat.2016.06.131
- Saba, N. , Paridah, M. T. , Abdan, K. , & Ibrahim, N. A. (2016b). Physical, structural and thermomechanical properties of oil palm nano filler/kenaf/epoxy hybrid nanocomposites. Materials Chemistry and Physics , 184, 64–71. doi:10.1016/j.matchemphys.2016.09.026
- Saba, N. A. I. , Paridah, M. T. , & Abdan, K. (2016). Dynamic mechanical properties of oil palm nano filler/kenaf/epoxy hybrid nanocomposites. Construction and Building Materials , 124, 133–138. doi:10.1016/j.conbuildmat.2016.07.059
- Saheb, D. N. , & Jog, J. P. (1999). Natural fiber polymer composites: A review. Advancement Polymerical Technological , 18(4), 351–363. doi:10.1002/(SICI)1098-2329(199924)18:4<>1.0.CO;2-Q
- Shalwan, A. , & Yousif, B. F. (2014). Influence of date palm fibre and graphite filler on mechanical and wear characteristics of epoxy composites. Materials & Design , 59, 264–273. doi:10.1016/j.matdes.2014.02.066
- Singha, A. S. , & Thakur, V. K. (2010). Synthesis, characterization and study of pine needles reinforced polymer matrix based composites. Journal of Reinforced Plastics and Composites , 29(5), 700–709. doi:10.1177/0731684408100354
- Thakur, V. K. , & Thakur, M. K. (2014). Processing and characterization of natural cellulose fibers/thermoset polymer composites. Carbohydrate Polymers , 109, 102–117. doi:10.1016/j.carbpol.2014.03.039
- Van Vuure, A. W. , Baets, J. , & Wouters, K ., & Hendrickx, K. (2015). Compressive properties of natural fibre composites. Materials Letters, 149, 138–140. doi:10.1016/j.matlet.2015.01.158
- Venkateshwaran, N. , Perumal, A. E. , & Arunsundaranayagam, D. (2013). Fiber surface treatment and its effect on mechanical and visco-elastic behaviour of banana/epoxy composite. Materials & Design , 47, 151–159. doi:10.1016/j.matdes.2012.12.001
- Wong, C. C. , Mat Daham, M. D. , Abdul Aziz, A. M. , & Abdullah, O. (2008). Kenaf germplasm introductions and assessment of their adaptability in Malaysia. Journal Tropical Agricultural Food Sciences , 36(203), 1–19.
- Yousif, B. F. , & El-Tayeb, N. S. M. (2007). The Effect of oil palm fibres as reinforcement on tribological performance of polyester composite. Surface Reviews Letters , 14(6), 1095–1102. doi:10.1142/S0218625X07010561
- Yousif, B. F. , & El-Tayeb, N. S. M. (2013). High-stress three body abrasive wear of treated and untreated oil palm fibre-reinforced polyester composite. Journal Engineering Tribol Ogy , 227, 385–392.
- Yousif, B. F. , Lau, S. T. W. , & Mcwilliam, S. (2010). Polyester composite based on betelnut fibre for tribological applications. Tribology Lubrication Technological , 43, 503–511.
- Yusoff, R. B. , Takagi, H. , & Nakagaito, A. N. (2016). Tensile and flexural properties of polylactic acid-based hybrid green composites reinforced by kenaf, bamboo and coir fibers. Industrial Crops and Products , 94, 562–573. doi:10.1016/j.indcrop.2016.09.017