
 ?Mathematical formulae have been encoded as MathML and are displayed in this HTML version using MathJax in order to improve their display. Uncheck the box to turn MathJax off. This feature requires Javascript. Click on a formula to zoom.
Abstract
Lycopene is one of the most important functional components produced in tomatoes. Traditional methods for determining lycopene content usually rely on destructive sampling followed by chemical analysis. This report introduces the use of a smart device camera combined with a new Android application as a novel, rapid, and nondestructive method for determining tomato lycopene content and fruit grade. We first measured chromaticity values and lycopene content in 60 tomato fruits to develop an effective predictive model for lycopene estimation. Second, a method based on color differences between test fruit and several standard colors was designed as a color classification algorithm for fruit grading. Third, an Android application for lycopene estimation and fruit grading was developed. Finally, application functionality was evaluated using an Android 4.2.2 tablet. The results demonstrated that this new approach was functional and its ability to estimate lycopene content and fruit grade was satisfactory.
PUBLIC INTEREST STATEMENT
In this report, we present on a novel, rapid, and nondestructive, smart device camera-based application tool for lycopene content estimation and fruit grading of tomatoes. This is significant because traditional methods for determining lycopene content in tomatoes usually rely on destructive sampling followed by chemical analysis, which is not only costly but also time-consuming. The color grading of tomatoes is traditionally judged by empirical sense of grading by a worker’s eyes. However, it is sometimes difficult to visually distinguish the color of an individual tomato from similarly colored ones. Hence, there is a demand for a new, easy-to-use tool that can rapidly and nondestructively determine lycopene content as well as classify color grades of tomatoes. Nowadays, availability of mobile smart devices is rapidly spreading throughout the world. Therefore, we developed a new method that utilizes the built-in camera on smart devices for lycopene content estimation and fruit grading of tomatoes.
1. Introduction
Tomatoes are one of the most popular and important vegetables for human consumption worldwide. Not only can they be consumed either fresh or cooked but they also provide nutrients such as potassium, carotenes, vitamins, and lycopene to consumer diets (Canene-Adams, Campbell, Zaripheh, Jeffery, & Erdman, Citation2005). Of the various functional compounds in tomatoes, lycopene is one of the most important because it can reduce the risk of cardiovascular disease (Chandrasekaran, Citation2012; Petr & Erdman, Citation2005; Rissanen, Voutilainen, Nyyssonen, & Salonon, Citation2002; Sesso, Liu, Gaziano, & Buring, Citation2003) and several forms of cancer (Chen et al., Citation2001; Giovannuccci, Citation1999; Kim & Kim, Citation2015; Kucuk et al., Citation2001). Lycopene has also been reported to be effective against aging skin because it can combat age-causing free radicals and assist in metabolic functions related to cellular growth and repair (Evans & Johnson, Citation2010; Rao & Rao, Citation2007). Therefore, lycopene has received much attention worldwide for its multiple health and cosmetic benefits. Lycopene content in tomato fruits can be variable, making it difficult to properly sort and grade tomatoes according to their nutritional quality and hence, there is a demand for a method that can accurately determine lycopene content in individual tomato fruits (Clément, Bacon, Sirois, & Dorais, Citation2015; Ghatak et al., Citation2017).
Traditional methods for determining lycopene content in tomatoes include high-performance liquid chromatography (HPLC), which is usually followed by a complicated chemical analysis that involves a mixture of solvents for pigment solubilization to avoid pigment oxidation during extraction (Anthon & Barrett, Citation2007). This procedure is not only laborious, costly, and time-consuming but also requires skilled labor and the use of highly toxic solvents. Recently, some rapid methods for lycopene analysis have been proposed in tomatoes. Using different spectroscopic instruments such as a xenon flash colorimeter/spectrophotometer (Davis, Fish, & Perkins-Veazie, Citation2003a, Citation2003b), near-infrared (NIR) spectrometer (Pedro & Ferreira, Citation2005), or visible-NIR spectrometers (Clément, Dorais, & Vernon, Citation2008; Szuvandzsiev et al., Citation2014), the lycopene content from pureed tomato samples were successfully measured with reasonable accuracy compared to that of HPLC. However, these studies require fruit destruction to produce the fruit puree used for analysis. Although the efficiency is considerably better than that of the chemical analytical method, these spectroscopic methods are still laborious and depend on a destructive approach.
Over the past several decades, colorimetric estimation of fruit lycopene has been proposed as an alternative rapid measurement method that uses chromaticity values obtained by various colorimeters; the colorimeters used could read color differences in the CIE-Lab color space (Arias, Lee, Logendra, & Janes, Citation2000; D’Souza, Singh, & Ingle, Citation1992; Hyman, Gausa, & Foolad, Citation2004). In addition to the CIE-Lab chromaticity values L*, a*, and b*, these studies also generated several transformed values (indices) from ratios calculated from these basic chromaticity values. D’Souza et al. (Citation1992) showed that the lycopene concentration in tomatoes can be estimated using the transformed chromaticity value (a*/b*)2 (R 2 = 0.75). Arias et al. (Citation2000) showed that the transformed a*/b* readings from tomatoes yielded a highly linear regression (R 2 = 0.96) when compared with lycopene quantity. Furthermore, Hyman et al. (Citation2004) investigated the possibility of determining lycopene content in tomatoes using chromaticity values obtained from both whole fruit and fruit purees and successfully developed a nonlinear model using a*/b* (R 2 = 0.74) as a single predictor of lycopene content in the whole fruit. Although the accuracy was lower than that of the model developed with a* for the pureed samples (R 2 = 0.95), it demonstrated that it was possible to determine lycopene content in tomatoes from chromaticity values obtained on the fruit surface. These results suggest that colorimeters have potential as nondestructive tools for determining lycopene content in tomatoes via measurement from intact fruits rather than fruit purees.
Color and appearance are the primary attributes used to sort or grade tomato fruits. Tomatoes are known for their vibrant red color, which indicates not only maturity and the level of desired flavor but also the relative lycopene content; the red color is mainly contributed by lycopene, which typically shows a color ranging from yellow through to red. Therefore, tomatoes that are deep red in color are usually more mature fruits than those that are lighter red, pink or orange and green, with a sweet flavor and high lycopene content (Barrett & Anthon, Citation2008). In practice, tomatoes are usually graded according to fruit size, defects, and color. The color grading of tomatoes is traditionally empirically judged by an assessor. However, it is sometimes difficult to visually distinguish the color of an individual tomato from similarly colored ones. Recently, various computer vision systems have been developed to perform nondestructive quality parameter measurements in fruits (Srivastava, Citation2013). These systems grade the fruits, increase the speed of grading, and eliminate human error; however, they are usually installed on the packaging lines, and are not suitable for in situ application.
The aim of this study was to develop a rapid and nondestructive approach for determining tomato lycopene content as well as grading the fruits. The current availability of mobile smart devices has rapidly increased. We wanted to develop a new method that utilizes the built-in camera on smart devices to capture images for this purpose. Such a method requires an application that can easily access the smart device camera and quickly read and compute image data to estimate lycopene content and fruit grade. To develop this new method for tomato fruit assessment, we first obtained a chromaticity value-based model to estimate lycopene content in tomato fruits. Fruit grading was performed using a classification algorithm developed to calculate the color differences (ΔE) between fruits and standard colors. By incorporating the predictive model and classification algorithm, we developed an Android application using the free software “Processing” (Reas & Fry, Citation2007) in the Windows 10 environment. Finally, the performance of the application on an Android 4.2.2 tablet was evaluated. The results demonstrated that the application worked as designed and performance with respect to its lycopene content estimation and fruit classification were satisfactory. These results suggest that the smart device camera combined with our Android application can be used as a rapid and nondestructive tool to estimate the lycopene content and grade of tomato fruits.
2. Materials and methods
2.1. Plant material and sample preparation
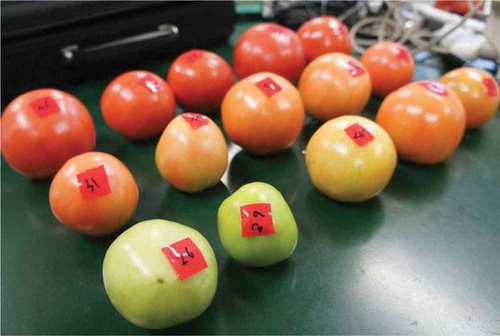
The tomato cultivar used in this study was “Momotaro”, which is one of the most popular tomato cultivars in Japanese markets. The tomatoes were cultivated on the campus farm at Hirosaki University, Japan. The fruits were harvested at different degrees of ripeness based on fruit size and fruit color (unripe: undeveloped green fruits; half-ripe: normal sized and slightly yellow fruits; fully ripe: normal sized and red fruits). This method yielded a batch of fruit samples with different levels of lycopene content (Figure ). The fruits were carefully handled during harvest and transport. Samples were screened for differently colored fruit surfaces in a total of 60 selected fruits.
Figure 1. Tomato fruits harvested at different stages of ripeness.
2.2. Colorimetric measurements
The prepared fruit samples were used to measure chromaticity values L*, a*, and b*, using a simple type spectral color difference meter (NF333, Nippon Denshoku Industries Co., Ltd., Tokyo, Japan). The L* value is a measurement of the lightness or amount of light reflected. The a* value indicated the intensity of the red (+ values) or green (− values) coloration, and the b* value indicated the intensity of the yellow (+ values) or blue (− values) coloration (Backhaus, Kliegl, & Werner, Citation1998). Colorimetric measurements were taken from the surface of the fruits. For each fruit, measurements were taken from three points on the fruit surface with similar colors, which were then averaged to obtain reliable estimates of chromaticity values from the fruits.
2.3. Lycopene quantification
Lycopene content in tomatoes was spectrophotometrically quantified with a Biophotometer (BPM-10 Bio, Taitec Corporation, Saitama, Japan). An external lycopene standard (Wako Pure Chemical Industries, Ltd., Osaka, Japan) was used as the reference for experimental samples. A calibration curve was obtained by preparing working standard solutions from lycopene concentrations of 0, 2, 5, 10, and 15 ppm for spectral absorption analysis. For each fruit, the pulp from under the surface areas used for colorimetric measurements was cut separately, and 1 g of fruit tissue was weighed. The sample was crushed in a mortar and pestle and subsequently extracted using ethyl acetate as a solvent. The solvents were filtered through Advantec No. 2 filter paper (5 μm pore size, 90 mm diameter, Toyo Roshi Kaisha, Ltd., Tokyo, Japan) and transferred into a separating funnel. After the extractions, the lycopene content of the samples was measured using a Biophotometer at 470 nm (Hyman, Gausa, & Foolad., Citation2004).
2.4. Lycopene estimation model development
The spectrophotometrically determined lycopene content results were compared graphically and statistically against the fruit chromaticity values L*, a*, and b*, as well as with several functions of these values. The chromaticity values from all samples were plotted against their lycopene content and assessed visually for any relationship. The lycopene contents were then regressed against the chromaticity values and the functions of these values, and the regression model with the best predictive accuracy, which was measured as the coefficient of determination (R 2 value), was identified. The model was then incorporated into the program codes of an application to estimate lycopene content in tomatoes.
2.5. Color classes
Mature tomatoes pass through several stages of ripeness that are characterized by changes in color and firmness. Green and yellow tomatoes are normally hard, while pink and red tomatoes may be hard or firm (Bartz & Brecht, Citation2002). Fresh tomatoes are usually graded according to the standard colors before being packed and shipped to the market. Many standards for color classes for fresh tomatoes have been used to grade tomato fruits (USDA, Citation2017). Usually, the tomato fruit is graded into a color class according to how close its color is to one of the standard colors. Therefore, in addition to the accurate estimation of lycopene content in tomatoes, we also attempted to incorporate a program into the application to grade the tomatoes using standard colors.
To quantify the color differences (△E) between the fruit and each of the standard colors, the CIE76 formula that relates a measured value to a known set of CIE-Lab coordinates was used to calculate color differences (Robertson, Citation1997). This calculation assumes two colors in L*a*b*space: color 1 (L* 1, a* 1, b* 1) and color 2 (L* 2, a* 2, b* 2) and calculates the color difference (ΔE) between these two colors using the following equation:
The color differences between the fruit and each of the standard colors were first calculated and the fruit was then graded into the color class that had the least color difference with the fruit.
2.6. Application development
We selected an Android-powered system for which to develop an application for mobile devices. Android is a Linux-based operating system mainly designed for mobile devices such as smartphones and tablets. It has been widely used owing to its portability and its cross-platform, open mobile terminal. Android applications are written in Java, and the Android Software Development Kit (SDK) provides the Application Programming Interface (API) libraries and developer tools necessary to build, test, and debug applications (Sheusi, Citation2013).
Java is the main language on Android systems. We therefore installed the Java Development Kit (JDK) as a development environment for building applications, applets, and components using the Java programming language. The JDK includes tools that are useful for developing and testing programs written in the Java programming language and running on the Java platform (Richardson, Avondolio, Schrager, Mitchell, & Scanlon, Citation2007). Furthermore, as the main target of this study was images of tomato fruits, we used the “Processing” software for programing. “Processing” is a simple programming environment that was created to easily develop visually oriented applications with an emphasis on animation and providing users with instant feedback through interaction. It uses a language syntax identical to that of Java but with a few modifications. Using the libraries, the programing will become much easier and the codes can be shortened compared to the Java language (Reas & Fry, Citation2007).
The freely available application development software products were installed on a desktop computer (HP Z210 SFF Workstation, Hewlett-Packard Japan, Ltd., Tokyo, Japan). Android application development involved establishing the development environment, writing the program codes, compiling the codes, and installing the finished application on Android mobile devices. The application was tested using an Android 4.2.2 tablet (Google Nexus 7, ASUSTeK Computer Inc., Tokyo, Japan).
3. Results
3.1. Chromaticity values and lycopene content
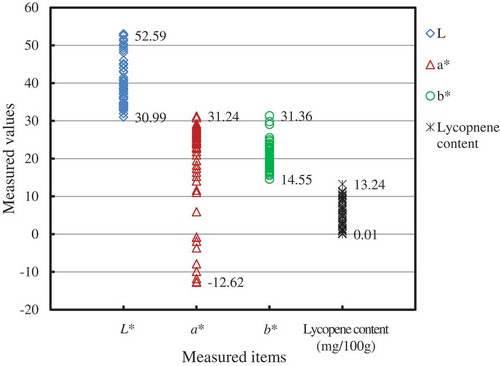
Figure summarizes the measured chromaticity values and lycopene content for the tomato samples. Due to the different stages of ripeness, significant differences in the chromaticity values and the lycopene content were observed among the samples. The chromaticity value L* was between 52.59 and 32.99, with the average of 39.72 and the standard deviation of 6.37. The chromaticity value a* was between 31.24 (maximum) and −12.62 (minimum), and the largest standard deviation of 12.19, which was equivalent to 63.5% of the mean value (19.21) among the three chromaticity values measured. This result is due to the significant differences in the red or green color information in the samples, because a* indicates the intensity of the red (+ values) or green (− values) coloration. The chromaticity value b* ranged between 31.36 and 14.55, with an average of 20.46 and standard deviation of 3.37. All the samples had a positive b* value, indicating that there was little or no blue color on the fruit. The lycopene content varied between 13.36 and 0.01 mg/100 g and had a large standard deviation of 3.58 mg/100 g, which constituted 61.9% of the mean value (5.77 mg/100 g) for the data. This finding suggested that the chromaticity values could provide useful information about the lycopene content in tomatoes.
Figure 2. Distribution of the measured chromaticity values and lycopene content in tomato samples.
3.2. Lycopene estimation models
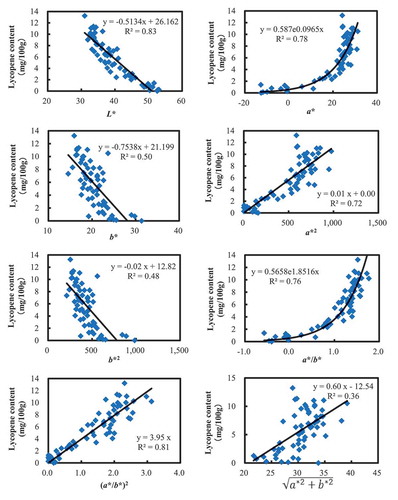
The chromaticity values from all samples were plotted against lycopene content and assessed visually for any relationships. Visual inspection of scatter plots of the data indicated that the chromaticity values L* and b* had a negative linear correlation with lycopene content, while the chromaticity value a* had an exponentially positive relationship with lycopene content. Further, the relationships between the transformed chromaticity values a
*2, b
*2, a*/b*, (a*/b*)2, and ) and lycopene content were investigated. The results indicated that the exponential transformation of a*/b* into (a*/b*)2 yielded a better fit linear model with an increase in the coefficient of determination (R
2) from 0.76 to 0.81 (Figure ). The same exponential transformation of a* into a
*2 also produced a linear relationship; however, the coefficient of determination (R
2) decreased from 0.78 to 0.72, which indicated a reduction in the accuracy of lycopene estimation. Of the transformed chromaticity values, the transformation
showed the lowest correlation (R
2 = 0.36). Additionally, the chromaticity value L* also had a highly negative linear correlation with lycopene content (R
2 = 0.83), but this value only measured the lightness or the amount of light reflected from the fruit and did not directly relate to the color of fruit. Hence, the regression model that used (a*/b*)2 was determined as the best model for lycopene estimation.
Figure 3. The relationships between lycopene content and either the chromaticity values or the transformed chromaticity values.
3.3. Application development
3.3.1. System installation and configuration
To develop the Android application, the development environment was first established on a desktop PC with the following sequential steps: (1) we downloaded and installed the JDK package onto the desktop computer (http://www.oracle.com/technetwork/java/javase/downloads/jdk8-downloads-2133151.html) and configured the java environment variables; (2) we downloaded and installed the Android SDK (http://developer.android.com/sdk/index.html#Other). In this step, the following tools were installed: Android SDK Tool, Android SDK Platform tools, Android SDK Build-tools, Android 5.0.1 (API 21), and Google USB Driver; (3) we downloaded and installed Processing 3.0 (https://processing.org/) onto the PC. The Ketai library, which is an extensive library that provides straightforward access to sensors, cameras, and networking hardware on Android devices, was installed from within the Processing integrated development environment.
3.3.2. Color transformation formulas
In this study, the application was expected to run on a mobile Android device and the built-in digital cameras captured color information from the tomato surface. Usually, digital cameras capture images with RGB color filters and display the colors of the objects using the sRGB (standard RGB) color space and therefore, the captured color data do not contain the chromaticity values L*, a*, and b*. To estimate the lycopene content in tomatoes using the model we developed, we therefore needed to convert sRGB colors into CIE-Lab colors.
Many mathematical formulas have been developed to convert values between various color spaces (IRO Group Limited, Citation2018). sRGB colors cannot be converted into CIE-Lab colors directly, so we first converted the RGB colors into CIE-XYZ colors and then converted the CIE-XYZ colors into CIE-Lab colors. When we converted the RGB colors into CIE-XYZ colors, the measured CIE tristimulus values for the three channels of the equipment had to be included in the calculation. However, in many applications, it is not possible to measure the tristimulus values for the equipment because this would require expensive equipment, such as a spectroradiometer or a colorimeter. In the measurements, these meters usually give CIE values either by cascading a measured spectral power distribution with the CIE color matching functions (spectroradiometer) or by using special filters to mimic human vision (colorimeter). Practically, an alternatively effective method is to use published manufacturer data for the display device. Here, our calculations assumed a 2° standard colorimetric observer, and the CIE Standard Illuminant D65 was used (Schanda, Citation2007). The mathematical formulas used for color conversions were as follows:
The nonlinear sRGB values obtained from images taken with mobile devices were converted to linear RGB values using the equation (IEC, Citation1999):
where a = 0.055, C srgb stands for R srgb, G srgb, and B srgb; and C linear indicates R linear, G linear, and B linear.
(2) The linear RGB values were converted to tristimulus values X, Y, and Z using the equation (Pascale, Citation2003):
(3) X, Y, and Z values were converted into L*, a*, and b* values using the equations (Konica Minolta, Citation1998):
where Xn, Yn, and Zn are the CIE XYZ tristimulus values for the reference white point. Using Illuminant D65, the values were Xn = 95.047, Yn = 100.000, Zn = 108.883.
3.3.3. Color detection
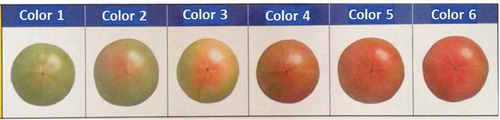
Mature tomatoes pass through several stages of ripeness that are characterized by changes in color and firmness. Standards for color classification are usually defined and used in connection with the grade classification. In Japan, many standards for color grades for fresh tomatoes have been formulated by national, prefectural, and/or local authorities. Figure shows the standard colors for fresh tomatoes of the “Momotaro” cultivar adopted by the Aomori Branch of the Japan National Federation of Agricultural Cooperative Associations (JA ZEN-NOH Aomori).
Figure 4. Color classification standards for fresh “Momotaro” tomatoes adopted by JA ZEN-NOH Aomori.
Using the above standard colors, we developed a program to grade fresh “Momotaro” tomatoes. This function was realized by incorporating the following procedures into the application (Figure ): First, the image of the standard color card was captured by the camera and after registering the standard color classes, the chromaticity values for each color class were calculated. Second, the image of the fruit sample was captured and its chromaticity values were calculated. Third, the chromaticity values were used to calculate the color differences (ΔE) between the test fruit and each of the standard colors. The color differences (ΔE) were compared and the minimal color difference identified. Finally, the tomato fruit was graded and placed into the color class that has the minimal color difference with the sample fruit.
Figure 5. A graphical scheme of the tomato color detection process by the device application.
3.3.4. Programming, compiling, and installation of the application
Under the “Processing” environment equipped with the Ketai library, simple codes for accessing the built-in camera in Android devices and implementation of the algorithms for lycopene estimation and color classification were written. The source codes were then compiled into an executable application that could run in an Android environment. The complied application could then be installed on any Android-powered device.
3.4. Testing of the application
3.4.1. Functionality of the application
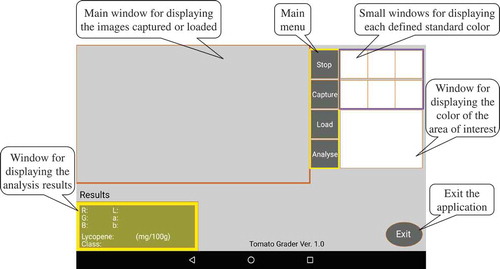
To test our application, we installed it on a Google Nexus 7 tablet powered with an Android 4.2.2 system. When the application is launched, the main interface is displayed on the screen (Figure ). The top-left main window is used to display the image that was either captured by the built-in camera or from a saved image. The menu to the left of the main image display window contains the “Stop”, “Capture”, “Load”, and “Anlayse” buttons. The “Stop” button terminates current processes; the “Capture” button enables the application to activate the mounted camera; the “Load” button loads the images that have been already saved in the device memory; and the “Analyse” button initiates lycopene estimation and fruit color grading. Once the analysis program is initiated, touching a specific area on the captured image of a tomato promptly displays the estimated lycopene content and fruit color grade for the area of interest on the bottom-left side of the screen. Moving the area of interest on the image display window provides analysis results that are continually and automatically updated. The six small windows on the top-right of the screen illustrate the standard colors from class 1 to 6 for fruit grading defined by selecting the corresponding colors on a standard color card in the main image display window. The larger window under the six small windows displays the color of the area of interest for analysis. The “Exit” button terminates the application.
Figure 6. The main interface of the application after it is launched on an Android system.
To test the application, the standard color card for fresh “Momotaro” tomatoes adopted by JA ZEN-NOH Aomori was used to test application functionality for lycopene estimation and fruit grading. First, the images of the standard color cards were captured with the camera and defined and recorded for the fruit grading of tomatoes (Figure ). Upon selecting the area of interest on the image captured by the camera, both the estimated lycopene content and fruit grade for the selected area of interest were displayed on the bottom-left of the screen. In addition, the fruit grade class numbers were also labeled on the individual fruits in the captured image.
Figure 7. Setting the standard colors for tomato grading by capturing new color standards from a color classification card or by loading an existing standard color image. The image shows an example of the standard colors of fresh “Momotaro” tomatoes adopted by JA ZEN-NOH Aomori, Japan.
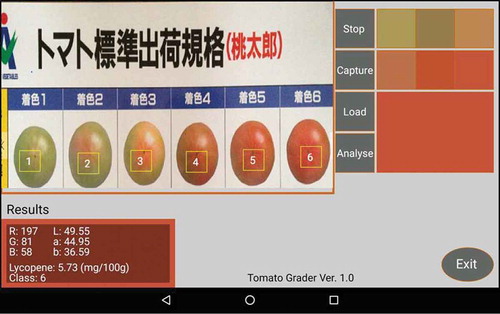
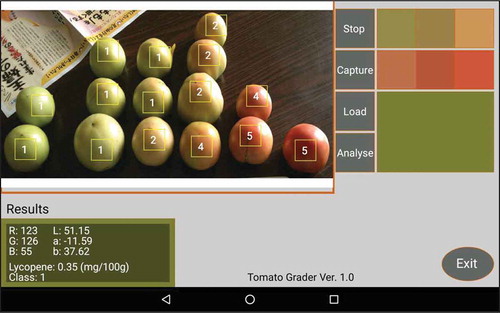
Figure illustrates the labeled fruit grades determined by the application with the standard colors for a set of “Momotaro” tomato fruits captured in one snapshot. The estimated lycopene content for the fruits were stored in the device memory, which could be easily exported for later analysis. The results indicated the successful functionality of the application for lycopene estimation and color grading for tomatoes.
Figure 8. Determination of lycopene content and color grades for tomatoes at different stages of ripeness by simply selecting the fruits shown in the captured image.
3.4.2. Performance of the application under different measurement conditions
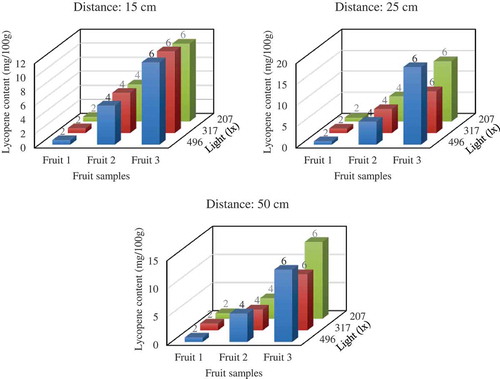
We next designed an experiment to investigate the application’s performance at different measurement distances between the smart device and tomato fruits in different light conditions. Three measurement distances (15, 25, and 50 cm) and three levels of room light (207, 317, and 496 lx) were tested using three tomato samples at different stages of ripening. Results indicated that the application could accurately categorize the test fruits into the correct classes—2, 4, and 6, respectively (Figure ). The lycopene estimations varied in the different measurement conditions (Figure ); however, no statistically significant differences (p < 0.05) were observed among both the distance and light factors (Table ). In addition, a 15-cm distance produced more stable lycopene estimation values than the other two distances at all three light levels, suggesting that the application has optimal performance at this imaging distance (Figure ).
Table 1. Results of three-way analysis of variance (ANOVA)
Figure 9. Performance of the application in lycopene content and fruit grade estimation of three tomato samples measured at three distances (15, 25, and 50 cm) and in three light conditions (207, 317, and 496 lx). The fruit grading in each condition is indicated on the lycopene content bar corresponding to the same condition.
4. Discussion
4.1. Color systems
In this study, chromaticity values were based on the CIE-Lab color space to visually estimate lycopene content in tomato fruits. Most color spaces are perceptually nonlinear, i.e., a perceived color difference will vary in magnitude throughout the color space, which makes them inefficient for coding color information, as some areas will enable expression at too high a precision while that of others will be insufficient (Ford & Roberts, Citation1998). In contrast, the CIE-Lab color space measures the chromaticity values L*, a*, and b* and is recognized as being more perceptually linear than other color spaces. In the CIE-Lab color space, a change of the same magnitude in a color value should produce a change of about the same visual importance (Leon, Mery, Pedreschi, & Leon, Citation2006). Therefore, the CIE-Lab color space can better reflect perceived differences between colors. Chromaticity values based on the CIE-Lab color space are more uniform and suitable for use to directly relate to the amount of pigments in quantitative estimation and thus, useful for the estimation of various properties related to colors. With this in mind, a CIE-Lab color space-based colorimetric system was utilized to obtain chromaticity parameters for lycopene content estimation in tomato fruits.
4.2. Estimation models
The relationships between chromaticity values of the original as well as transformed chromaticity values and lycopene content were investigated. The transformed chromaticity value a*/b* and its squared form (a*/b*)2 provided high accuracy in lycopene estimation, with coefficients of determination of 0.76 and 0.81, respectively (Figure ). Lycopene is a natural colorant that ranges from yellow to red in color and therefore, the transformed chromaticity parameters a*/b* or (a*/b*)2 are more effective for estimating lycopene content in fruits because they both include red and yellow color information. In comparison, the chromaticity values a* and b* and their exponentially transformed values a *2 and b *2 are associated with the degree of red or yellow color intensity (not both of them). This limitation of these values may result in an underestimation of lycopene content because lycopene with colors outside these single-color coordinates (a* (red to green) or b*(yellow to blue)) will be excluded by the parameter. In addition, the chromaticity value L* also had a high linear correlation with lycopene content (R 2 = 0.83) (Figure ); however, it only measured the lightness or the amount of light reflected from surface, which may not directly relate to fruit color. Therefore, it was appropriate to select the transformed chromaticity parameter (a*/b*)2 as a visual predictor for lycopene content in tomato fruits.
4.3. Camera and illumination
Light conditions in the surrounding environment can significantly influence the RGB values captured by a camera. In addition, optical specifications of the camera on mobile devices differ from one another, which might also affect RGB values captured of the same fruit under the same environmental conditions by different devices (Nguyen, Prasad, & Brown, Citation2014). Although the transformation of the color space from RGB to CIE-Lab systems helps mitigate these issues, slight differences in estimated lycopene content are inevitable when fruits are measured by different devices and/or under different environmental conditions. Nevertheless, when there is no demand for an accurate quantitative estimation of lycopene content, the application combined with the use of a standard color cards is effective and helpful in fruit grading and classification because the standard color card images and fruits are captured by the same camera with the same optical settings, providing internal color calibration for the device.
To obtain an accurate quantitative estimation of lycopene content, one possible method is to develop a new standard color card that defines lycopene content for each standard color. With this information available, a simple calibration model could be developed to estimate lycopene content for test fruits based on color values obtained by smartphone cameras. Similar to fruit grading and classification, the use of such a standard color card as a reference for lycopene estimation could also avoid the challenge of varying RGB values obtained by different smartphone cameras. Another method is to equip smartphones with a dedicated camera with a self-contained illumination system. The dedicated camera would provide a constant illumination condition as a solution not only for reducing effects from the changing environment but also for eliminating problems caused by different optical specifications. Development of such a small type of camera that could be easily connected to various mobile devices will be one of the aspects of our future research.
5. Conclusion
This study used a smart device camera for lycopene content estimation and fruit grading in tomatoes. The application developed for this new measurement approach has potential as a fast and nondestructive tool for determining the quality of tomato fruits. We first developed several lycopene estimation models based on chromaticity values and lycopene content obtained for individual tomato samples. An optimal lycopene estimation model based on the transformed chromaticity value (a*/b*)2 was then selected. Using the free “Processing” software, an Android application was developed for estimating lycopene content in tomato fruits. The application converts the RGB color features captured by the smart device camera into chromaticity values in the CIE-Lab space and calculates the transformed chromaticity (a*/b*)2 value. The result is then used in the model to calculate the lycopene estimate for the sampled tomato fruit. In addition, a program was incorporated into the application to grade the fruits by calculating the color difference between test fruit and standard colors. Therefore, the application can provide the functionality for both rapid determination of lycopene content and fruit grading based on colors of tomato fruits.
Using an Android 4.2.2 tablet and a standard color card for fresh “Momotaro” tomatoes adopted by JA ZEN-NOH Aomori, we evaluated the functionality of this new approach and found that it could estimate lycopene content and fruit grades quickly and accurately at different distances and in different light conditions; however, we found that imaging at a distance of 15 cm provided the most consistent lycopene estimation regardless of light level. This study presents the practical determination of lycopene content and grading in tomato fruits using a simple and portable Android smart device.
Declaration
The authors declare that the manuscript has not been published elsewhere and that it has not been submitted simultaneously or publication elsewhere.
Supplemental Material
Download ()Supplementary material
Supplemental data for this article can be accessed at here
Additional information
Funding
Notes on contributors
Xujun Ye
Xujun Ye is an associate professor at the Faculty of Agriculture and Life Science, Hirosaki University, Japan. His main research interests include development of nondestructive sensing techniques and smart devices for crop growth monitoring and postharvest quality evaluation of agricultural products, and applications of multi-platform, multi-sensor remote sensing technologies in agriculture.
Tomoki Izawa
Tomoki Izawa is a former student of the Faculty of Agriculture and Life Science, Hirosaki University, Japan, with research interests in development of software applications for smart devices.
Shuhuai Zhang
Shuhuai Zhang is a professor at the Faculty of Agriculture and Life Science, Hirosaki University, Japan. His main research interests include applications of image processing technology in agriculture, robotics, remote sensing, fruit grading, etc., and nondestructive measurements of agricultural product’s quality including density, firmness, sweetness, and optical reflectance and transmission properties, etc.
Related Research Data
References
- Anthon, G. , & Barrett, D. M. (2007). Standardization of a rapid spectrophotometric method for lycopene analysis. Acta Horticulturae , 758, 111–128. doi:10.17660/ActaHortic.2007.758.12
- Arias, R. , Lee, T. C. , Logendra, L. , & Janes, H. (2000). Correlation of lycopene measured by HPLC with the L*, a*, b* color readings of a hydroponic tomato and the relationship of maturity with color and lycopene content. Journal of Agricultural and Food Chemistry , 48, 1697–1702. doi:10.1021/jf990974e
- Backhaus, W. G. K. , Kliegl, R. , & Werner, J. S. (1998). Color vision: Perspectives from different disciplines . New York, NY: Walter de Gruyter, Berlin.
- Barrett, D. M. , & Anthon, G. E. (2008). Color quality of tomato products. In C. A. Culver & R. E. Wrolstadt Eds., Color quality of fresh and processed foods (pp. 131–139). ACS Symposium Series 983. Cary, NC: Oxford University Press.
- Bartz, J. A. , & Brecht, J. K. (2002). Postharvest physiology and pathology of vegetables . New York: CRC Press.
- Canene-Adams, K. , Campbell, J. K. , Zaripheh, S. , Jeffery, E. H. , & Erdman, J. W., Jr. (2005). The tomato as a functional food. The Journal of Nutrition , 135, 1126–1130. doi:10.1093/jn/135.5.1226
- Chandrasekaran, M. (2012). Valorization of food processing by-products . Boca Raton, FL: CRC Press.
- Chen, L. , Stacewicz-Sapuntzakis, M. , Duncan, C. , Sharifi, R. , Ghosh, L. , van Breemen, R. , … Bowen, P. E. (2001). Oxidative DNA damage in prostate cancer patients consuming tomato sauce-based entrees as a wholefood intervention. Journal of the National Cancer Institute , 93, 1872–1879. doi:10.1093/jnci/93.24.1872
- Clément, A. , Bacon, R. , Sirois, S. , & Dorais, M. (2015). Mature-ripe tomato spectral classification according to lycopene content and fruit type by visible, NIR reflectance and intrinsic fluorescence. Quality Assurance and Safety of Crops & Foods , 7(5), 747–756. doi:10.3920/QAS2014.0521
- Clément, A. , Dorais, M. , & Vernon, M. (2008). Nondestructive measurement of fresh tomato lycopene content and other physicochemical characteristics using visible-NIR spectroscopy. Journal Agricultural Food Chemical , 56(21), 9813–9818. doi:10.1021/jf801299r
- D’Souza, M. , Singh, S. , & Ingle, M. (1992). Lycopene concentration of tomato fruit can be estimated from chromaticity values. Hortscience , 27(5), 465–466.
- Davis, A. R. , Fish, W. W. , & Perkins-Veazie, P. (2003a). A rapid spectrophotometric method for analyzing lycopene content in tomato and tomato products. Postharvest Biology and Technology , 28, 425–430. doi:10.1016/S0925-5214(02)00203-X
- Davis, A. R. , Fish, W. W. , & Perkins-Veazie, P. (2003b). A rapid hexane-free method for analyzing lycopene content in watermelon. Journal of Food Science , 68(1), 328–332. doi:10.1111/j.1365-2621.2003.tb14160.x
- Evans, J. A. , & Johnson, E. J. (2010). The role of phytonutrients in skin health. Nutrients , 2(8), 903–928. doi:10.3390/nu2080903
- Ford, A. , & Roberts, A. (1998). Colour space conversions. Retrieved July 10, 2018, from http://www.poynton.com/PDFs/coloureq.pdf.
- Ghatak, B. , Ali, S. B. , Debabhuti, N. , Sharma, P. , Ghosh, A. , Tudu, B. , … Bhattacharya, N. (2017). Discrimination of tomatoes based on lycopene using cyclic voltammetry. Sensor Letters , 15(10), 827–836. doi:10.1166/sl.2017.3884
- Giovannuccci, E. (1999). Tomatoes, tomato-based products, lycopene, and cancer: Review of the epidemiologic literature. Journal National Cancer Institute , 91, 317–331.
- Hyman, J. R. , Gausa, J. , & Foolad, M. R. (2004). A rapid and accurate method for estimating tomato lycopene content by measuring chromaticity values of fruit puree. Journal Amer Social Hort Sciences , 129(5), 717–723.
- IEC (International Electrotechnical Commission) . (1999). Multimedia systems and equipment - Colour measurement and management - Part 2-1: Colour management - Default RGB colour space – SRGB . IEC 61966-2-1:1999, Geneva, Switzerland.
- IRO Group Limited . (2018). EasyRGB, color conversion math and formulas. Retrieved June 10, 2018, from www.easyrgb.com/en/math.php.
- Kim, M. J. , & Kim, H. (2015). Anticancer effect of lycopene in gastric carcinogenesis. Journal Cancer Prevention , 20(2), 92–96. doi:10.15430/JCP.2015.20.2.92
- Kucuk, O. , Sarkar, F. H. , Sakr, W. , Djuric, Z. , Pollak, M. N. , Khachik, F. , … Wood, D. P., Jr. (2001). Phase II randomized clinical trial of lycopene supplementation before radical prostatectomy. Cancer Epidemiology, Biomarkers & Prevention : a Publication of the American Association for Cancer Research, Cosponsored by the American Society of Preventive Oncology , 10, 861–868.
- Leon, K. , Mery, D. , Pedreschi, F. , & Leon, J. (2006). Color measurement in L*a*b* units from RGB digital images. Food Research International , 39, 1084–1091. doi:10.1016/j.foodres.2006.03.006
- Minolta, K. (1998). Precision color communication: Color control from perception to instruction . Osaka: Konika Minolta Sensing, Inc.
- Nguyen, R. , Prasad, D. K. , & Brown, M. S. (2014). Raw-to-raw: Mapping between image sensor color responses. 2014 IEEE Conference on Computer Vision and Pattern Recognition. INSPEC Accession Number: 14632142.
- Pascale, D. (2003). A review of RBG color space…from xyY to R’G’B’ . Montreal: The Babel Color Company.
- Pedro, A. M. , & Ferreira, M. M. (2005). Nondestructive determination of solids and carotenoids in tomato products by near-infrared spectroscopy and multivariate calibration. Analytical Chemistry , 77, 2505–2511. doi:10.1021/ac048651r
- Petr, L. , & Erdman, J. W. (2005). Lycopene and risk of cardiovascular disease. In L. Packer , U. Obermueller-Jevic , K. Kramer , & H. Sies (Eds.), Carotenoids and retinoids: Biological actions and human health (pp. 204–217). Champaign, IL: AOCS Press.
- Rao, A. V. , & Rao, L. G. (2007). Carotenoids and human health. Pharmacology Researcher , 55(3), 207–216. doi:10.1016/j.phrs.2007.01.012
- Reas, C. , & Fry, B. (2007). Processing: A programming handbook for visual designers and artists . Cambridge, MA: MIT Press.
- Richardson, W. C. , Avondolio, D. , Schrager, S. , Mitchell, M. W. , & Scanlon, J. (2007). Professional Java JDK ( 6 ed.). Indianapolis, Indiana: Wiley Publishing, Inc.
- Rissanen, T. , Voutilainen, S. , Nyyssonen, K. , & Salonon, J. (2002). Lycopene, atherosclerosis, and coronary heart disease. Experimental Biology and Medicine , 227, 900–907. doi:10.1177/153537020222701010
- Robertson, A. (1997). The CIE 1976 color-difference formulae. Colour Research and Application , 2(1), 7–11. doi:10.1002/j.1520-6378.1977.tb00104.x
- Schanda, J. (2007). Colorimetry: Understanding the CIE system . Hoboken, New Jersey: John Wiley & Sons, Inc.
- Sesso, H. D. , Liu, S. , Gaziano, J. M. , & Buring, J. E. (2003). Dietary lycopene, tomato-based food products and cardiovascular disease in women. The Journal of Nutrition , 133, 2336–2341. doi:10.1093/jn/133.8.2622
- Sheusi, J. C. (2013). Android Application development for Java programmers . Boston, MA: Cengage Learning.
- Srivastava, R. (2013). Research developments in computer vision and image processing: Methodologies and applications: Methodologies and applications . Hershey, PA: IGI Global.
- Szuvandzsiev, P. , Helyes, L. , Lugasi, A. , Szántó, C. , Baranowski, P. , & Pék, Z. (2014). Estimation of antioxidant components of tomato using VIS-NIR reflectance data by handheld portable spectrometer. International Agrophys , 28, 521–527.
- USDA . (2017). Index of official visual aids. Retrieved July 10, 2018, from https://www.ams.usda.gov/sites/default/files/media/Official%20Inventory%20of%20FV%20Inspection%20Aids.pdf.