
 ?Mathematical formulae have been encoded as MathML and are displayed in this HTML version using MathJax in order to improve their display. Uncheck the box to turn MathJax off. This feature requires Javascript. Click on a formula to zoom.
Abstract
This research paper describes the drying kinetics of ber (Zizyphus mauritiana) fruit and economic evaluation of hybrid photovoltaic/thermal (PV/T) solar dryer fabricated using locally available materials, e.g. galvanized iron sheet, glass, PV panel and fan. Ber fruits were dried to the safe level moisture content (20%) in a period of 240 h with the drying load of 18 kg. Four mathematical models were evaluated to predict the behaviour of ber (Zizyphus mauritiana) drying in a combined hybrid PV/T solar dryer. Experimental data of moisture ratio (MR) and temperature obtained from dryer were fitted to the four empirical drying models. The performance of the drying model was compared based on their statistical parameters: coefficient of determination (R2), root mean square error (RMSE) and reduced chi-square (χ2) between the observed and predicted MR. The logarithmic model was found to be the most suitable for describing the thin layer drying behaviour of ber (Zizyphus mauritiana). The effective moisture diffusivity was 3.34 × 10⁻⁷ m2/s and the efficiency of this dryer was found to be 16.7%. The developed hybrid PV/T drying system produces better quality products in shorter time by the efficient use of solar energy. The economic evaluation of the hybrid photovoltaic thermal (PV/T) solar dryer revealed that high value of IRR (54.5%) and low value of payback period (2.26 Years) make the dryer unit cost-efficient ensuring its economic viability.
PUBLIC INTEREST STATEMENT
A solar photovoltaic/thermal (PV/T) dryer dehydrates fruit and vegetables by reducing its moisture content to a safe level. The solar collector receives solar radiation through a transparent glass, which lets in solar radiation and after hitting the absorber surface, thermal radiation gets trapped. This is known as greenhouse effect which considerably enhances the collector temperature. The increased temperature takes away moisture from the surface and from within the produce to be dried. A provision is made for air inlet and outlet. In this forced convection, drying moisture is removed using a solar PV panel and DC fan. It is observed that fruit and vegetables are sold at throw away prices when there is a glut in the market. In the light of perishable nature of fruit and vegetables, they can be dried and stored and used for longer periods. This practice considerably reduces the post-harvest losses as well as reduces CO2 emission and supplements conventional energy sources.
1. Introduction
Ber or Indian jujube (Ziziphus mauritiana) is generally consumed fresh and is an important fruit of arid regions of India. Jujubes play an important role in human nutrition as sources of sugar, vitamins, protein and minerals (Yi, Wu, Zhang, Li, & Luo, Citation2012). Short shelf-life and post-harvest rotting are the most important problems in ber fruits. There has been limited post-harvest research on ber fruit in the past two to three decades, and the information is scattered in diverse local and regional sources, especially in India (Pareek & Yahia, Citation2013). Drying is practised to enhance the storage life, to minimize losses during storage and to reduce transportation costs of agricultural products (Leon, Kumar, & Bhattacharya, Citation2002). In India, 70% people depend on agricultural practices and of this most farmers are subsistence farmers, and affording hi-tech facilities and equipment is a major problem. Direct sun drying method has been practised since ancient time, and it is still being widely used in developing countries. Although this method of drying is cheap, yet it is associated with the problems like contamination as well as uneven drying.
To overcome these disadvantages, the drying process can be replaced with solar drying or industrial drying methods such as hot air. Mechanical drying which is mainly used in industrialized countries as an alternative to sun drying is not applicable to small farms in India. This is due to its high investment and operating costs. Fortunately, India is blessed with abundant solar energy (Pande et al., Citation2009). During winter from November to February, most of the Indian stations receive 4.0 to 6.3 kWhm−2 day−1 solar irradiance, while in summer season, this value ranges from 5.0 to 7.4 kWhm−2 day−1. The arid and semi-arid parts of the country receive much more radiation as compared to the rest of the country with 6.0–7.4 kWhm−2 day−1 mean annual daily solar radiation having 8.9 average sunshine hours a day at Jodhpur, India (Pande et al., Citation2009). Solar drying has been identified as a promising alternative to sun drying for drying of fruit and vegetables in developing countries like India because of its minimal operational cost in terms of fuel cost (Poonia, Singh, Santra, & Jain, Citation2017; Purohit, Kumar, & Kandpal, Citation2006). Utilization of solar energy for drying is advantageous because it is a free, low cost, renewable and abundant-energy source besides having environment-friendly and economically viable attributes making it acceptable for use by rural farmers (Sharma, Chen, & Vu Lan, Citation2009). It is also a more convenient alternative for rural sector and other areas with scarce or irregular electricity supply. Studies conducted on solar drying have proved it to be a good alternative for sun drying for the production of high-quality dried products (Ekechukwu & Norton, Citation1999; Hossain, Woods, & Bala, Citation2005; Mahapatra & Imre, Citation1990; Sodha & Chandra, Citation1994).
The research and development work for PV/T applications have increased in recent years to conserve the conventional energy sources. Headley (Citation1997) provides the overview of renewable energy systems/technologies (e.g. solar crop drying, PV applications etc.) in the Caribbean (Headley, Citation1997). Huang, Lin, Hung, and Sun (Citation2001) reported that an integrated PV/T system is economically feasible. Tonui and Tripanagnostopoulos (Citation2007) suggested some low-cost modifications to improve the performance of air-cooled PV/T solar collectors. Tiwari and Sodha (Citation2006a) developed a thermal model of an integrated PV/T solar (IPV/TS) system and reported that the simulations predict a daily thermal efficiency of around 58%, which is very close to the experimental value (61.3%) obtained by Huang et al. (Citation2001). Barnwal and Tiwari (Citation2008) conducted experimental studies of grape drying using hybrid PV/T green house dryer. Very recently Tiwari, Tiwari, and Al-Helal (Citation2016) have developed mathematical model of PV/T mixed mode greenhouse solar dryer. Modelling of the drying process is a valuable tool for prediction of performance of solar drying systems (Sacilik, Keskin, & Elicin, Citation2006). The thin layer drying model has been found to be most suitable for characterizing the drying parameters. Several researches on the mathematical modelling and experimental studies had been conducted on the thin layer drying processes of various agricultural products (Arslan and Özcan, Citation2010; Aghbashlo, Kianmehr, Khani, & Ghasemi, Citation2009; Corzo, Bracho, Pereira, & Vasquez, Citation2008; Doymaz, Citation2005; Doymaz & İsmail, Citation2011; Goyal, Kingsly, Manikantan, & Ilyas, Citation2007; Kouchakzadeh & Shafeei, Citation2010; Zielinska & Markowski, Citation2010). However, there is little information about thin layer solar drying process of ber fruit in the literature.
The present solar dryer is unique as it uses both thermal and solar photovoltaic simultaneously. The same unit is being used as solar collector as well as solar dryer. The solar photovoltaic fan regulates the temperature uniformly when solar radiation and ambient temperature are high, then the speed of fan is increased. With this in view, a solar dryer having a hybrid PV/T system has been designed and developed at the ICAR-Central Arid Zone Research Institute, Jodhpur, India for ber drying. In this paper, an attempt has been made to evaluate the drying characteristics of ber fruit by fitting four mathematical models for describing the thin-layer drying process for the solar drying of ber. The economic analyses of a hybrid PV/T dryer have also been carried out to study the real-time possibilities for its use in drying process.
2. Materials and methods
2.1. Design of solar dryer
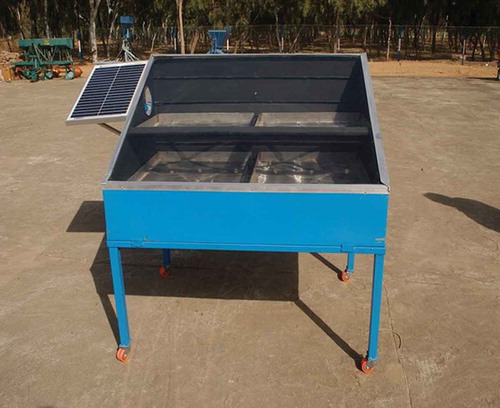
A PV/T hybrid solar dryer was designed and fabricated at the workshop of ICAR-Central Arid Zone Research Institute, Jodhpur, India. The hybrid system has been designed and fabricated in such a way that it enabled the combined production of electrical energy and thermal energy from the photovoltaic panel and flat plate collector, respectively. The drying methodology and steps of drying process are represented according to the flow diagram given in Figures and . The dryer consists of a collector unit, drying chamber, DC fan, PV panel and PCM chamber for thermal storage. The PV module was provided at left side of solar collector to operate a DC fan for forced mode of operation. Dryer having a size 1250 mm × 850 mm was made by galvanized steel sheet (22 gauge), which consists of four drying trays. The clear window glass (4mm thick) is provided at the top of the box. The area of collector designed for the dryer is 1.06 m2 with a DC fan of 10 W, which was used for exhausting moisture with the help of a solar panel of 20 Wp (Figure ). The dimension of two drying trays made of stainless steel angle frame and stainless steel wire mesh was (0.84 × 0.60 m) and that of two half trays (0.40 × 0.60 m). The drying material can be kept on four trays and placed on angle iron frame in the dryer through an openable door provided on the rear side of the dryer. Six plastic pipes are fixed in the back wall of the dryer just below the trays to introduce fresh air at the base. Actual installation of the PV/T hybrid solar dryer is shown in Figure .
Figure 1. (a) Drying methodology of photovoltaic/thermal (PV/T) hybrid solar dryer.
Figure 1. (b) Drying steps of photovoltaic/thermal (PV/T) hybrid solar dryer.
Figure 2. Schematic diagram of photovoltaic/thermal (PV/T) hybrid solar dryer.
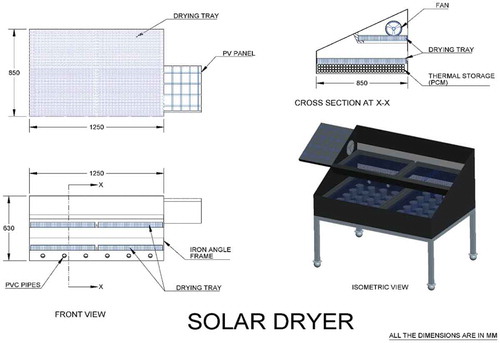
Figure 3. PVT hybrid solar dryer installed at CAZRI solar yard.

2.2. Experimental procedure
Ber (Zizyphus mauritiana) fruit used for the drying experiment was procured from a local market, and the selection was based on visual assessment of uniform colour and geometry. The drying trial for dehydrating ber (Zizyphus mauritiana) in this dryer was conducted in the month of January, 2017. During the drying process, the moisture loss of samples was determined by means of a digital electronic balance (Testing Instrument Pvt Ltd., India) having an accuracy of ± 0.001 g. The PV/T hybrid dryer was loaded with 18 kg of fresh ber fruits having 80% moisture content on wet basis. Hourly total solar insolation received on the horizontal plane was measured by pyranometer coupled with integrator. Air temperature inside the dryer and ambient temperature were measured hourly from 08:00 h to 18:00 h during the drying trials. Moisture content of the ber fruits during each day was computed from difference in these weighs.
The initial moisture content of the ber on wet basis was determined using the relation according to AOAC (AOAC, Citation2000).
where Mi is the initial moisture content of ber on wet basis expressed in %, Wi is the initial weight of ber in g and Wf is the final weight of ber in g. The recorded moisture contents for each sample were then used to plot the drying curves. The drying rate (DR) of ber fruits was calculated using following equation.
where
ΔM = loss of the mass of the crop (kg water/kg dry matter) and Δt = interval of time (min).
2.3. Mathematical modelling of drying curves and formulation
The moisture ratio (MR) and the drying rate (DR) of ber (Zizyphus mauritiana) fruit were calculated using the following equations during the drying experiments:
where M, M0, Me, Mt and Mt +dt are the moisture contents at a given time, initial moisture content, equilibrium moisture content, moisture content at the time of t and moisture content at the time of t+ dt (kg water/kg dry matter), respectively. However, MR is simplified to Mt /M0 , because Me is very small compared with Mt and M0 (Jain and Pathare, Citation2007; Midilli and Kucuk, Citation2003; Yaldiz, Ertekin, & Ibrahim Uzun, Citation2001)
Mathematical models that describe drying mechanisms of fruit and vegetables provide the required temperature and moisture information (Doymaz, Citation2012; Goyal et al., Citation2007; Koukouch et al., Citation2015). Thin-layer drying models can be categorized as theoretical, semi-theoretical and empirical models. Some semi-theoretical drying models that have been widely used in the literature (Henderson and Pabis (Citation1961) model, the Lewis model (Bruce, Citation1985), the Page model (Page, Citation1949) and logarithmic model (Doymaz, Citation2007) were tested. These models are generally derived by simplifying general series solution of Fick’s second law. These models were fitted in the experimental data in their linearized form using regression technique. The selected models used to explain the drying data of ber are described below.
2.3.1. The Henderson and Pabis model
The Henderson and Pabis model is the first term of a general series solution of Fick’s second law. Bi-parametric exponential model is another definition of this model. The Henderson and Pabis model has produced good correlations in predicting the drying of corn (Henderson & Pabis, Citation1961) and pumpkins (Hashim, Daniel, & Rahaman, Citation2014). This model can be written as:
where a and k are the constants of the model and t is the drying time.
2.3.2. The Lewis model (newton model)
The Lewis model is a special case of the Henderson and Pabis model where intercept is unity. It was used to describe drying characteristics of barley (Bruce, Citation1985) and strawberry (El-Beltagy, Gamea, & Amer Essa, Citation2007). The model is given in the following form:
where k is the constants of the model and t is the drying time.
2.3.3. The page model
The Page model is an empirical modification of the Lewis model that corrects some shortcomings. This model has been used to describe the drying of many agricultural products, such as corn (Page, Citation1949), pistachio nuts (Kashaninejad, Mortazavi, Safekordi, & Tabil, Citation2007), long green pepper (Akpinar & Bicer, Citation2008) and green soybean (Yang & Zhu, Citation2015). This model is given as:
where k and n are the constants of the model and t is the drying time.
2.3.4. Logarithmic model
The Henderson and Pabis model was modified by adding an empirical constant (c) to get the logarithmic model. It was successfully used to describe the drying characteristics of apricots (Toğrul & Pehlivan, Citation2002) and pumpkin slices (Doymaz, Citation2007). This model is expressed as:
where a, k and c are the constants of the model and t is the drying time.
2.4. Data analysis
The drying rate constants and coefficients of all of the models were estimated using the non-linear least square regression analysis, which was performed using SPSS (Statistical Package for Social Scientists) 11.5.1 software package. The coefficient of determination (R2) is one of the main criteria for selecting the best simulation equation of the drying curve best-fitting sample. The other factors are the chi-square value (χ2) and the root mean square value (RMSE). A high degree of fitting equations should have the highest coefficient of determination (R2), lower chi-square value (χ2) and root mean square error (RMSE) (Gbaha, Yobouet Andoh, Kouassi Saraka, Kamenan Koua, & Toure, Citation2007; Madhlopa, Jones, & Kalenga, Citation2002; Roberts, Singh, & Cunba, Citation2000; Tunde-Akintunde, Afolabi, & Akintunde, Citation2005). These statistical parameters were calculated according to the following equations:
where MRexp,i and MRpre,i are experimental and predicted MRs, respectively; N is number of observations; and z is number of drying constants.
2.5. Estimation of effective moisture diffusion coefficient
Effective moisture diffusion coefficient (Deff) reflects dehydration ability of materials under certain drying conditions and is a significant transport property in modelling the drying process of biological materials, as a function of temperature and moisture content in materials (Doymaz, Citation2012). The simplified mathematical Fick’s second law for diffusion was used to estimate the effective diffusion coefficient of the ber fruit during drying. Analytical solution of Fick’s second law is given in the Eq.(12), considering a constant moisture diffusivity, infinite slab geometry and uniform initial moisture distribution (Doymaz, Citation2012).
where Deff is the effective diffusivity coefficient (m2/s), r is the half thickness of the samples (m), n is the positive integer and t is the drying time (s). For long drying times (setting n = 1), Saravacos and Raouzeos (Citation1986) demonstrated that Eq. (12) could be further simplified to a straight-line equation and can be expressed in a logarithmic form by taking the natural logarithm of both sides.
The effective moisture diffusivity was calculated using the method of slopes. It is typically determined by plotting experimental drying data in terms of ln(MR) versus time (Domyaz, Citation2006). From Eq. (13), a plot of linear regression of ln(MR) versus drying time gives a straight line with a slope of:
Then the effective moisture diffusion coefficient (Deff) was calculated according to the slope, which was obtained by the linear fitting.
2.6. Thermal efficiency (η)
The efficiency of utilization of solar energy in solar dryer (ratio of heat used in evaporation of moisture from ber to the incident total solar radiation on horizontal plane) has been worked out using the following relation (Leon et al., Citation2002; Poonia et al., Citation2017):
where A = Absorber area (m2); HT = Solar radiation on horizontal plane (J m−2 hr−1); L = Latent heat of vaporization (J kg−1); M = Mass of moisture evaporated from the product (kg); θ = Period of test (hr) and η = Efficiency of the solar dryer.
3. Results and discussion
3.1. Drying characteristics
The maximum stagnation temperature observed inside the drying chamber was 70°C and on loading 18 kg of ber, the maximum temperature reduced to 64°C, when the outside ambient temperature was 23°C. The variation of solar insolation, ambient temperature and temperature inside upper and lower tray of dryer, when ber fruit was loaded during the drying trails, is shown in Figure . It can be seen that the effect of drying temperature on the required drying time was considerably pronounced, which is in agreement with the results from several food materials, such as plums (Goyal et al., Citation2007), pumpkin slices (Doymaz, Citation2007), pistachio nuts (Kashaninejad et al., Citation2007) and castor oil seeds (Perea-Flores et al., Citation2012).
Figure 4. Temperature and solar insolation variation with time for load test (ber).
The variation of measured moisture content (wet basis) of the ber fruits on each day of drying trials was shown in Figure . It can be seen that the moisture content was reduced from about 80% to 26% within 8 days by the solar drying method and on tenth day it came to 20%. However, after 8 days (26% moisture content), it could be safely stored for further use. when the moisture content falls below 66%, the drying rate in the solar dryer increases sharply. The shape of the drying curve indicates a rapid moisture removal from the product at the initial stage, which later decreased with increase in drying time. Thus, the MR decreased continually with drying time. This continuous decrease in MR indicates that diffusion has governed the internal mass transfer. This is in agreement with the results of study on figs (Piga, Pinna, Ozer, Agabbio, & Aksoy, Citation2004), lettuce and cauliflower leaves (Lopez, Iguaz, Esnoz, & Virsed, Citation2000) and ber (Das & Dutta, Citation2013), tomatoes (Doymaz, Citation2007) and amasya red apples (Domyaz, Citation2010).
Figure 5. Variation of moisture content in ber solar drying against drying time.
3.2. Fitting of drying models
The four drying models (Henderson and Pabis model—Eq. (5); Lewis model—Eq. (6); Page model—Eq. (7); and that of Logarithmic model—Eq. (8)) were used to fit the drying data obtained to estimate the MR as a function of drying time. The statistical analyses undertaken on the drying data to evaluate the models for experimental condition (i.e. parameters such as coefficient of determination (R2), chi-square (χ2) and root mean square error (RMSE) obtained using Eqs. (9–11) are shown in Table . The model that best predicts the drying process will have higher values of R2 , and lower values of χ2 and RMSE. For all the models, the ranges of R2 , χ2 and RMSE values were between 0.9881 and 0.9982, 0.000047 and 0.00014 and 0.007338 and 0.012605, respectively. Overall, it could be revealed that the logarithmic model presented the higher R2 values, whereas their χ2 and RMSE values were relatively lower than those for the other tested models (Table ). The higher values of R2 for logarithmic model show that it represents a better correlation between the MR and drying time than the other models. Therefore, according to the results from Table , logarithmic model was best-suited compared with other models, and this model was chosen as the optimal model providing satisfactory descriptions of drying characteristics of ber fruits. The values of R2 obtained from all the models were higher than the acceptable R2 value of 0.97 (Shen et al., Citation2011).
Table 1. Statistical results obtained from four thin-layer drying models
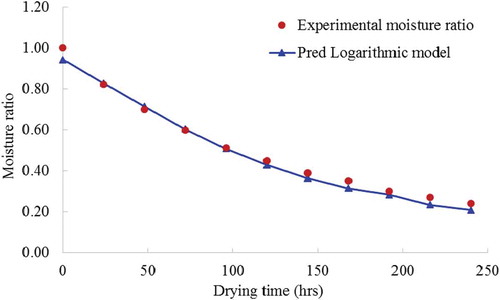
The experimental and predicted MR by the logarithmic model for ber fruit was shown in Figure . It can be observed from the figure that the experimental MR was, in general, in line with the predicted ones. It is clearly indicated that this model could be used to describe the MR variation during the drying process. The logarithmic model was also reported by other researchers as the most suitable model to explain the drying behaviour and MR evolution of apricot (Faal, Tavakoli, & Ghobadian, Citation2015); black grapes (Domyaz, Citation2006); chilli pepper (Tunde-Akintunde, Citation2011); onion slices (Sharma, Verma, & Pathare, Citation2005) and water chestnut (Singh, Sharma, Bawa, & Saxena, Citation2008).
Figure 6. Experimental and predicted moisture ratio (MR) by logarithmic model versus drying time for ber fruits
3.3. Effective moisture diffusivity (deff)
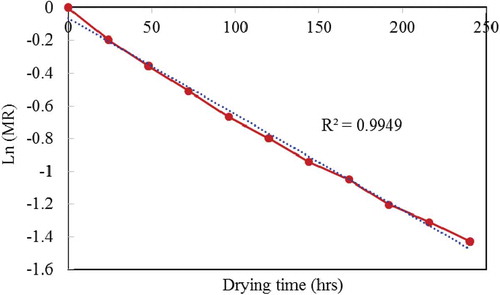
The effective moisture diffusivity computed using the graph of ln (MR) against time was shown in Figure . It can be observed that the Deff of ber fruits was 3.34 × 10⁻⁷ m2/s during the experiment for a loading rate of 18 kg. The value of the effective moisture diffusion coefficients obtained from the experiment was similar to the results by some researchers, from 7.20 × 10⁻⁹ to 1.91 × 10⁻⁸ m2/s for the thin-layer drying of sweet sorghum stalks at 30–70°C (Shen et al., Citation2011) and 4.08 × 10⁻⁸ to 2.35 × 10⁻⁷ m2/s for convective drying of pumpkin at 30–70°C (Hashim et al., Citation2014). According to reports (Wang et al., Citation2007), the values of effective diffusivity fall within the range of 10−11 to 10−7 m2/s for all agricultural and food products.
Figure 7. Experimental logarithmic moisture ratio (MR) in function drying time at drying temperature for ber fruit
3.4. Dryer overall efficiency
The overall efficiency of the drying is affected by several factors such as drying time, climatic conditions (solar insolation and temperature), the drying characteristics of the dried materials and structure of the drying devices etc. The average efficiency of utilization of solar energy in the solar dryer was calculated by Eq. (15), and it was found that about 16.7% solar energy was utilized in this solar dryer. During drying process, it was observed that higher efficiency was observed at initial stage of drying, later stage this dryer efficiency decreased due to decrease in moisture content. Moreover, the efficiency was more at a higher drying load of 18 kg which might be due to highest drying time.
4. Economic analysis of PV/T hybrid solar dryer
The PV/T hybrid solar dryer was used for drying ber (Zizyphus mauritiana) fruits. The economic analysis of the present dryer was carried out by computing the life cycle cost (LCC) and life cycle benefit (LCB) of the dryer. In addition, five economic attributes, namely, benefit-cost ratio (BCR), net present worth (NPW), annuity (A), internal rate of return (IRR) and pay-back period (PBP), were also determined for judging the economic viability of the dryer (Table ).
Table 2. Values of NPW for different rates of discount/interest (i)
Table 3. Values of economic attributes
4.1. Life cycle cost (LCC)
LCC of the PV/T hybrid solar dryer is the sum of all the costs associated with a solar drying system over its lifetime in terms of money value at the present instant of time and it takes into account the time value of money (Kalogirou, Citation1996). The initial investment (P) of the dryer unit is INR 14,000. The annual cost of operation and maintenance (O&M) including labour are taken as INR 4000. The salvage value is taken as 10% of initial investment.
4.1.1. Determination of (LCC)
Economics of PV/T hybrid solar dryer was calculated through LCC analysis. Let Pi be the initial investment (INR), Pw the operational and maintenance expenses including replacement costs for damaged components (INR), n the life of the dryer (Year), Pw (SV) the salvage value of the dryer at the end of the dryers life (INR). The procedure of LCC estimation as adopted by Barnwal & Tiwari, Citation2008; Sodha, Chandra, Pathak, Singh, & Bansal, Citation1991 is given as,
Where
where, e = annual escalation in cost (in fraction) and i = interest or discount rate (in fraction).
4.2. Life cycle benefits (LCB)
The values of R (annual benefit) are obtained using the dryer for 10 trials each for ber (Zizyphus mauritiana) and seed less lasoda/gonda. The quantity of ber to be dried was about 180 kg costing about 3,600 Indian Rupees. The dried ber was about 60 kg, which fetched (accrued) about INR 9,000/- at a rate of 150 INR/kg. The ensuring benefit of INR 5,400/-. Similarly 10 trials of seedless lasoda/gonda dried about 180 kg gonad, which ensured INR 30/kg benefit on raw seedless gonda amount to about INR 5,400/-. Thus, the total annual benefit from dried product was about INR 10,800/-.
The LCB can be given as,
where R = annual benefit (INR) and .
4.3. Economic attributes
BCR: The ratio of discounted benefits to the discounted values of all costs given as LCB/LCC.
NPW: It is the sum of all discounted net benefits throughout the project given as LCB-LCC.
The annuity (A) of the project indicates the average net annual returns given as,
PBP: It is the length of time from the beginning of the project before the net benefits return the cost of capital investments (value n for LCB–LCC = 0).
IRR: It is that rate of interest which makes LCB and LCC equal (LCB—LCC = 0)
4.3.1. Determination of economic attributes
(i) BCR: The ratio of discounted benefits to the discounted values of all costs can be expressed as:
(ii) NPW = LCB – LCC = 37018
(iii) The annuity (A) of the project indicates the average net annual returns. This term can be given as,
(iv) Pay-back period can be determined as following: -LCC + LCB = 0
Or 14000 + 4000 x
Or Pay-back period (PBP) = 2.26 year
(v) Internal rate of return (IRR):
The values of NPW at varying discount rates are given in Table . From Table , it is evident that at 10% interest rate the NPW is INR37,018.59/- and at 50% rate of interest the NPW is INR981.98. However, the NPW is negative at 70% interest rate (i.e. NPW = INR–3376.83/-). The IRR can be determined using data presented in Table and the following relationship:
The IRR which comes to 54.5% in the present case, is very high for a project to be economically viable.
The values of five economic attributes, namely, BCR, NPW, A, IRR and PBP are presented in Table .
5. Conclusion
The drying characteristics of the ber (Zizyphus mauritiana) fruit using a (PV/T) hybrid solar dryer were studied by fitting the data to four models, namely, Henderson and Pabis, Newton, Logarithmic and Page. The drying process involves accelerating rate and falling rate periods, and no constant rate drying period was observed. Three statistical tools were used to quantify the goodness of fitting: the determination of coefficient (R2 ), the reduced chi-square (χ2) and root mean square error (RMSE). The logarithmic model, which gave higher values of coefficient of determination and lower values of reduced chi-square and RMSE, was considered as the best for predicting the drying characteristics of solar dried ber fruit. The economic parameters such as, IRR and PBP (2.26 years) make the unit very cost-effective. This solar dryer reduced the moisture content from 80% to 20% within 240 h. The use of this hybrid PV/T dryer will prove to be a boon for remote location/rural area with less reliable conventional energy sources. It will go a long way in reducing post-harvest losses as well as CO2 emission.
Nomenclature
| A | = | absorber area (m2) |
| a | = | drying constant |
| b | = | drying constant |
| Deff | = | effective diffusivity (m2 s−1) |
| HT | = | solar radiation on horizontal plane (J m−2 hr−1) |
| k | = | drying constant, (l/min) |
| L | = | latent heat of vaporization (J kg−1) |
| M | = | mass of moisture evaporated from the product (kg) |
| Me | = | equilibrium moisture content, (kg water/kg dry matter) |
| Mo | = | initial moisture content, (kg water/kg dry matter) |
| MR | = | moisture ratio (dimensionless) |
| MRexp | = | experimental moisture ratio |
| MRpre | = | predicted moisture ratio |
| Mt | = | moisture content, (kg water/kg dry matter) |
| n | = | drying constant, positive integer |
| N | = | number of observations |
| R | = | ideal gas constant, (kJ/mol K) |
| r | = | the half-thickness of the samples (m) |
| R2 | = | coefficient of determination |
| RMSE | = | root mean square error |
| Wi | = | initial weight of product (g) |
| Wf | = | final weight of product (g) |
| χ2 | = | reduced chi-square |
| t | = | drying time, min |
| T | = | temperature, (°C) |
| z | = | number of constants in models |
| η | = | efficiency of the solar dryer. |
| θ | = | period of test (hr) |
Cover Image
Source:
Additional information
Funding
Notes on contributors
Surendra Poonia
Dr Surendra Poonia is presently working as Senior Scientist (Physics), Division of Agricultural Engineering and Renewable Energy, ICAR-Central Arid Zone Research Institute, Jodhpur, Rajasthan, India. He did his MSc (Physics) in Solid State Physics in 1998 and PhD in X-ray Emission Spectroscopy during 2002 from Jai Narain Vyas University, Jodhpur, India. Dr Poonia was awarded four times Indian Science Congress Association (ISCA) young Scientist award during 2001, 2003, 2004 and 2005 for outstanding Studies on the Lα, Lβ1 and Lβ2 X-ray satellite spectra in 3d, 4d and 5d transition elements. He has also done considerable work on X-ray satellites and their multiple structure, solar thermal energy technologies, energy management, drought monitoring and climate change. He brought out more than 115 publications in national and international journals of Physics and solar energy, six technical research bulletins and 20 popular articles. Dr Poonia is a member of various National and International Scientific societies.
Related Research Data
References
- Aghbashlo, M. , Kianmehr, M. H. , Khani, S. , & Ghasemi, M. (2009). Mathematical modeling of thin layer drying of carrot. International Journal of Agrophysics , 23, 313–317.
- Akpinar, A. K. , & Bicer, Y. (2008). Mathematical modelling of thin layer drying process of long green pepper in solar dryer and under open sun. Energy Conversion and Management , 49, 1367–1375. doi:10.1016/j.enconman.2008.01.004
- Arslan, D. , & Özcan, M. M. (2010). Study the effect of sun, microwave and microwave drying on quality of onion slices. Food Science and Technology , 43(7), 1121–1127.
- Association of Official Analytical Chemists (AOAC) . (2000). Official methods of analysis . Washington D.C., USA: Author.
- Barnwal, P. , & Tiwari, G. N. (2008). Grape drying by using hybrid photovoltaic–Thermal (PV/T) greenhouse dryer: An experimental study. Solar Energy , 82, 1131–1144. doi:10.1016/j.solener.2008.05.012
- Bruce, D. M. (1985). Exposed-layer barley drying, three models fitted to new data up to 150°C. Journal of Agricultural Engineering Research , 32, 337–347. doi:10.1016/0021-8634(85)90098-8
- Corzo, O. , Bracho, N. , Pereira, A. , & Vasquez, A. (2008). Weibull distribution for modeling air drying of coroba slices. Journal of Food Science and Technology , 41, 2023–2028.
- Das, P. , & Dutta, A. S. (2013). A comparative study on drying of ber. Journal of Agricultural Engineering , 50(1), 34–38.
- Domyaz, I. (2006). Drying kinetics of black grapes treated with different solutions. Journal of Food Engineering , 76, 212–217. doi:10.1016/j.jfoodeng.2005.05.009
- Domyaz, I. (2010). Effect of citric acid and blanching pre-treatments on drying and rehydration of Amasya red apples. Food and Bioproducts Processing , 88, 124–132. doi:10.1016/j.fbp.2009.09.003
- Doymaz, İ. (2007). The kinetics of forced convective air-drying of pumpkin slices. Journal of Food Engineering , 79(1), 243–248. doi:10.1016/j.jfoodeng.2006.01.049
- Doymaz, İ. (2012). Evaluation of some thin-layer drying models of persimmon slices (Diospyros kaki L). Energy Conversion and Management , 56, 199–205. doi:10.1016/j.enconman.2011.11.027
- Doymaz, İ. , & İsmail, O. (2011). Drying characteristics of sweet cherry. Food and Bioproducts Processing , 89(1), 31–38. doi:10.1016/j.fbp.2010.03.006
- Doymaz, I. (2005). Drying behaviour of green beans. Journal of Food Engineering , 69, 161–165. doi:10.1016/j.jfoodeng.2004.08.009
- Ekechukwu, O. V. , & Norton, B. (1999). Review of solar-energy drying systems II: An overview of solar drying technology. Energy Conversion and Management , 40, 615–655. doi:10.1016/S0196-8904(98)00093-4
- El-Beltagy, A. , Gamea, G. R. , & Amer Essa, A. H. (2007). Solar drying characteristics of strawberry. Journal of Food Engineering , 78, 456–464. doi:10.1016/j.jfoodeng.2005.10.015
- Faal, S. , Tavakoli, T. , & Ghobadian, B. (2015). Mathematical modelling of thin layer hot air drying of apricot with combined heat and power dryer. Journal of Food Science and Technology , 52(5), 2950–2957. doi:10.1007/s13197-014-1331-9
- Gbaha, P. , Yobouet Andoh, H. , Kouassi Saraka, J. , Kamenan Koua, B. , & Toure, S. (2007). Experimental investigation of a solar dryer with natural convective heat flow. Renewable Energy , 32, 1817–1829. doi:10.1016/j.renene.2006.10.011
- Goyal, R. K. , Kingsly, A. R. P. , Manikantan, M. R. , & Ilyas, S. M. (2007). Mathematical modelling of thin layer drying kinetics of plum in a tunnel dryer. Journal of Food Engineering , 79(1), 176–180. doi:10.1016/j.jfoodeng.2006.01.041
- Hashim, N. , Daniel, O. , & Rahaman, E. (2014). A preliminary study: Kinetic model of drying process of pumpkins (Cucurbita moschata) in a convective hot air dryer. Agriculture and Agricultural Science Procedia , 2, 345–352. doi:10.1016/j.aaspro.2014.11.048
- Headley, O. (1997). Renewable energy technologies in the Caribbean. Solar Energy , 59(1–3), 1–9. doi:10.1016/S0038-092X(96)00128-4
- Henderson, S. M. , & Pabis, S. (1961). Grain drying theory. I. Temperature effect on drying coefficient. Journal of Agricultural Engineering Research , 6(3), 169–174.
- Hossain, M. A. , Woods, J. L. , & Bala, B. K. (2005). Optimisation of solar tunnel drier for drying of chilli without color loss. Renewable Energy , 30, 729–742. doi:10.1016/j.renene.2004.01.005
- Huang, B. J. , Lin, T. H. , Hung, W. C. , & Sun, F. S. (2001). Performance evaluation of solar photovoltaic/thermal systems. Solar Energy , 70(5), 443–448. doi:10.1016/S0038-092X(00)00153-5
- Jain, D. , & Pathare, P. B. (2007). Study the drying kinetics of open sun drying of fish. Journal of Food Engineering , 78(4), 1315–1319. doi:10.1016/j.jfoodeng.2005.12.044
- Kalogirou, S. (1996). Economic analysis of solar energy systems using spreadsheets. Renewable Energy, 9(1-4), 1303-1307. doi: 10.1016/0960-1481(96)88516-8
- Kashaninejad, M. , Mortazavi, A. , Safekordi, A. , & Tabil, L. G. (2007). Thin layer drying characteristics and modeling of pistachio nuts. Journal of Food Engineering , 78(1), 98–108. doi:10.1016/j.jfoodeng.2005.09.007
- Kouchakzadeh, A. , & Shafeei, S. (2010). Modeling of microwave-convective drying of pistachios. Energy Conversation and Management , 51(10), 2012–2015. doi:10.1016/j.enconman.2010.02.034
- Koukouch, A. , Idlimam, A. , Asbik, M. , Sarh, B. , Izrar, B. , Bah, A. , & Ansari, O. (2015). Thermophysical characterization and mathematical modeling of convective solar drying of raw olive pomace. Energy Conversion and Management , 99, 221–230. doi:10.1016/j.enconman.2015.04.044
- Leon, A. M. , Kumar, S. , & Bhattacharya, S. C. (2002). A comprehensive procedure for performance evaluation of solar food dryers. Renewable and Sustainable Energy Reviews , 6(4), 367–393. doi:10.1016/S1364-0321(02)00005-9
- Lopez, A. , Iguaz, A. , Esnoz, A. , & Virsed, P. (2000). Thin-layer drying behaviour of vegetable wastes from wholesale market. Drying Technology , 18, 995–1006. doi:10.1080/07373930008917749
- Madhlopa, A. , Jones, S. A. , & Kalenga, S. J. D. (2002). A solar air heater with compositee absorber systems for food dehydration. Renewable Energy , 27, 27–37. doi:10.1016/S0960-1481(01)00174-4
- Mahapatra, A. K. , & Imre, L. (1990). Role of solar agricultural drying in developing countries. International Journal of Ambient Energy , 2, 205–210. doi:10.1080/01430750.1990.9675175
- Midilli, A. , & Kucuk, H . (2003). Mathematical modeling of thin layer drying of pistachio by using solar energy. Energy Conversion and Management , 44(7), 1111-1122. doi:10.1016/S0196-8904(02)00099-7
- Page, G. E. (1949). Factors influencing the maximum rates of air drying shelled corn in thin layers ( MS thesis). Department of Mechanical Engineering, Purdue University, West Lafayette, IN, USA.
- Pande, P. C. , Nahar, N. M. , Chaurasia, P. B. L. , Mishra, D. , Tiwari, J. C. , & Kushwaha, H. L. (2009). Renewable energy spectrum in arid region. In A. Kar , B. K. Garg , M. P. Singh , & S. Kathju (Eds.), Trends in arid zone research in India (pp. 210–237). Jodhpur, India: ICAR-Central Arid Zone Research Institute.
- Pareek, S. , & Yahia, E. M. (2013). Postharvest biology and technology of ber fruit. In J. Janick (Ed.), Horticultural reviews (pp. 201–240). Ames: Wiley-Blackwell, John Wiley & Sons, Inc.
- Perea-Flores, M. J. , Garibay-Febles, V. , Chanona-Pérez, J. J. , Calderón-Domínguez, G. , Méndez-Méndez, J. V. , Palacios-González, E. , & Gutiérrez-López, G. F. (2012). Mathematical modelling of castor oil seeds (Ricinus communis) drying kinetics in fluidized bed at high temperatures. Industrial Crops and Products , 38, 64–71. doi:10.1016/j.indcrop.2012.01.008
- Piga, A. , Pinna, I. , Ozer, K. B. , Agabbio, M. , & Aksoy, U. (2004). Hot air dehydration of figs (Ficus carica L.): Drying kinetics and quality loss. International Journal of Food Science and Technology , 39, 793–799. doi:10.1111/ifs.2004.39.issue-7
- Poonia, S. , Singh, A. K. , Santra, P. , & Jain, D. (2017). Performance evaluation and cost economics of a low cost solar dryer for ber (Zizyphus mauritiana) fruit. Agricultural Engineering Today , 41(1), 25–30.
- Purohit, P. , Kumar, A. , & Kandpal, T. C. (2006). Solar drying vs. open sun drying: A framework for financial evaluation. Solar Energy , 80, 1568–1579. doi:10.1016/j.solener.2005.12.009
- Roberts, M. , Singh, R. P. , & Cunba, L. M. (2000). Osmotic-convective dehydrofreezing process for drying kiwi fruit. Journal of Food Science , 62(5), 1039–1042. doi:10.1111/j.1365-2621.1997.tb15033.x
- Sacilik, K. , Keskin, R. , & Elicin, A. K. (2006). Mathematical modelling of solar tunnel drying of thin layer organic tomato. Journal of Food Engineering , 73, 231–238. doi:10.1016/j.jfoodeng.2005.01.025
- Saravacos, G. D. , & Raouzeos, G. S. (1986). Diffusivity of moisture in air-drying of raisins. In A. S. Mujumdar (Ed.), Drying (Vol. 86, pp. 487–491). New York, USA: Hemisphere Publishing Co.
- Sharma, A. , Chen, C. R. , & Vu Lan, N. (2009). Solar-energy drying systems: A review. Renewable and Sustainable Energy Reviews , 13, 1185–1210. doi:10.1016/j.rser.2008.08.015
- Sharma, G. P. , Verma, R. C. , & Pathare, P. B. (2005). Thin-layer infrared radiation drying of onion slices. Journal of Food Engineering , 67(3), 361–366. doi:10.1016/j.jfoodeng.2004.05.002
- Shen, F. , Peng, L. , Zhang, Y. , Wu, J. , Zhang, X. , Yang, G. , … Deng, S. (2011). Thin-layer drying kinetics and quality changes of sweet sorghum stalk for ethanol production as affected by drying temperature. Industrial Crops and Products , 34(3), 1588–1594. doi:10.1016/j.indcrop.2011.05.027
- Singh, G. D. , Sharma, R. , Bawa, A. S. , & Saxena, D. C. (2008). Drying and rehydration characteristics of water chestnut (Trapa natans) as a function of drying air temperature. Journal of Food Engineering , 87(2), 213–221. doi:10.1016/j.jfoodeng.2007.11.027
- Sodha, M. S. , & Chandra, R. (1994). Solar drying systems and their testing procedures: A review. Energy Conversion and Management , 35, 219–267. doi:10.1016/0196-8904(94)90004-3
- Sodha, M. S. , Chandra, R. , Pathak, K. , Singh, N. P. , & Bansal, N. K. (1991). Techno economic analysis of typical dryers. Energy Conversion and Management , 31(6), 509–513. doi:10.1016/0196-8904(91)90085-W
- Tiwari, A. , & Sodha, M. S. (2006a). Performance evaluation of solar PV/T system. An experimental validation. Solar Energy , 80(7), 751–759. doi:10.1016/j.solener.2005.07.006
- Tiwari, S. , Tiwari, G. N. , & Al-Helal, I. M. (2016). Performance analysis of photovoltaic–Thermal (PVT) mixed mode greenhouse solar dryer. Solar Energy , 133, 421–428. doi:10.1016/j.solener.2016.04.033
- Toğrul, İ. T. , & Pehlivan, D. (2002). Mathematical modeling of solar drying of apricots in thin layers. Journal of Food Engineering , 55(3), 209–216. doi:10.1016/S0260-8774(02)00065-1
- Tonui, J. K. , & Tripanagnostopoulos, Y. (2007). Air-cooled PV/T solar collectors with low cost performance improvements. Solar Energy , 81(4), 498–511. doi:10.1016/j.solener.2006.08.002
- Tunde-Akintunde, T. Y. (2011). Mathematical modeling of sun and solar drying of chilli pepper. Renewable Energy , 36, 2139–2145. doi:10.1016/j.renene.2011.01.017
- Tunde-Akintunde, T. Y. , Afolabi, T. J. , & Akintunde, B. O. (2005). Influence of drying methods on drying of bell-pepper (Capiscum annuum). Journal of Food Engineering , 68(4), 439–442. doi:10.1016/j.jfoodeng.2004.06.021
- Wang, Z. , Sun, J. , Liao, X. , Chen, F. , Zhao, G. , Wu, J. , & Hu, X. (2007). Mathematical modeling on hot air drying of thin layer apple pomace. Food Research International , 40(1), 39–46. doi:10.1016/j.foodres.2006.07.017
- Yaldiz, O. , Ertekin, C. , & Ibrahim Uzun, H . (2001). Mathematical modeling of thin layer solar drying of sultana grapes. Energy , 26(5), 457-465. doi:10.1016/S0360-5442(01)00018-4
- Yang, Z. , & Zhu, E. (2015). Water desorption isotherm and drying characteristics of green soybean. Journal of Stored Products Research , 60, 25–30. doi:10.1016/j.jspr.2014.10.006
- Yi, X. K. , Wu, W.-F. , Zhang, Y. Q. , Li, J. X. , & Luo, H. P. (2012). Thin-layer drying characteristics and modeling of chinese jujubes. Mathematical Problems in Engineering , 1, 1–18. doi:10.1155/2012/386214
- Zielinska, M. , & Markowski, M. (2010). Air drying characteristics and Effective moisture diffusivity of carrots. Chemical Engineering and Processing , 49, 212–218. doi:10.1016/j.cep.2009.12.005