
 ?Mathematical formulae have been encoded as MathML and are displayed in this HTML version using MathJax in order to improve their display. Uncheck the box to turn MathJax off. This feature requires Javascript. Click on a formula to zoom.
Abstract
The use of nanoparticles in the formulation of drilling mud has gained unparalleled research effort. Despite the advancement of nanotechnology, key challenges still remain which relates to attaining predictable properties for nano-drilling muds. In this work, Zinc Oxide (ZnO) nanoparticles were synthesized and applied to a water-based drilling mud. The characterization of the ZnO nanoparticles was done using Energy Dispersive X-Ray (EDX) Spectroscopy, Scanning Electron Microscopy (SEM), and X-Ray Diffraction (XRD). A basic fundamental approach was applied in deriving a novel model, which predicts the impact of the nanoparticles on the fluid loss of drilling mud during the filtration process. This was done taking into account the kinetics of mud cake formation and colloidal behavior of the nanoparticles. The new fluid loss model gave a better description of the fluid loss behavior of the nano-drilling mud when compared with the American Petroleum Institute (API) model using statistical measures.
PUBLIC INTEREST STATEMENT
Oil and gas exploration and development is gradually shifting from onshore to deep offshore, which are under extreme environmental conditions. Drilling operations represents a critical part of oil and gas development, hence the need to improve the rheological properties of the major ingredient of drilling operation, which is the drilling mud. Nanotechnology has provided the needed platform in improving drilling mud performance in deep offshore conditions. In this research work done, zinc oxide nanoparticles were synthesized and used as additives in drilling mud and its fluid loss studied. The fluid loss behaviour was studied using conventional oil and gas models and this was compared with a new model. The model was able to go a step further and predict fluid loss based on the nanoparticle properties.
1. Introduction
The use of nanoparticles in bentonite suspensions in the formulation of drilling mud has gained unparalleled research effort (Abdo & Danish-Haneef, Citation2012; Afolabi, Citation2017; Hoelscher, Stefano, Riley, & Young, Citation2012; Mahmoud, Nasr El-Din, Vryzas, & Kelessidis, Citation2016; Vryzas & Kelessidis, Citation2017; Yang, Yue, Cai, Liu, & Wu, Citation2015). This is significantly due to the reduction in the cost involved and the chemical content of the drilling mud. Furthermore, properties such as fluid loss and rheology control, wellbore strengthening, wellbore and shale stabilization, magnetic properties, cuttings suspension, and thermal properties are improved (Abdo & Danish-Haneef, Citation2012; Afolabi, Citation2017; Vryzas & Kelessidis, Citation2017). With this, using nanoparticles as an additive can also improve the properties of drilling muds in meeting the challenges of tough downhole conditions. Despite the advancement of nanotechnology, a key challenge involves attaining predictable properties for the modified drilling mud (Gerogiorgis, Reilly, Vryzas, & Kelessidis, Citation2017; Vryzas & Kelessidis, Citation2017). Past research efforts have been channeled toward examining the use and impact of different types of nanoparticles such as iron oxide nanoparticles, aluminum oxide nanoparticles, silicon oxide nanoparticles, polymeric-coated nanoparticles, and titanium nitride nanoparticles in the preparation of drilling muds (Ismail, Aftab, Ibupoto, & Zolkifile, Citation2016; ShamsiJazeyi, Miller, Wong, Tour, & Verduzco, Citation2014; Vryzas & Kelessidis, Citation2017). The properties of the modified mud were investigated at different downhole conditions obtainable during drilling operations with improved results (Vryzas & Kelessidis, Citation2017; Yang et al., Citation2015). The known properties of drilling muds, which can be altered with the use of nanoparticles, are wellbore and shale stabilization, rheology and fluid loss control, wellbore strengthening, cuttings suspension, thermal properties of the drilling muds, and magnetic properties (Hoelscher et al., Citation2012; Vryzas & Kelessidis, Citation2017). The known predictive tools for describing drilling mud behavior allow for a generalized computation of drilling performance (Gerogiorgis et al., Citation2017; Reilly, Vryzas, Kelessidis, & Gerogiorgis, Citation2016). For example, the known rheological models used in the characterization of bentonite-based muds allow for a parameterized computation of fluid rheology (Vryzas & Kelessidis, Citation2017). The work of Reilly et al. (Citation2016) and Gerogiorgis et al. (Citation2017) laid a good foundation for rheological models for nano-drilling fluids. Furthermore, extending the work to cover other aspects of drilling mud performance such as fluid loss behavior is required. There is currently no known model which incorporates the impact of nanoparticles on the fluid loss behavior of drilling muds. This would require modifying the existing API model (Vipulanandan, Raheem, Basirat, & Mohammed, Citation2014). The development of models for describing the fluid loss behavior of nanoparticle-enhanced drilling fluids is critical toward successful modeling, design, and cost-effective drilling operations (Vryzas & Kelessidis, Citation2017). This work looked at the impact of zinc oxide nanoparticles on the fluid loss of water-based drilling mud. Also, a new fluid loss model which incorporates the contribution of the nanoparticles to the fluid loss behavior was developed. The characterization of the ZnO nanoparticles was done using Energy Dispersive X-Ray (EDX) Spectroscopy, Scanning Electron Microscopy (SEM), and X-Ray Diffraction (XRD). A basic foundational approach was used in deriving a model, which describes the fluid loss obtained from zinc oxide nanoparticle-enhanced drilling mud. This was done taking into account the kinetics of mud cake formation which is similar to the structural kinetics of the bentonite suspension described by Toorman (Citation1997) and colloidal behavior of the nanoparticles (Gerogiorgis et al., Citation2017; Reilly et al., Citation2016).
2. Materials and methods
2.1. Materials
Analytical grade zinc nitrate hexahydrate and sodium hydroxide were supplied by Equilab Solutions, Nigeria. The solutions prepared using these chemicals was done using deionized water. The bentonite clay was of drilling grade standard as indicated in the API specification 13-A for drilling fluid materials.
2.2. Synthesis of zinc oxide (Zno) nanoparticles
0.1M zinc nitrate solution was made by adding 15 g of zinc nitrate hexahydrate [ in 500 ml of distilled water and stirred using a Stuart® magnetic stirrer (Model Number: US152). A total of 1.0M sodium hydroxide [
] solution was also prepared by adding 20 g of
pellets in 500 ml of distilled water, and the solution was stirred continuously to ensure homogeneity. Dropwise amount of
solution was added to the
solution under continuous stirring for 12 h. The formed precipitate was separated from the solution using a centrifuge at 8,000 RPM for 15 min and settled pellets were collected. The pellets were dehydrated using an oven working at 80°C for 80 min. The dried pellets were homogenized by grinding with a pestle until a smooth fine white powder was obtained. The obtained powder was kept in bottles which are air-tight for additional analysis.
2.3. Characterization of zinc oxide (Zno) nanoparticles
Characterization of ZnO nanoparticles was done based on XRD analysis, and SEM/EDX analysis. The XRD analysis was done using a diffractometer (PAN Analytical X-Pert Pro) operated at 30 kV and 40 mA. The pattern obtained from the XRD analysis was logged by CuKα radiation around 1.54060. The Scherrer equation (Equation 1) was used in estimating the size of the ZnO nanoparticles:
where is the line broadening at half the maximum intensity (FWHM),
is a dimensionless shape factor, with a value close to unity,
is the nanoparticle size in nm,
is the X-ray wavelength, and
is the Bragg’s angle of reflection. The size, elemental identification, and morphological characteristics of the ZnO nanoparticles was analyzed using the Phenom® ProX desktop Scanning Electron Microscope (SEM)/Energy Dispersive X-Ray (EDX) machine.
2.4. Formulation and composition of nano-drilling mud
Three samples (,
,
) of nanofluids were prepared by adding 1.0, 1.5, and 2.0 wt.% of zinc oxide nanoparticles in 350 ± 5.0 mL of fresh water. The dispersed nanoparticles were stirred using a Hamilton beach mixer (Model HMD 300) at a speed of 11,000-RPM until zinc oxide nanofluids were obtained. These nanofluids act as the base fluids for the preparation of the drilling mud. 6.5 wt.% of bentonite clay was added to the prepared nanofluid. The suspensions containing the bentonite and nanoparticles were stirred for 5 min using the Hamilton Beach mixer. Lumps adhering to the wall of the cup were integrated to the mud and the stirring was repeated for another 15 min leading to a total stirring time of 20 min after which the nanoparticle-enhanced water-based drilling mud with 6.5 wt.% of bentonite clay was obtained.
2.5. Fluid loss experimentation
The OFITE Low-Pressure Low Temperature (LPLT) filter press was used to determine the fluid loss and mud cake-building properties of the prepared nanoparticle-enhanced drilling mud. The design of the OFITE filter press comprises of a cell body where samples of the prepared drilling mud are held, an inlet for pressure, a base cover for placing filter paper (for low pressure, 3½″ (9.0 cm)) and screen (60 Mesh), and drainage discharge tube for filtrate into a calibrated container. Two timers, one set for 7.5 ± 0.1 min and the second set for 30 ± 0.1 min, were both started and pressure on the cell adjusted at 100 ± 5 psi (690 ± 35 KPa). Both of these steps were concluded in less than 15 s. The pressure was supplied by compressed carbon dioxide, CO2. At 7.5 ± 0.l min on the first timer, the container was removed and any liquid adhering to the drain tube was discarded. The dried 10 cm3 calibrated cylinder was placed beneath the drain tube and the filtrate collected till the completion of the second timer fixed at 30 min.
3. Model development
3.1. Kinetics of mud cake formation
A non-dimensional parameter similar to what was used by Toorman (Citation1997) is used in describing the changes in the concentration of clay particles in a bentonite suspension. The value of the non-dimensional parameter is between 0 (low concentration of bentonite suspension) and 1 (high concentration of bentonite suspension). The concentration of clay particles, , is used as a measure of the number of clay particles in the bentonite suspension at any given time. The non-dimensional parameter,
, is related to the concentration of clay particles at any given time and initial concentration of clay particles,
:
In the absence of shear such as under static filtration where pressure forces are dominant, the rate of diffusion of clay particles to the surface of a mud cake depends on the difference between the maximum concentration of clay particles before the start of filtration, (value of 1) and the concentration of clay particles at any given point in time during the filtration process,
. Hence, the rate of diffusion of clay particles is expressed as:
The rate of clay particle build-up on the mud cake is dependent on the time of consolidation of particles on the mud cake, and concentration of clay particles in the bentonite suspension at any point in time,
. The rate of build-up is expressed as:
The net rate expression is the difference between the rate of diffusion of clay particles to the mud cake surface and that of build-up:
Assuming a first-order rate kinetics for the diffusion and build-up expressions, :
At equilibrium, the rate of diffusion equals the rate of build-up. Therefore, . Simplifying:
. The equilibrium parameter in Equation (8) describes the structural state of the formed mud cake. In other words, it helps describe the state of consolidation of clay particles on the drilling mud cake and steady growth with time.
3.2. Colloidal behaviour of nanoparticles
The theory of colloidal particle behavior in bentonite suspension follows the description of (Gerogiorgis et al., Citation2017). The equation derived by the authors for the maximum inter-particle distance between nanoparticles, , is given in Equation (9):
where is the radius of nanoparticles, and
is the volumefraction of nanoparticles. The dimensionless ratio of nanoparticle size to inter-particle distance,
, of the nanoparticles in a bentonite suspension is expressed in Equation (10):
Equation (10) represents the dimensionless ratio of nanoparticle size to inter-particle distance.
3.3. Fluid loss model for nano-drilling mud
The API fluid loss model describing the static filtration process as described by (Darley & Gray, Citation1988) is given below:
where is the pressure differential,
is the permeability of mud cake,
is the viscosity of the filtrate,
is the volumeof filtrate, A is the area of mud cake,
is the ratio of the volumeof filtrate to a volumeof mud cake, and
is the time. For a given suspension,
and
in Equation (11) is constant with respect to time. According to Vipulanandan et al. (Citation2014), both the permeability of a mud cake,
and the ratio
are functions of time. In order to account for the time variation of
, Equation (12) is proposed as a product of
and
:
The volumeof mud, , is the sum of the volumeof filtrate,
and the volumeof mud cake,
:
The ratio of fraction of solids in the mud cake, to fraction of solids in the mud,
is given by Equation (17):
The time variation in the permeability of the formed mud cake is proposed as a product of the initial permeability of the cake and the non-dimensional structural parameter in Equation (8):
is the initial permeability of the formed mud cake. Equations (13) and (19) express the time dependence of
and
as described by (Vipulanandan et al., Citation2014). Substituting Equations (13) and (19) into Equation (11) yields:
Substituting for in Equation (20) and simplifying:
The fluid loss model incorporating the contribution of nanoparticles becomes:
The maximum fluid loss becomes:
4. Results and discussion
4.1. Characterization of zinc oxide (ZnO) nanoparticles
4.1.1. SEM/EDX analysis of ZnO nanoparticles
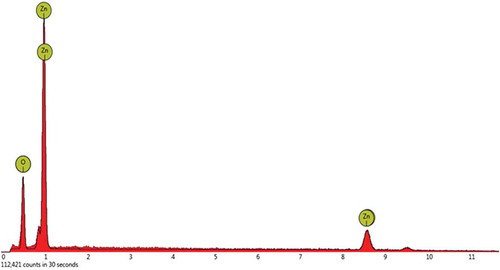
The surface characteristics of the synthesized ZnO nanoparticles was investigated using SEM analysis. SEM images in Figure were obtained at a magnification of 2,000x (30 μm) and clearly shows the spherical nature of the nanoparticles. It also depicts that the ZnO nanoparticles appear as aggregates. The aggregation of the ZnO nanoparticles is due to the high surface area-to-volumeratio of the nanoparticles. Elemental identification analysis using EDX study also established the existence of Zinc Oxide in the synthesized nanoparticles. The elemental composition of the synthesized was Zinc (72.6%) and Oxygen (27.4%). The EDX spectrum of the synthesized nanoparticles is shown in Table and Figure .
Table 1. Elemental identification analysis of the synthesized ZnO nanoparticles
Figure 1. SEM images of the synthesized ZnO nanoparticles.
Figure 2. Elemental identification analysis of the synthesized ZnO nanoparticles using EDX.
4.1.2. XRD analysis of ZnO nanoparticles
The crystallinity of the synthesized ZnO nanoparticles was investigated using XRD. The XRD spectra of the synthesized ZnO nanoparticles ae represented in Figure . The Scherrer equation was used in estimating the size of the ZnO nanoparticles. The various peaks attained at 31.8°, 34.44°, 36.29°, 47.57°, 56.61°, 62.93°, 66.55°, 67.96°, and 69.07°Correspond to the lattice plane of (100), (002), (101), (102), (110), (103), (200), (112), and (201), respectively. This suggests a Face Centred Cubic (FCC) crystal structure for the synthesized ZnO nanoparticles. Table shows the calculated values for the ZnO nanoparticle sizes, which correspond to the various peaks, identified in the XRD spectrum. The average size of the produced ZnO nanoparticles was 14.96 nm.
Table 2. Parameter calculation for the average size of the ZnO nanoparticles
Figure 3. XRD pattern of the synthesized ZnO nanoparticles.
4.2. Fluid loss behaviour of nano-drilling mud
4.2.1. Impact of ZnO nanoparticles on fluid loss of drilling mud
The effect of zinc oxide nanoparticles on the mud cake can be established to reduce the permeability of the drilling mud cake, thereby reducing the fluid loss volume. The high surface area and small size of nanoparticles enable them to form fine dispersions and tight packing structures, thereby effectively filling “fluid flow” gaps that exist between micron-size particles. This phenomenon also applies to the mud cake, which is formed during the static filtration process involving nano-modified drilling fluids. This reduces the mud cake permeability and subsequently fluid loss. The reduction in mud cake permeability by the zinc oxide nanoparticles is due to the plugging capability of the nanoparticles on the mud cake, thereby producing a low permeability medium. The works of Ghanbari, Kazemzadeh, Soleymani, & Naderifar (Citation2016); Ragab & Noah (Citation2014); Yang et al. (Citation2015) have confirmed the plugging capabilities of nanoparticles in rock formations. This reduction in fluid loss can also be due to the alignment of the clay particles in a face-to-face (FF) configuration, which reduced the surface area available for fluid penetration. The presence of the zinc oxide nanoparticles can be explained to cause a disruption in the interaction forces between the clay particles necessitating the rearrangement from face-to-edge (FE) to FF arrangement (Jung et al., Citation2011). The significance of mud cake permeability reduction is critical toward successful drilling operations. This helps to reduce the incidence of pipe sticking during drilling operations. Thus, the use of zinc oxide nanoparticles in a drilling mud leading to a low fluid loss and low permeability cake is desirable. The area of contact between a drill pipe and the filter cake is a function of the depth of burial of the pipe in the cake and, consequently, is a function of the cake thickness. For this reason, the mud cake has to be as thin as possible.
4.2.2. Cumulative fluid loss prediction
The cumulative fluid loss prediction was done using the new fluid loss model in Equation (23). This was fitted to the experimental fluid loss data obtained and a comparison made with the API model. Experimental fluid loss data from four samples containing 1.0 wt.% (), 1.5 wt.% (
), and 2.0 wt.% (
) of zinc oxide nanoparticles dispersed in 6.5 wt.% bentonite mud were used for the model fitting. The model fitting for sample
showed a coefficient of determination value of 0.984 for the API model, while the new fluid loss model was 0.995. Based on the Root Mean Square Error (RMSE), the values obtained were 3.4251 and 2.0255 cm3 for the API and new models, respectively. The new model seems to be the better fit when using the statistical measures. Samples
and
gave the coefficient of determination values of 0.999 and 0.999 for the new model and 0.996 and 0.989 for the API model, respectively. The RMSE values were 0.8549 and 0.4595 cm3 for the new model and 1.7697 and 2.6231 cm3 for the API model, respectively. The new fluid loss model gave a better prediction for samples
and
based on the statistical measures. The new fluid loss model gave a better description of the fluid loss behavior of the nano-drilling mud. This could be explained in terms of the approach used in the derivation of the new fluid loss model. The kinetics of the mud cake formation from the deposition of clay particles and the colloidal behavior of nanoparticles were employed. The API model employs a generalized approach in describing the fluid loss of nano-drilling muds. Quantitative contribution of nanoparticles to fluid loss is not captured by the API model. Plots of the fitted models (API and New Model) to the experimental fluid loss data for the various samples are shown in Figures –.
Figure 4. Cumulative fluid loss prediction using API and new fluid loss model for mud sample containing 1.0 wt.% zinc oxide nanoparticles and 6.5 wt.% bentonite at 25°C and 100 psi.
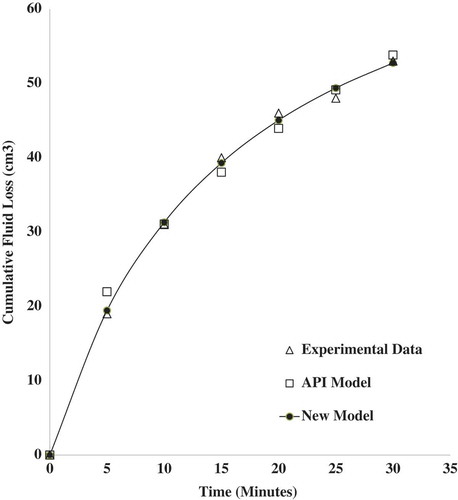
Figure 5. Cumulative fluid loss prediction using API and new fluid loss model for mud sample containing 1.5 wt.% zinc oxide nanoparticles and 6.5 wt.% bentonite at 25°C and 100 psi.
Figure 6. Cumulative fluid loss prediction using API and new fluid loss model for mud sample containing 2.0 wt.% zinc oxide nanoparticles and 6.5 wt.% bentonite at 25°C and 100 psi.
4.2.3. Validating the maximum fluid loss prediction
In order to validate the maximum cumulative fluid loss prediction of Equation (23), a long-term filtration test was carried out using the procedure of Vipulanandan et al. (Citation2014). Filtration time for the long-term test was 500 min. The short-term tests (30 min) have shown that Equation (22) gave a good description of the filtration process based on the various statistical measures employed. The work of Vipulanandan et al. (Citation2014) did not account for nanoparticle effect on fluid loss reduction. Figure shows the predicted and experimental cumulative fluid loss for sample . Beyond the filtration time of 100 min, there is a close convergence between the prediction made by the new fluid loss model and the experimental cumulative fluid loss data. Also, both plots tend to converge to a maximum value as depicted by the formation of a plateau. The close convergence could be explained in two ways. First, the model developed in Equation (22) can predict both short-term filtration tests and long-term filtration tests. Secondly, the experimental cumulative fluid loss and the model prediction tend to reach a plateau or maximum value. This indicates that a maximum fluid loss has been attained. The convergence of the predicted values for the cumulative fluid loss with that of the experimental data also indicates that the effects of fluid loss reduction in the long run was mainly due to nanoparticles. This goes to confirm that the new fluid loss model tends to account for the contributory effect of the nanoparticles on the fluid loss reduction in terms of quantity (
) and size (
). Values of cumulative fluid loss beyond this maximum would remain constant at the same value. This is because there is no more fluid lost as indicated by the flat line obtained for fluid lost in Figure . After 500 min, the experimental cumulative fluid loss obtained was 59 cm3, while the model prediction was 60.58 cm3. The model prediction for the maximum fluid loss was at 61.86 cm3. The coefficient of determination, R
2, for the model fitting for the long-term filtration test was estimated at 94.89%. The bulk of this can be attributed to the short-term filtration test, i.e. below filtration time of 100 min.
Figure 7. The predicted and experimental cumulative fluid loss for sample S2 containing 1.5 wt.% of zinc oxide nanoparticles in 6.5 wt.% bentonite suspension at 25°C and 100 psi.
Figure shows the model prediction for the permeability of the mud cake for sample using Equation (19). The permeability model, just like the fluid loss model derived, can describe the permeability variation of the mud cake both in the short- and long-term filtration process. Long-term fluid loss test indicates that after filtration time of 100 min, the permeability values obtained through model prediction are decrease gradually. The low permeability values during long-term tests depends on the size of the nanoparticles and the amount of nanoparticles. Initial permeability reduction during mud cake build-up is due to the deposition of the micro-size particles present in the bentonite clay. This is often characterized by a rapid reduction in permeability of the mud cake during the filtration process (see Figure , between 0 and 100 min). Further reduction in the permeability of the mud cake would be due to the presence of nanoparticles. Such reduction in permeability is often a slow process due to the small size of the nanoparticles (see Figure , between 100 and 500 min).
Figure 8. The plot of the model prediction for the permeability of the mud cake for sample S2 containing 1.5 wt.% of zinc oxide nanoparticles in 6.5 wt.% bentonite suspension at 25°C and 100 psi.
5. Conclusion
ZnO nanoparticles were synthesized and characterized using XRD, EDX, and SEM. A basic foundational approach was applied in deriving a novel model, which describes the impact of the nanoparticles on the fluid loss of drilling mud during the filtration process. This was done taking into account the kinetics of mud cake formation and colloidal behavior of the nanoparticles. The new model gave a better description of the fluid loss behavior of the nano-drilling mud when compared with the API model using statistical measures.
Nomenclature
|
| = | Initial Concentration or volumeFraction of Clay Particles (dimensionless) |
|
| = | Concentration or volumeFraction of Clay Particles at Time t (dimensionless) |
|
| = | Acceleration due to Gravity, cm/s2 |
|
| = | The Density of Fluid, g/cm3 |
|
| = | volumeFraction of Nanoparticles (dimensionless) |
|
| = | The Radius of Nanoparticles, nm |
|
| = | Hamaker Coefficient or Constant, J |
|
| = | Area of Mud Cake, cm2 |
|
| = | Initial Permeability of Mud Cake, mD |
|
| = | Permeability of Mud Cake, mD |
|
| = | Area of Nanoparticles, cm2 |
|
| = | Mud Cake Thickness, cm |
|
| = | Inter-particle Distance between Nanoparticles, m |
|
| = | The volumeof Nanoparticles, cm3 |
|
| = | The volumeof Fluid, cm3 |
|
| = | The volumeof Mud Cake, cm3 |
|
| = | Non-dimensional Parameter at any Time, t |
|
| = | Non-dimensional Parameter at |
|
| = | Equilibrium Parameter (dimensionless) |
|
| = | Non-dimensional Parameter for Build-Up |
|
| = | Non-dimensional Parameter for rate of diffusion |
|
| = | Van Der Waals Force of Attraction, N |
|
| = | Normal Force due to Hydrostatic Pressure, N |
|
| = | volumedue to Displacement of Fluid, cm3 |
|
| = | Diffusion Exponent (dimensionless) |
|
| = | Diffusion Parameter (dimensionless) |
|
| = | Build-up Constant (dimensionless) |
|
| = | Time, mins |
|
| = | Ratio of Build-up Constant to Diffusion Parameter (dimensionless) |
|
| = | Build-up Exponent (dimensionless) |
|
| = | Dimensionless ratio of nanoparticle size to distance |
Acknowledgements
The management of Covenant University is appreciated by the authors for providing an enabling environment to carry out this research.
Additional information
Funding
Notes on contributors

Richard O. Afolabi
Richard O. Afolabi joined the Department of Petroleum Engineering at Covenant University, Ota, Nigeria as a researcher in August 2014. Prior to this, he worked as an Hourly Paid Lecturer (HPL) in the Department of Applied Science at London South Bank University from which he obtained his Master of Science (M.Sc.) degree in Petroleum Engineering in 2011. He has also worked in the Department of Physics in Kings College, London also as an HPL. Engr. Afolabi’s research interests broadly encompass the development of nanomaterials for application relevant to the oil and gas industry.
Related Research Data
References
- Abdo, J. , & Danish-Haneef, M. (2012). Nano-enhanced drilling fluids: Pioneering approach to overcome uncompromising drilling problems. Journal of Energy Resources Technology , 134, 1–6. doi:10.1115/1.4005244
- Afolabi, R. O. (2017). Modeling the impact of silica nanoparticles on the performance of water-based muds from nigerian bentonite clay (unpublished). Covenant University, Petroleum Engineering. Ota: Covenant University.
- Darley, H. C. , & Gray, G. R. (1988). Composition and properties of drilling and completion fluids (5th ed.). Houston-Texas: Gulf Professional Publishing.
- Gerogiorgis, D. I. , Reilly, S. , Vryzas, Z. , & Kelessidis, V. C. (2017). Experimentally validated first-principles multivariate modeling for rheological study and design of complex drilling nanofluid systems . SPE/IADC Drilling Conference and Exhibition (pp. 1–11). Hague: Society of Petroleum Engineers.
- Ghanbari, S. , Kazemzadeh, E. , Soleymani, M. , & Naderifar, A. (2016). A facile method for synthesis and dispersion of silica nanoparticles in water-based drilling fluid. Colloid and Polymer Science , 294(2), 381–388. doi:10.1007/s00396-015-3794-2
- Hoelscher, K. P. , Stefano, G. , Riley, M. , & Young, S. (2012). Application of nanotechnology in drilling fluids . SPE International Oilfield Nanotechnology Conference (pp. 1–7). Noordwijk: Society of Petroleum Engineers.
- Ismail, A. R. , Aftab, A. , Ibupoto, Z. H. , & Zolkifile, N. (2016). The Novel approach for the enhancement of rheological properties of water-based drilling fluids using multi-walled carbon nanotubes, nanosilica, and glass beads. Journal of Petroleum Science and Engineering , 139, 264–275. doi:10.1016/j.petrol.2016.01.036
- Jung, Y. , Barry, M. , Lee, J.-K. , Tran, P. , Soong, Y. , Martello, D. , & Chyu, M. (2011). Effect of nanoparticle-additives on the rheological properties of clay based fluids at high temperature and pressure. National Technical Conference and Exhibition (pp. 1–4). Houston, Texas: American Association of Drilling Engineers.
- Mahmoud, O. , Nasr El-Din, H. , Vryzas, Z. , & Kelessidis, V. (2016). Nanoparticle-based drilling fluids for minimizing formation damage in HP/HT applications. SPE International Conference and Exhibition on Formation Damage and Control (pp. 1–26). Louisiana: Society of Petroleum Engineers.
- Ragab, A. M. , & Noah, A. (2014). Reduction of formation damage and fluid loss using nano-sized silica drilling fluids. Petroleum Technology Development Journal , 2, 75–88.
- Reilly, S. , Vryzas, Z. , Kelessidis, V. C. , & Gerogiorgis, D. I. (2016). First principles rheological modelling and parameter estimation for nanoparticle-based smart drilling fluids. European Symposium on Computer Aided Process Engineering (pp. 1–6). Portoroz: Elsevier B. V.
- ShamsiJazeyi, H. , Miller, C. A. , Wong, M. S. , Tour, J. M. , & Verduzco, R. (2014). Polymer-coated nanoparticles for enhanced oil recovery. Journal of Applied Polymer Science , 131(15), 1–13. doi:10.1002/app.40576
- Toorman, E. A. (1997). Modeling the thixotropic behaviour of dense cohesive sediment suspensions. Rheologica Acta , 36(1), 56–65. doi:10.1007/BF00366724
- Vipulanandan, C. , Raheem, A. , Basirat, B. , & Mohammed, A. S. (2014). New kinetic model to characterize the filter cake formation and fluid loss in HPHT process. Offshore Technology Conference (pp. 1–17). Houston-Texas: Society of Petroleum Engineers.
- Vryzas, Z. , & Kelessidis, V. C. (2017). Nano-based drilling fluids: A review. Energies , 10, 1–34. doi:10.3390/en10040540
- Yang, X. , Yue, Y. , Cai, J. , Liu, Y. , & Wu, X. (2015). Experimental study and stabilization mechanisms of silica nanoparticles based brine mud with high-temperature resistance for horizontal shale gas wells. Journal of Nanomaterials , 2015, 1–10.