
 ?Mathematical formulae have been encoded as MathML and are displayed in this HTML version using MathJax in order to improve their display. Uncheck the box to turn MathJax off. This feature requires Javascript. Click on a formula to zoom.
Abstract
The paper shows the findings of fire simulation for various types of vehicles located in different longitudinal positions within a road tunnel. This is an issue that researchers have little investigated over time and so very few studies are available in the literature. The corresponding environmental conditions (expressed in terms of temperature, radiant heat flux, visibility, and CO concentration) along the people evacuation path are also presented, while the associated safety conditions with and without emergency exits are estimated.
Computational Fluid Dynamic (CFD) modelling showed for the burning vehicle, which was located half way along the tunnel, higher temperatures compared to the position at one-fourth of the tunnel length (L). However, the environmental conditions along the escape route were found to be worse when the fire source was at 1/4 L compared to that at 1/2 L, since the evacuation time was higher due to the longer distance to the exit portal. Irritant smoke compared to non-irritant smoke caused a greater negative effect on the safety of the people. No significant difference between a curved tunnel compared to a straight one was found, while with 2% longitudinal slope, inducing the chimney effect, less severe conditions on people safety along the evacuation path were found. The advantages of providing the tunnel with emergency exits were also shown, and their optimal distance was identified.
The analysis developed in this paper applied to different positions of various burning vehicles, and combinations of traffic and geometry set out to increase our knowledge on safety in road tunnels.
PUBLIC INTEREST STATEMENT
The catastrophic tunnel fires having occurred in Europe over the last few years have generated a strong public interest that has led authorities, management agencies, engineers, and researchers to become much more involved in the safety of tunnel occupants. Fire effects on tunnel structure, equipment, and environmental conditions along the people evacuation paths are some of the major concerns. With reference to the self-rescue people, researchers have studied different aspects of this topic from evacuation plans in accordance with fire brigade departments, as well as through computer simulations for assessing the influence of different parameters. We decided to investigate a key question that is seldom examined in the literature, namely, the consequences due to different positions of burning vehicles in a tunnel with and without emergency exits. We not only present, discuss, and compare the results obtained but also provide both practical information for the design of emergency exits and addresses for future research.
Competing Interests
The author declares no competing interest.
1. Introduction
1.1. Physical features
The consequences of road tunnel fires are a major driving motivation for researchers to investigate the issue of people evacuation in greater depth. Fire effects on environmental conditions along the people evacuation path are closely related to the type of burning vehicle (i.e., to the heat release rate). The effects of a fire source also depend on the location of the burning vehicle in the tunnel; but since this topic is scarcely ever investigated in the literature, it needs to be discussed in further detail. It is also to be mentioned that the geometry of a tunnel (i.e., the length, width, height, and shape of the cross-section, as well as the horizontal and vertical alignments) may affect the propagation of hot gases and smoke along the tunnel during the fire in different ways.
Indeed, the possible consequences of a tunnel fire may be more dangerous when the tunnel begins to fill with vehicles at the time of the onset of the fire; given that the presence of many vehicles, acting as obstacles, makes the environmental conditions within the tunnel much worse. Moreover, a sort of domino effect of spreading the fire from the first burning vehicle to other vehicles might also contribute towards causing a series of unpredictable events.
Finally, the fire could be even much worse in a bi-directional than in a one-way tunnel, because it may cause the formation of traffic queues for each travelling direction, making it impossible for the emergency vehicles to enter the tunnel from both portals.
Such then is the context wherein the present work is set. The paper investigates a range of different positions of various burning vehicles within a road tunnel, under many combinations of traffic and geometry, in order to provide additional knowledge on tunnel safety.
1.2. Fluid dynamic modelling
Because tunnel fires involve very complex phenomena that are caused by the mutual interactions between physical and chemical processes, CFD simulations were used to describe a fire’s behaviour and to quantify its impacts. According to the available literature, CFD modelling has been preferentially used for making comparisons among the effects of various fire scenarios and assessing mitigation measures for the self-rescue of tunnel occupants. In this respect, many studies investigated the performance of current technologies (Betta, Cascetta, Musto, & Rotondo, Citation2010; Caliendo, Ciambelli, De Guglielmo, Meo, & Russo, Citation2012a; Ciambelli, Meo, Russo, & Vaccaro, Citation2006, Citation2007, Citation2011; Colella, Rein, Borchiellini, & Torero, Citation2011; Colella, Rein, Carvel, Reszka, & Torero, Citation2010b; Colella, Rein, Carvel, & Torero, Citation2010a; Kashef, Saber, & Gao, Citation2009; Li & Chow, Citation2003; Lin & Chuah, Citation2008; Tuovinen, Holmstedt, & Bengtson, Citation1994; Van Maele & Merci, Citation2008; Wang, Citation2009; Woodburn & Britter, Citation1996; Wu & Bakar, Citation2000; Yoon, Rie, & Kim, Citation2009), while a fewer group examined the innovative ones (Domenichini, La Torre, Vangi, Virga, & Brazzi, Citation2017; Hu, Zhou, Huo, Peng, & Wang, Citation2008; Miles, Kumar, & Chong, Citation2002; Nmira, Consalvi, Kaiss, Fernandez-Pellob, & Porterie, Citation2009) for fire mitigation in a road tunnel. However, most studies assumed a single design fire, while only few (Caliendo, Ciambelli, De Guglielmo, Meo, & Russo, Citation2013; Li & Chow, Citation2003; Tuovinen et al., Citation1994; Yoon et al., Citation2009) compared scenarios relevant to different type of burning vehicles and much rarely did they also consider the presence of other vehicles.
It is to be stressed that the above-cited studies, including also those written by the authors of the present paper, have seldom investigated the effects of fire due to different longitudinal positions of burning vehicles within the tunnel, which is one of the main aims of this article.
1.3. Human behaviour
During the evacuation process from a tunnel under emergency conditions, human behaviour is mostly related to the time to react and leave the vehicle while moving in a specific direction. According to the literature (Papaioannou & Georgiou, Citation2008; Persson, Citation2002; PIARC, Citation1999; Purser, Citation2011), it is assumed that the time required to escape (evacuation time) may be generally divided into three phases, namely, the detection time, the reaction time, and the travel time. Regarding the above times, different human types of behaviour could be observed during emergency. Moreover, the interactions between tunnel occupants play a significant role in the evacuation process, as human behaviour can be affected by other people regarding the decision to leave the vehicle and regarding the way to escape. Generally, two types of interacting groups are assumed to be formed (Ronchi et al., Citation2012), namely, “emerging groups” and “established groups.” The former may arise and dissolve naturally during an emergency, while the latter, which is formed by the family or friends, is characterized by their staying together and ensuring that each member evacuates under safe conditions. In this last case, the evacuation time is the same for the whole group, but the walking speed is geared to that of the slowest user.
1.4. Evacuation modelling
Several simulation models are nowadays available as tools for investigating the people evacuation process in the case of an emergency event inside a tunnel. These may be categorised on the basis of the sophistication they assume in order to calculate the evacuation time (Kuligowski & Peacock, Citation2005). The three main categories are behavioural models, movement models, and partial behaviour models. Behavioural models include occupants performing actions, decision-making processes, and reactions due to the environmental conditions. Movement models move occupants from one point to another (a safe place). Partial behaviour models calculate occupant’s movement but implicitly reproduce the occupant’s behaviour. Examples of models based on the aforementioned description are FDS + EVAC, STEPS (Simulation of Transient Evacuation and Pedestrian Movements), and Pathfinder (Ronchi et al., Citation2012). In particular, STEPS is an agent-based model in which the movement towards the exits is calculated through a potential map divided into several cells. This model permits the user to implement random parameters regarding pre-evacuation times and walking speeds. Moreover, it allows importing smoke and combustion gas data from fire models (e.g., the CFD model in our case) in order to consider the fire effects on the occupant’s movement and safety. According to the literature, applications of tunnel evacuation models are found in Yang, Peng, Zhang, and Yong-Lin (Citation2006a); Yang et al. (Citation2006b); Liu, Apte, Luong, Liu, and Yung (Citation2007); Kretz, Mayer, and Muehlberger (Citation2010); Ronchi et al. (Citation2012); Caliendo, Ciambelli, De Guglielmo, Meo, and Russo (Citation2012b); and Ronchi (Citation2013).
However, it is to be said that in the aforementioned papers, the evacuation of people was assumed to occur more especially in the directions of portals; in other words, the effects of providing the tunnel of emergency exits along the evacuation path appear to have hitherto been investigated to a lesser degree. Therefore, the second purpose of this paper is to investigate the effectiveness of emergency exits in road tunnels.
1.5. Distance between emergency exits
According to the European Directive 2004/54/EC, in new tunnels, emergency exits shall be provided where the traffic volumeis greater than 2000 vehicles/day per lane. In the existing tunnels longer than 1,000 m, with a traffic volumehigher than 2,000 vehicle/day per lane, the feasibility and effectiveness of the implementation of new emergency exits shall be evaluated case by case. Where emergency exits are provided, the distance between two emergency exits shall not exceed 500 m. The Italian Ministry of Infrastructure and Transport (MIT, Citation2006) adopted the aforementioned directive and with reference to the emergency exits confirmed the aforementioned specifications on distance for new or existing tunnels. However, Italian legislation has added that for existing tunnels, the need for emergency exits (if absent) shall be evaluated by means of an appropriate risk analysis. Subsequently, the Italian Management Agency of National Roads and Motorways (ANAS) published in (Citation2009) specific guidelines for the safety design of Italian road tunnels. With regard to emergency exits, it is assumed on the contrary that the distance between two emergency exits shall not exceed 300 m. Also in these guidelines, a risk analysis is envisaged. A summary of the worldwide application of risk methodologies for road tunnels and details about the methods used in several countries is reported in PIARC (Citation2008), and applications of quantitative risk analysis, the use of which is not within the scope of this paper, can be found, for example, in Zhou et al. (Citation2014) and more recently in Caliendo and De Guglielmo (Citation2016, Citation2017a and Citation2017b). In this context of the discrepancy in Italy between MIT and ANAS concerning the maximum distance between emergency exits, a methodology based on the above-cited evacuation modelling rather than on the risk analysis (for supporting the choice of the emergency exits) appears to be appropriate in this paper. As a logical consequence, the third purpose of the present manuscript is to find the optimal distance between the emergency exits by using the results of evacuation modelling.
1.6. Reasons and structure of paper
In the light of the above considerations, there is evidence that the combined effects of various burning vehicles, fire locations, tunnel geometry, traffic, and emergency exits need to be investigated in greater depth for transportation safety in road tunnels. In particular, the paper evaluates the effect of fire positions in the case of different burning vehicles, on the evacuation of people in a specific bi-directional road tunnel, longer than 1,000 m. For this aim, CFD modelling is applied a priori. Then, the evacuation modelling is set up for evaluating the effects on people. Finally, the advantages of emergency exits are evaluated and a criterion of choice about their distances is defined. Therefore, the present paper can provide a significant contribution to the state of the art by showing the effects of combined variables both on the consequences of fire on equipment (and/or tunnel structure) and on the people evacuation process.
The paper is organized as follows. Section 2 contains a literature review concerning more, especially an approach generally used for estimating the people safety conditions. Section 3 shows the various fire scenarios investigated. Sections 4 and 5 present the CFD model and evacuation model, respectively, with the corresponding results and comparisons. Section 6 summarises the findings and reports the conclusions with directions for future research.
2. Literature review
In the field of fire safety engineering, people safety during evacuation is generally investigated by comparing the available safe egress time (ASET) and the required safe egress time (RSET). Nowadays, the ASET is formally defined as the time available between fire ignition and the time at which tenability criteria are exceeded, while the RSET is defined as the period between the outbreak of the fire and the time when a place of safety is reached. In order to guarantee an acceptable margin of safety, the RSET should be shorter than the ASET (CFPA, Citation2009; ISO, Citation1999, Citation2009; SFPE, Citation2008; Shields, Citation2005).
As far as we know, the first definition of RSET is generally attributed to Pauls (Citation1980), who introduced and explained RSET as sum of detection time, reaction time, and travel time.
Cooper (Citation1982, Citation1983) presented a general methodology for computing ASET. He defined ASET as the time interval separating two times: the time at which the user-defined hazardous conditions are reached (t HAZ) and the time at which the condition of detection causes the state of alarm (t DET).
Cooper and Stroup (Citation1982) also wrote a fire modelling software in FORTRAN for evaluating ASET, based on a smoke-filling model (NIST Website, Citation2016).
A few years later, Sime (Citation1986) proposed a revised RSET equation for highlighting that people are not inanimate objects and they do not start their escape immediately. In particular, the author considered it significant by underlining the presence in RSET of a perceived time available (PTA), as a psychological concept for taking into account the time to interpret and respond to initial changes in the social and physical environment caused by a fire.
After introducing RSET and ASET, their comparison appeared appropriate to researchers for evaluating the safety conditions of a project or an existing structure. Obviously, an acceptable safety condition was ASET greater than RSET, and their difference came to be a safety margin (SM = ASET − RSET). In this respect, Shields, Silcock, and Dunlop (Citation1992) introduced, for example, a safety index (SI) defined as follows: SI = SM/RSET.
Purser (Citation2003a) showed that in RSET and ASET, there are some aspects that are reasonably well quantified, while others are oversimplified. In particular, the author suggested paying more attention to (1) pre-movement time, in terms of the distribution of values measured from monitored evacuations; (2) travel time, whether occupants are exposed to irritant smoke; and (3) time-concentration curves for predicting ASET times. Thus, he proposed (Purser, Citation2003b) that the complex qualitative aspects of occupant behaviour may be simplified into a small number of key features, which might prove helpful for identifying a set of design behavioural scenarios.
Hall (Citation2004) investigated circumstances that might increase ASET and reduce RSET by preventing fire rather than mitigating its effects.
Prolux (Citation2006) formalized RSET and ASET (and their comparison as SM) starting from ignition both for time necessary for escaping and for time available.
Chu, Chen, Sun, and Sun (Citation2007) introduced a probabilistic approach for taking into account the uncertainties due to time dependence of fire scenarios. In particular, in RSET, the occupant pre-movement time was considered to be characterized by normal distribution and the ASET value was considered as a probability density distribution function.
Fleischmann (Citation2009) showed the need to give to this ASET/RSET approach the status of a quantitative guidance for saving lives from fires.
Babrauskas et al. (Citation2010) argued that the ASET/RSET ratio is a flawed concept, as it appears to ignore the wide range of both physical and psychological conditions of people who need to escape. Moreover, the wide range of scenarios that a single fire could develop appears to be undervalued. Chow (Citation2011) argued a revised SI (SIm = SM/ASET) to reduce the influence of human behaviour in RSET.
Chu and Wang (Citation2011) presented a probabilistic approach for ASET and RSET. ASET and RSET were considered as two dependent random variables in function of fire dynamics and human behaviour uncertainties.
However, it is to be said that the aforementioned literature concerning the description of ASET and RSET with appropriate comparisons between them was developed to assess the safety conditions of the evacuation process from a building in the event of fire. These parameters have been subsequently adapted and applied also to road tunnels. However, as far as we know, only few papers appear to be hitherto available on the strengths and weaknesses of the application of RSET and ASET for road tunnels, as well as on the interactions between the values of these parameters and the presence of emergency exits, an argument which is of interest in our article.
Liu et al. (Citation2007), for example, in their study regarding a unidirectional tunnel (length 2.3 km) with two tubes and a longitudinal ventilation system, investigated both the RSET/ASET and the emergency exits which were 120 m spaced. The fire location was in mid-tunnel and near an emergency exit so that the users have to travel at least 120 m for trying to save themselves. The authors used CFD modelling to predict smoke spread and considered a 10-m visibility criterion to calculate tenability time (ASET). In egress modelling, RSET was considered as sum of the queue time (300 s), response time (180 s), and travel time (with 0.8 m/s as average travel speed). The results showed that for two scenarios (namely, those with fast growing fires), several users had not enough time to escape because of the quick untenable condition (RSET ≫ ASET). In this respect, the authors suggested to use a fire suppression system to control a rapid growth of fire.
Caliendo et al. (Citation2012b), as previously mentioned, used STEPS associated with a CFD model for simulating a Heavy Goods Vehicles (HGV) fire (HRRmax = 50 MW) placed at the middle length of a curved bi-directional road tunnel (about 1.2 km long). They found that, in the absence of emergency exits, the comparison between the ASET and RSET showed that lethal conditions may occur, in particular for scenarios without an alarm system.
Ronchi et al. (Citation2012), comparing three evacuation models (FDS + EVAC, STEPS, Pathfinder), concluded that their differences may be affected by (1) the modelling method, (2) the depth degree of the analysis of fire conditions, and (3) the user’s experience in applying appropriate safety factors when using only one model.
Valasek and Glasa (Citation2013), with reference to a short two-lane tunnel with an emergency exit and longitudinal ventilation system, used the FDS + EVAC model. A HRRmax of 10 MW was reached 55 s after fire ignition in two fire scenarios with two different numbers of vehicles and users. The results (not in terms of RSET and ASET) showed that most agents knew the portal as a safe exit and, in emergency conditions, tried to escape through it. The emergency exit might not be seen by users because of the dense smoke and the obstruction due to stopped vehicles.
Glasa, Valasek, Halada, and Weisenpacher (Citation2014), subsequently, analysed the behaviour of single and group of evacuees, finding that the implementation of emergency exits in the simulation process had to take into account their visibility for avoiding misunderstanding of simulation inputs.
Pribyl and Pribyl (Citation2014) provided a discussion about technological systems in road tunnels and their effect on the overall time needed for people to escape from a fire.
With regard to the ASET calculation, it was frequently determined simply by calculating the time when untenable conditions in terms of visibility, temperature, or concentrations values are reached at specified locations (Liu et al., Citation2007; Yuan, Fang, Tang, & Sun, Citation2011; Qu & Chow, Citation2013).
However, an alternative and more complex approach may consider the actual path that a person is travelling while exposed to danger: by comparing the accumulated dose absorbed and the effective dose to cause danger, the factional effective dose (FED) is calculated (Europe, Citation2009; SFPE, Citation2008).
The above short chronological presentation of the literature shows that only few studies with ASET/RSET approach are available for tunnels, and these are focused more specifically on specific factors that may influence the evacuation from road tunnels in the event of fire. A wider assessment that contemporaneously combines various variables which appear to play a main role in influencing the people evacuation process from a road tunnel (i.e., position and type of burning vehicle, characteristics of traffic and geometry, presence or absence of emergency exits, and their distance) does not appear to have been sufficiently investigated. Thus, this paper focuses on all these factors at the same time.
3. Fire and evacuation scenarios
The existing tunnel taken as a reference is the Varano tunnel, located in Southern Italy along a rural two-lane road (S.S.145). The tunnel is bi-directional, curved, sloping (2% upward), and some 1.2 km long, 10.5 m wide, and 5.5 m high, with an annual average daily traffic of more than 10,000 vehicles per day for each traffic direction.
The tunnel has neither emergency lanes nor emergency exits for people. However, it is equipped with one lay-by for each traffic direction. In compliance with the European Directive 2004/54/EC, and according to the Italian Ministry of Infrastructures and Transports (Citation2006), the tunnel has been equipped with a longitudinal ventilation system that will be able to provide efficient forced airflow. Such a ventilation system is constituted by eight pairs of ceiling axial jet fans 90 m spaced along tunnel length. In ordinary traffic conditions, the first pair of fans is active, while in the case of fire emergency, all fans are activated. The emergency ventilation system is assumed to be activated by a linear heat detection system when the temperature exceeds 68°C. More details on tunnel geometry, equipment, as well as on traffic flow can be found in Caliendo et al. (Citation2012a, Citation2013).
Several fire scenarios with different burning vehicles (e.g., two cars, a bus, a heavy goods vehicle, and a petrol tanker) and fire positions along the tunnel (at one-fourth and half of the tunnel length) were assumed. The assumptions made for the fire sources were based on literature data, as follows: (1) geometrical features of the burning vehicles as in a previous work (Caliendo et al., Citation2013), (2) maximum heat release rate (HRRmax) and duration of the fire growth phase t max hypothesized on the basis of design fires given in the literature (ANAS, Citation2009; FIT, Citation2005), and (3) yields of soot and toxic gases (CO2 and CO) generated by the fire as well as smoke optical properties, on the basis of literature data (FIT-European Thematic Network Fire in Tunnels, Citation2005; SFPE, Citation2008; Steinert, Citation1994). The impact of two tunnel geometrical features was also assessed, specifically the horizontal and the vertical alignments. Fire and egress simulations were performed also assuming different alignments, that is, a straight tunnel other than the existing curved one, and a flat tunnel other than the real sloping one.
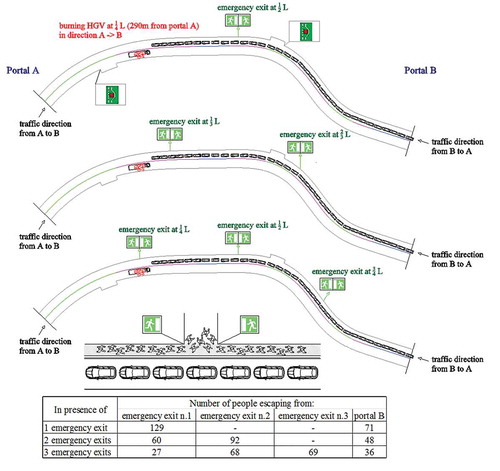
It was assumed that accidents obstructed the transit to cars and people over the entire tunnel section. Other cars queued and stopped without overtaking the burning vehicle, the first car in the queues at a distance of 10 m from it, and each car maintaining a distance of about 2 m from the preceding vehicle, causing traffic jams on each fire side up to the tunnel portals. Early transient flow of cars was assumed, lasting approximately 5 min when the burning vehicle is at the tunnel centre and 8 min when it is at a quarter of the tunnel length, respectively. When the fire position is at half of the tunnel length (halfway along the tunnel), traffic jams were formed by 78 cars on both fire sides. On the other hand, when the fire is located at one-fourth of the tunnel length, 38 and 118 cars queued upstream and downstream the fire, respectively.
During evacuation persons were assumed to leave their cars and turn back away from the fire, walking on tunnel sidewalks towards the tunnel portal upstream or downstream the fire. The cars occupancy rate was assumed to be on average equal to 1.7 people for Italy, according to the European Environment Agency (EEA, Citation2010). This determines that in the case of a fire located at half of the tunnel length, 132 persons escape downstream the fire, while when the fire was at one-fourth of the tunnel length, 200 persons escape downstream the fire. It is to be said that performing a study based on different numbers of passengers per car is not within the scope of this paper, although it is an argument might become object of our future investigations.
In the event of the HGV fire scenarios, which may be deemed the most dangerous in terms of the combination of probability of occurrence and severity of physical harm, the egress process was simulated by STEPS evacuation model (Mott MacDonald, Citation2015) by considering
two behavioural relationships for people (unrelated persons or family/friends groups);
two approaches for the pre-movement time (according to a normal distribution or related to an audio alarm system);
two types of fire-induced smoke (irritant smoke or non-irritant smoke).
For the scenario identified as the most dangerous for people evacuation (i.e., fire at one-fourth of the tunnel length, curved tunnel, 2% upward sloping tunnel, relationships for people in queued cars, pre-movement time modelled by a normal distribution, irritant fire-induced smoke), an in-depth comparison among evacuation processes in the event of fires of the four burning vehicles (i.e., two cars, bus, HGV, tanker) was also performed.
Finally, attention was focused on the achievable improvements in safety performance which could ensue from the presence of emergency exits along the tunnel.
Regarding the influence of emergency exits (assumed 120 cm wide) on safe evacuation, three arrangements were evaluated: (1) a single emergency exit, located at the centre of the tunnel length; (2) two emergency exits, located at one-third and at two-thirds of the tunnel length, in compliance with the European and the Italian Directives; and (3) three emergency exits, located at one-fourth, half, and three-fourth of the tunnel length, in compliance with the national road guidelines (ANAS, Citation2009).
Evacuation conditions along the egress path towards the tunnel exits were evaluated in terms of the RSET and compared to the ASET.
4. CFD modelling
4.1. Physical models and simulation settings
The CFX Code (ANSYS, Citation2015) uses the finite volumetechnique for solving the Navier–Stokes equations for momentum, heat, and mass transfer. Turbulence was modelled by the RNG k − ε model in order to take into account the gross effects of buoyancy on turbulent mixing. The wall function approach was used for the near-wall regions, to describe the turbulent boundary adjacent to solid objects. Combustion was modelled as a volumetric heat source. A mass source was also assumed for considering the production of smoke (soot) and toxic gases (CO, CO2). The multiphase system made of soot particles (smoke) in the gas phase was modelled by the Eulerian approach. The Discrete Transfer radiation model was adopted using correlations for absorption coefficients for combustion gases and smoke.
The first-order upwind advection scheme for the space discretization and the backward Eulerian transient scheme for the time discretization of convective and pressure terms were used. Convergence criteria were residuals lower than 10−4.
An unstructured and non-uniform mesh based on tetrahedral cells was used. The mesh was refined in the vicinity of the fire, in the proximity of fans and vehicles, and the automatic grid adaptation technique gradually coarsened the mesh length scale for each successive element away from the fire region.
4.2. Model validation and sensitivity analysis
The model was previously validated by comparing the simulation results with experimental data of fire in a laboratory scale tunnel and in the presence of longitudinal ventilation, as reported by Xue, Ho, and Cheng (Citation2001). Overall results (Ciambelli et al., Citation2011; Meo, Citation2009) showed that the experimental fire-induced temperature profiles and airflow were predicted with fairly close agreement, especially downstream the fire.
A grid sensitivity analysis was also performed to select the proper grid size for the case under investigation, as reported by Caliendo et al. (Citation2012a, Citation2013).
The initial ambient temperature was set equal to 20°C. Longitudinal ventilation with average air velocity of 2–2.5 m/s, resulting from the activation of the first pairs of jet fans, was set as initial condition. As wall boundaries, concrete walls of 50 cm in thickness were considered with thermal conductivity of 1.67 W/m K (Schrefler, Brunello, Gawin, Majorana, & Pesavento, Citation2002).
4.3. Analysis and comparison of results
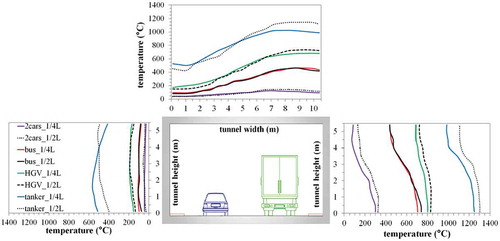
The fire location that gives rise to the most serious outcomes for tunnel structure was previously identified in the case of HGV as the one in the centre of the driving lane and half way along the tunnel length (Caliendo et al., Citation2012a). In order to assess whether this is the case for the four fire scenarios (i.e., two cars, bus, HGV, and tanker), in Figure , we compare the maximum temperatures reached at tunnel walls and ceiling, at different position of tunnel length (i.e., 1/4 L and 1/2 L). Maximum values are reached at the tunnel wall in the vehicle-driving lane. When the burning vehicle is halfway along the tunnel length, higher temperatures are predicted at both ceiling and wall with respect to position at one-fourth of the tunnel length. This confirms that maximum wall temperatures are achieved when the burning vehicle is at mid-tunnel. This might be attributed to a minor reduction in gas cooling effect for the major distance from portals where there are fresh-air conditions. Moreover, as expected, the greatest temperatures are reached by the tanker fire, followed by HGV, bus, and two-car fires according to the HRR peak values of different vehicles (i.e., two cars: 8 MW, bus: 30 MW, HGV: 50 MW and tanker: 100 MW). The major temperatures computed at 1/2 L prove that when the fire occurs in this position, higher negative effects on tunnel structure and equipment are expected.
Figure 1. Maximum gas temperatures at tunnel ceiling and at side walls for two cars, bus, HGV, and petrol tanker fire scenarios in the presence of traffic, in the cases of burning vehicle located either at one-fourth or at half of the tunnel length.
The effect of fire location on the environmental conditions determined along the escape route was then evaluated. In Figure , on the left side, the longitudinal temperature profiles predicted at 2 m height along the escape route in the event of burning vehicles, located either at 1/4 or at 1/2 L, are reported at three times from the fire outbreak (t = 5, 7, and 10 min). The results are compared with the safety temperature of 80°C, that is, the tolerable maximum temperature for 15 min exposure during a tunnel fire according to PIARC (Citation1999).
Figure 2. Longitudinal profiles of gas temperature (on the left) and radiant heat flux (on the right) at 2 m height along the tunnel sidewalk for fire scenarios in the presence of traffic in the cases of burning vehicle located either at one-fourth or at half of the tunnel length: (a, d) t = 5 min, (b, e) t = 7 min, and (c, f) t = 10 min.
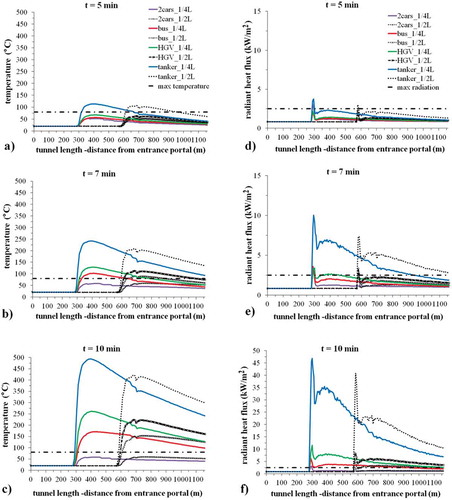
When the burning vehicle is placed at one-fourth of the tunnel length, the safety temperature is exceeded at a downwind distance from the fire centre 5–10 m shorter when compared with that of fire at the tunnel midpoint. Specifically, at t = 5 min (Figure )), the tenability limit along the egress sidewalk is reached only in the event of the tanker fire. In particular, when the tanker is located at one-fourth of the tunnel length, safety conditions occur from the portal along a tunnel portion about 520 m long, which is reduced to 220 m when the tanker is at half way along the tunnel. At t = 7 min (Figure 2(b)), dangerous temperatures are predicted in all fire scenarios (i.e., tanker, HGV, and bus) except for the two cars. Tanker fires generated unsafe conditions from the fire centre up to the tunnel exit portal. On the contrary, bus and HGV fires assure tenable conditions up to a distance from the fire centre of 295 m (bus at one-fourth of the tunnel length), 265 m (bus at tunnel midpoint), 455 m (HGV at one-fourth of the tunnel length), and 485 m (HGV at tunnel midpoint), respectively. Finally, during fully developed fire phases (t ≥ 10 min, Figure )), unsafe conditions are predicted throughout the tunnel length up to the exit portal for all fire scenarios (except the two cars) and for both distances of fire centre from the exit portal.
It may be argued that the observed differences between the longitudinal spread of gas temperatures, which are predicted when the burning vehicle is located at 1/4 L and 1/2 L, are related to the differences in gas velocity, which in turn are related to the different pressure drop in the portion of tunnel downwind the fire. Specifically, greater is the length of tunnel downwind the fire and the number of cars in the traffic jam, higher is the pressure drop, lower is the gas velocity, and higher is the gas temperature. Similar considerations can be made for the other variables reported in Figures and .
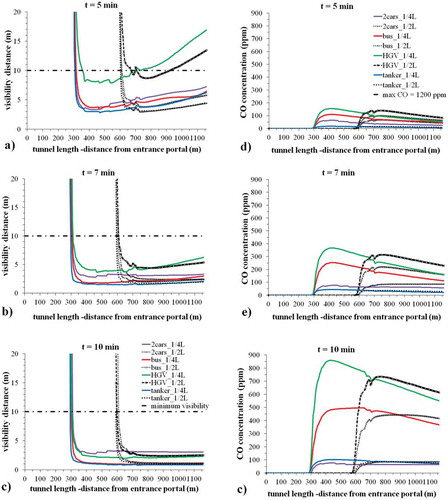
Figure 3. Longitudinal profiles of visibility distance and CO concentration at 2 m height along the tunnel sidewalk for fire scenarios in the presence of traffic in the cases of burning vehicle located either at one-fourth or at half of the tunnel length: (a, d) t = 5 min, (b, e) t = 7 min, (c, f) t = 10 min.
The profiles of radiation heat flux along the evacuation path for all the burning vehicles located either at one-fourth or at half of the tunnel length are also reported on right side of Figure . Also in this case, the peak values of radiation heat flux were predicted at a shorter distance from the burning vehicle in the event of fires at one-fourth of the tunnel length compared with fires at 1/2 L (about 10–15 m downstream the fire). Regarding the safe conditions, the maximum radiation heat flux (2.5 kW/m2, according to PIARC, Citation1999) was reached only in the case of tanker fire, in particular in proximity of the vehicle at 5 min, and along the entire evacuation path at 7 min. At t = 10 min, when fires are fully developed, unsafe conditions for the whole egress route are reached in all fire scenarios (i.e., tanker, HGV, and bus) except for the two cars.
As regards the longitudinal profile of smoke and toxics, when the burning vehicles are placed at one-fourth of the tunnel length, larger concentrations of emissions occurred, compared with the values generated by fires at mid-tunnel (half of the tunnel length). Consequently, the visibility distance (on the left side of Figure ) was more reduced when the burning vehicles are at 1/4 L than 1/2 L. It is to be stressed that, during the fire, visibility was higher than the safe value of 10 m (Ingason, Citation2008), only close to the burning vehicle for all the scenarios (i.e., up to a distance of 30 m).
This means that unsafe conditions due to the scarce visibility to discern signs might be expected.
With reference to the longitudinal profile of CO (on the right side of Figure ) and CO2 concentrations, the predicted values always remain well below safety limits (IDHL is 1,200 ppm for CO and 40,000 ppm for CO2, respectively, as reported, e.g., by Europe, Citation2009), thus not posing an immediately dangerous threat to life or health of evacuees.
In the light of the above outcomes and considerations, the effects of fire location on the environmental conditions along the escape route of people appear to be worse for the fire source at 1/4 L rather than at 1/2 L.
5. Evacuation modelling
5.1. Simulation settings
The STEPS model (Mott MacDonald, Citation2015) was used to model evacuation from the tunnel. In a preliminary study, the STEPS model was validated by the authors using experimental data of evacuation tests carried out in one of the tubes of the Benelux tunnel in Rotterdam as reported by Norén and Winér (Citation2003). The results of sensitivity analysis of numerical parameters (i.e., time step and grid size), which are not reported in the present paper for the sake of clarity, were subsequently used to set the values implemented for the case here analysed. More details concerning the sensitivity study can be found in Caliendo et al. (Citation2012b).
In this work, evacuation scenarios were simulated under the following settings and assumptions.
The effect of behavioural aspects (e.g., unrelated people or “family” groups) was assessed. Group behaviour requires that people should stay together and ensure that each member has been evacuated safely so that as a result their walking speeds correspond to the slowest user while response times and evacuation routes are the same for the whole group.
For the evaluation of the RSET, three time periods were considered for each person after the ignition of the fire: (1) the time when the car is still in motion, (2) the whole pre-movement time (i.e., the time for detecting, alerting, reacting, and leaving the vehicle), and (3) the walking time required for reaching a safe place.
The pre-movement period was first simulated as a random variable by assuming a normal distribution for each person with μ = 120 s, σ = 30 s, min = 30 s, max = 210 s (Caliendo et al., Citation2012b; Ronchi et al., Citation2012). Then, a fire alarm system was assumed to be activated by the heat detection system. According to CFD results, this occurs 150 s after the fire start for two cars and bus fires, 120 s for the HGV fire, and 100 s for the tanker fire. The time to react and leave a car after the signal alert was assumed to be equal to 30 s, in agreement with PIARC (Citation1999). Therefore, further simulations were carried out by setting the beginning of the walking phase at 30 s after the fire alarm (i.e., at t = 180 s in the event of cars and bus fires, at t = 150 s in the event of a HGV fire, and at t = 130 s in the event of a tanker fire, respectively) for people in the cars stopping before the alarm alert, and equal to 30 s for people in the cars stopping after the alarm. The number of cars stopping before the alarm was 38 in the event of 2 cars and bus fires, 30 in the event of HGV fire, and 25 in the event of tanker fire, respectively. The unimpeded walking speed for each person was assumed according to a normal distribution for able-bodied adults with μ = 1.25 m/s, σ = 0.32 m/s, min = 0.82 m/s, max = 1.77 m/s (Boyce, Shields, & Silcock, Citation1999; Capote, Alvear, Abreu, Cuesta, & Alonso, Citation2013; SFPE, Citation2008). In addition, the effect of the reduced visibility on walking speed was accounted for by importing smoke data from CFD simulations. During the evacuation process of each person, STEPS uses the imported K values at the corresponding position along the egress pathway to evaluate the walking speed according to the built-in Jin and Yamada (Citation1985) relationships. Those are reported by PIARC (Citation1999) and FIT (Citation2005) for tunnel fire scenarios. Specifically, in the presence of smoke, the walking speed can be reduced because of both smoke concentration and irritation, from 1.3 m/s (when K < 0.3 m−1) to 0.3 m/s, as a function of smoke concentrations and properties (i.e., when K > 1.3 m−1 for non-irritant smoke or when K > 0.55 m−1 for irritating smoke, respectively).
It is to be said that we used the aforementioned Jin and Yamada relationships because these are contained in the STEPS model. Other evacuation models can include different relations. However, the evaluation of different evacuation models with their merits and limits is not within the scope of this paper. Moreover, we investigated only able-bodied adults assuming a specific unimpeded walking speed. A future development of this research might be to make a study by considering also vulnerable users that are characterized by a reduced walking speed.
As regards the escape route choice, it is to be stressed that the tunnel investigated is bidirectional so that the two lanes are used by vehicles running in both directions. As a result, in the event of fire, people should walk on sidewalks in the direction of the exit portals A or B if they are upstream or downstream the fire, respectively. However, people in the zone of the tunnel downstream of the fire (from 1/2 L or 1/4 L and the exit portal B), because of the longitudinal ventilation, might be exposed to hot gases and smoke with the danger of burning or suffocation. Therefore, we are confident that the escape route assumed in simulation can reflect well enough the real choice of most users downstream of the fire. However, the possibility that evacuees can follow different paths to go to the exit portal B also might be object of future investigation.
In our study, 50 runs were carried out for each evacuation scenario. This number of runs was identified as the one required for obtaining satisfactory accuracy (a 95% confidence interval, that is a significance level of 0.05) of resulting normal distributions of the total evacuation time for all scenarios. In addition, acceptance convergence criteria for the mean of the total evacuation time and of its standard deviation were also defined and verified. In particular, it was checked that for 10 consecutive runs, the resulting percentage errors for the mean of the total evacuation times and of the standard deviation were lower than 0.5% and 5%, respectively. According to Ronchi, Reneke, and Peacock (Citation2014), such values of acceptance criteria would permit the assessment of the RSET with a reasonable degree of accuracy.
A grid size equal to 0.5 m and time step of 1 s were used, as evaluated by a preliminary sensitivity analysis. Cell dimension was changed in the range 0.25–1 m, while time step in the range of 0.1–10 s. Results showed that grid size does not significantly affect the resulting evacuation time, and time steps lower than 1 s do not improve solution accuracy.
5.2. Evaluation of RSET and ASET
The RSET were obtained by simulation of evacuation for different scenarios. At the same time, the ASETs were calculated, thanks to the combined use of CFD and evacuation modelling (STEPS code).
ASET was determined by considering the actual path that a person was travelling along the tunnel while exposed to danger. ASET was then calculated as the time at which the FED is equal to 1. The FED for the heat exposure was calculated according to the following equation (Europe, Citation2009; SFPE, Citation2008):
where t Irad and t Iconv are the time for incapacitation due to radiant and convective heat, respectively.
For exposures up to 2 h, the time to incapacitation t Iconv (min) at a temperature T (°C) can be calculated from the following equation (SFPE, Citation2008):
Regarding exposure to radiant heat flux, this can be tolerated when q < 2.5 kW/m2 (t Irad will tend to zero). Above this threshold, time to incapacitation due to radiant heat t Irad (min) at a radiant flux of q (kW/m2) can be given by the following equation (SFPE, Citation2008):
According to Purser (Citation2009), a constant of 1.33 (kW/m2)1.33 min can be used to represent a tenability limit (pain), and 16.7 (kW/m2)1.33 min a 50% probability lethal level for the average population (third degree burns), respectively.
Similarly, the exposure of people to toxic was also evaluated according to the asphyxiation gas model (SFPE, Citation2008). Such a model allows the calculation of the fractional effective dose considering both fire products and the interaction between gases (incapacitation by CO, CO2 and irritants; hypoxia due to low oxygen concentrations).
5.3. Analysis and comparison of results
The HGV fire scenario can be deemed the most dangerous in terms of the combination of probability of occurrence and severity of harm. Therefore, the effects of (a) fire position along the tunnel, (b) smoke type, (c) tunnel geometry, and (d) pre-movement features were studied in detail in the event of a HGV fire. In this section, a set of representative results is discussed, in order to exemplify the effect of all the assessed features on the egress process in terms of evacuation times and safety, as reported in Figures – and in Tables –.
Table 1. Effect of fire position along the tunnel and of smoke type on people at risk of severe burns and ASET
Table 2. Effect of tunnel geometrical parameters on people at risk of severe burns and ASET
Table 3. Effect of the presence of an alarm system on RSET, and on people at risk of severe burns and ASET
Figure 4. Cumulative frequency distributions of RSET for HGV at one-fourth or half of the tunnel length, irritant or non-irritant smoke; curved, sloping tunnel; family relationships; and no alarm system.
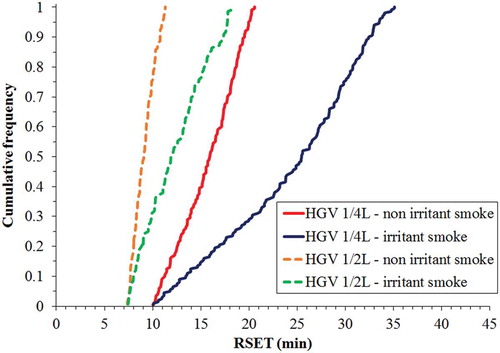
Figure 5. Cumulative frequency distributions of RSET for curved or straight, sloping, or flat tunnel layout; HGV at one-fourth of the tunnel, non-irritant smoke; family relationships; and no alarm system.
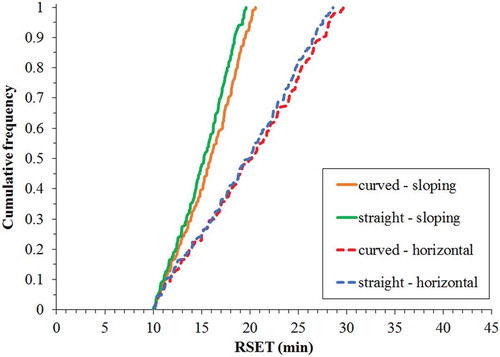
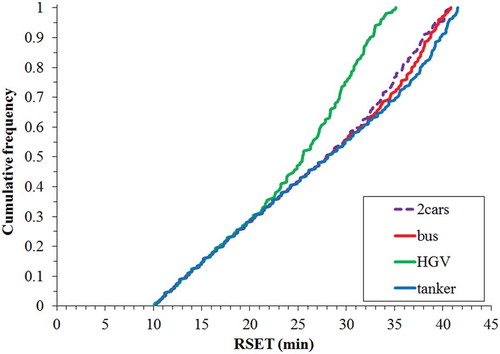
Figure 6. Cumulative frequency distributions of RSET for different burning vehicles.
5.3.1. Location of fire source, irritant, or non-irritant smoke
Figure shows the cumulative frequency distributions of the evacuation time RSET of each tunnel user on the assumption of curved and sloping tunnel, family relationships for people, and pre-movement time according to the normal distribution. HGV located either at one-fourth or at half of the tunnel length in the case of either irritant or non-irritant fire-induced smoke were considered.
When the fire was located at one-fourth of the tunnel length (870 m far from the exit portal B), the evacuation time was obviously higher than when the fire was half way through the tunnel (580 m from the exit portal). For example, when the burning vehicle was at one-fourth of the tunnel length, the people evacuation from the last car in the queue starts 10 min after the fire ignition with respect to 7 min when the fire is at half of the tunnel length.
Moreover, the type of fire-induced smoke significantly affected the egress process of people and especially of those closer to the fire.
In the event of fire at one-fourth of the tunnel length, smoke irritancy caused a much larger effect on people evacuation than in the case of fire half way through the tunnel. In particular, as shown in Figure , the 50th percentile RSET (i.e., the time to evacuate 50% of the population) in the event of fire at one-fourth of the tunnel length was 16 and 25.5 min, respectively, in the presence of non-irritant and irritant smoke, while for fire half way through the tunnel, it was about 9 and 12 min, respectively. Similarly, the total evacuation time increased from 21 to 35 min in the case of fire at 1/4 L and from 11 to 18 min in the case of fire at 1/2 L due to smoke irritancy.
Regarding the safety risk assessment, the risk of incapacitation or even death (50% probability lethal level) due to severe burns is reported in Table . Results clearly show that in the case of non-irritant smoke, the percentage of people at risk was 90% when the fire was at one-fourth of the tunnel length while only 25% when fire was half way through the tunnel. Moreover, as consequence of smoke irritancy, the percentage of people at risk increases, for example, in the case of fire at 1/2 L from 25% to 69%.
5.3.2. Tunnel geometry
The influence of tunnel geometrical parameters, specifically the horizontal alignment (curved or straight tunnel) and the vertical alignment (2% upward sloping or flat tunnel), on the cumulative frequencies of the RSET are reported in Figure . The figure refers to the case of HGV at one-fourth of the tunnel length, non-irritant smoke, family relationships for people, and pre-movement time according to the normal distribution.
For the horizontal alignment, only small differences in the RSET were predicted, with slightly higher values in the case of the curved tunnel compared to the straight one (approximately 1 min for the total evacuation time). On the contrary, significant differences were found for the two different vertical alignments. In fact, a tunnel with grades almost flat does not affect the walking speed when people evacuate in normal conditions, according to Norén and Winér (Citation2003), while a tunnel with higher slopes, in the presence of fire, can play a significant role in managing smoke movement and stratification; thus influencing the walking speed and consequently the evacuation time. Indeed, the longitudinal slope of the tunnel induced a chimney effect in the uphill direction, ensuring less severe conditions at eye level along the tunnel. Therefore, a higher average walking speed was allowed and therefore shorter evacuation times were needed for exiting the tunnel. As reported in Figure , the 50th percentile RSET was about 20 min for the flat alignment and decreased to 15 min in the presence of the 2% uphill slope. The overall egress process lasted 29 min for the flat tunnel and 20 min for the sloping one.
In any case, most of the people (about 90%) were exposed to the risk of severe burns (Table ). Indeed, in all the scenarios, the ASETs were about 10 min, significantly shorter than the required evacuation times (>20 min).
5.3.3. Sound alarm system
The influence of pre-movement features on RSET was also assessed. In particular, in Table , the results assuming the pre-movement time with a normal distribution (mean = 2 min after the cars stop) were compared with those in the presence of a sound alarm system triggering evacuation after fire detection (at 2 min). Results refer to the scenarios with HGV at one-fourth of the tunnel length, non-irritant smoke, curved and sloping tunnel, and family relationships for people.
The results showed the beneficial influence that the installation of an audio alarm system could produce in the event of a fire. As an example, the 50th percentile RSET was of approximately 16 and 12 min without and with the alarm system, respectively. For about 95% of evacuees, a shorter evacuation time should be guaranteed by the presence of an alarm. Moreover, when evacuation was triggered by an alarm, a safe evacuation (RSET < ASET) was guaranteed for about 40% of evacuees, namely, all people in the last 50 queued cars closer (i.e., distance < 350 m) to the tunnel portal.
5.3.4. Comparison among different types of burning vehicles on the evacuation time
A comparison between the fire scenario of the HGV located at one-fourth of the tunnel length (with curved and sloping tunnel, irritant fire-induced smoke, family/friends relationships for people, pre-movement time modelled as a normal distribution) and the other three types of burning vehicles (i.e., 2 cars, bus, tanker) was also made. Figure shows the comparison among the cumulative frequency distributions of the evacuation times. In all cases, except HGV, the time to evacuate 50% of people from the tunnel was within 28 min, while for the HGV fire scenario, it was 25.5 min. In addition, the time required for all the people to escape the tunnel increased from 35 min for the HGV fire to 41 min for the other vehicles. This result was probably due to a different combination of the type of materials composing the vehicles and the type of transported goods, both affecting concentrations and optical properties of fire-induced smoke, which in the case of HGV determined a lower decrease in visibility along the escape route, and allowing a higher walking speed.
The risk of incapacitation or even death due to severe burns is reported in Table (together with ASET) for the various scenarios compared in Figure .
Table 4. Effect of the type of burning vehicle on the people at risk of severe burns and ASET
Results clearly show that in the case of a two-car fire, all people might safely evacuate the tunnel. In the event of the other vehicle fires, most or all people might be at risk, in absence of any other safety measure or equipment inside the tunnel.
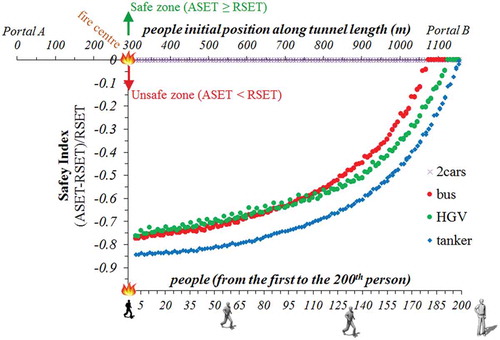
5.3.5. Safety index
A way to summarize the results of RSET and ASET obtained for the four different burning vehicles located at 1/4 L (with curved alignment, longitudinal slope of 2%, without an alarm system, in presence of users who behave as groups of families and irritant smoke) is presented in this paragraph. Since the spectrum of possibilities was obviously as follows: ASET > RSET, ASET = RSET, ASET < RSET, a SI was introduced (SI = ASET − RSET/RSET). Increasing levels of SI represent increasing safety levels for people evacuation from the tunnel; in particular, when SI ≥ 0, people were able to evacuate the tunnel in safety (safe zone), while when SI < 0, people might be at risk of being severely burned (unsafe zone) in absence of additional safety measures. Figure shows that in the case of two cars, all people might safely evacuate the tunnel (SI ≥ 0). In the event of the other vehicle fires, the number of people that might be at risk (SI < 0) was 178, 191, and 200 for bus, HGV, and tanker, respectively, compared to the total number of people (200) escaping downstream the fire towards the exit portal.
Figure 7. Comparison of people evacuation from different fires in terms of safety index.
5.4. Assessment of people evacuation with and without emergency exits for HGV fire at one-fourth L
In this section are reported the results obtained for the HGV fire scenario assuming that direct exits from the tunnel to the outside had been built between the two portals (or in alternative exits to an emergency tunnel). In particular, we investigated three cases: (1) one emergency exit at 1/2 L, (2) two emergency exits 1/3 L spaced, and (3) three emergency exits 1/4 L spaced, as shown in Figure .
Figure 8. Three alternative configurations of emergency exits (1, 2, or 3) and summary of people evacuating (tunnel, vehicles, sings, and people are not in scale).
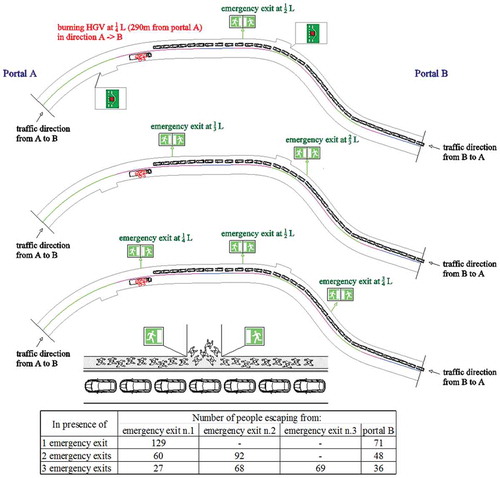
The results showed that in the presence of one emergency exit, 129 people evacuated from this one and 71 from portal B, while with 2 emergency exits, 60 people evacuated from the emergency exit located at 1/3 L, 92 from the emergency exit located at 2/3 L, and 48 from the portal B; and finally with 3 available emergency exits, 27 people evacuated from the emergency exit located at 1/4 L, 68 from the emergency exit located at 1/2 L, 69 people from the emergency exit at 3/4 L, and 36 from portal B. The results obtained in terms of cumulative frequency distributions of RSET are reported in Figure . This figure shows that the 50th percentile RSET decreased from 25.5 to 11 min with one emergency exit and to 8 min in the presence of two emergency exits, while no significant change was found with three emergency exits compared to two emergency exits. Similarly, the total evacuation time decreased from 35 to 23 min with one emergency exit, 19 min with two emergency exits, and 16.5 min with three emergency exits.
Figure 9. Cumulative frequency distributions of RSET for different numbers of emergency exits.
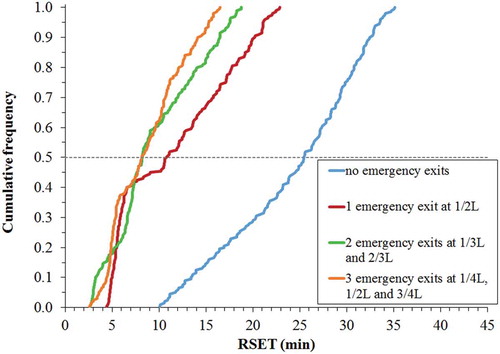
Figure shows the SI as function of the people’s initial position from which they evacuate. SI ranges were reported with different colours for different zones of the tunnel: safe starting zone (green), unsafe starting zone (red), and intermediate starting zone (yellow).
Figure 10. Comparison of people evacuation for different number of emergency exits in terms of safety index (SI) in function of people initial position (tunnel, people, and signs are not in scale).
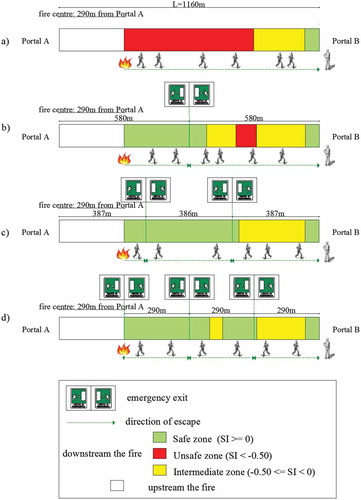
In particular, we found a reduction in the number of people that might be risking severe burning (SI < 0) from 191 people to 103 people with 1 emergency exit, 72 people with 2 emergency exits, and 67 people with 3 emergency exits. It is to be noted that significant benefits were found with one and two emergency exits, which correspond to a distance between exits (including the portals) equal to 580 and 387 m, respectively. By adding another emergency exit (i.e., distance between exits equal to 290 m), only small benefits in terms of safety of people evacuation were found. In other words, in the case investigated of a bi-directional road tunnel, a more appropriate distance between emergency exits should be of approximately 350 m, thus more than 300 m (ANAS, Citation2009) and less than 500 m (Italian Ministry of Infrastructures and Transports, Citation2006).
6. Summary and conclusions
In this paper, the effect of the position of fire both on the environmental conditions in the tunnel and on the evacuation process for people safety was investigated. Moreover, a criterion was derived for the choice of the emergency exits, since different indications can be found concerning the maximum distance between them.
To achieve the paper’s purposes, simulations were performed in a bi-directional road tunnel having two lanes and a length of about 1.2 km. Two different positions of various burning vehicles were investigated by CFD modelling in order to make an appropriate comparison in terms of temperature, radiant heat flux, visibility, and CO concentration along the evacuation route. In particular, fire scenarios associated to two cars, bus, HGV, and petrol tanker located at one-fourth and half of the tunnel length were analysed. The effect on people evacuation of the aforementioned combinations of vehicles and positions when the tunnel is full of vehicles was also assessed and the results commented. Finally, the effectiveness of the implementation of emergency exits and the identification of their optimal distance was shown. On the basis of this study, the conclusions which follow may be drawn.
CFD results showed that when the burning vehicle was half way through the tunnel, higher temperatures were computed both at ceiling and wall with respect to the position at one-fourth of the tunnel length. This might be attributed to a minor reduction in gas cooling effect for the greater distance from portals where fresh air conditions are found. The higher temperatures at 1/2 L indicate that when the fire happens in this position, higher negative effects on tunnel structure and equipment are expected.
However, with reference to environmental conditions along the escape route, in the case of fire at 1/4 L, the safety temperature of 80°C was exceeded at a distance from the fire source shorter than that associated with the burning vehicle at the tunnel midpoint. When fires were fully developed, unsafe conditions for the whole egress path were reached in all fire scenarios except the two-car scenario. Similar results were obtained by comparing the longitudinal profiles of radiant heat flux along the evacuation path: peak values were reached at a shorter distance from the fire source in the event of burning vehicle at 1/4 L. Moreover, the visibility distance was found to be more reduced when the burning vehicle was at 1/4 L rather than at 1/2 L. CO and CO2 concentrations were also found to be affected by a change of fire position in the tunnel, even if the values remained below safety limits. In other words, the effect of the fire location on the environmental conditions along the escape route was found to be worse for the fire source at 1/4 L compared to that at 1/2 L. The differences observed between the longitudinal spread of gas temperature, just as for the other variables investigated, might be due to the differences in gas velocity, which in turn are related to the different pressure drop in the portion of tunnel downwind the fire. Expressed in further detail, when greater is the length of the tunnel portion downwind the fire and the number of cars in the traffic jam, higher is the pressure drop, lower is the gas velocity, and higher the gas temperature.
Evacuation simulations performed for the HGV fire scenario showed that when the HGV was located at one-fourth of the tunnel length, the evacuation time was obviously higher than at 1/2 L, due to the longer distance from the portal. However, the presence of irritant smoke compared to non-irritant smoke caused a much greater effect on people evacuation due to the slower walking speed. The risk of incapacitation or even death due to severe burns involved 96% of the population (191 people) in the event of irritant smoke compared to 90% (180 people) of non-irritant smoke.
Regarding the effects of the horizontal and vertical alignment of the tunnel, we found slightly higher RSET values in the case of a curved tunnel compared to a straight one. In the case of 2% longitudinal slope, less severe conditions along the tunnel were found, and as a result, the walking speed was higher and a reduction in the evacuation time to exit the tunnel was found. Moreover, the installation of audio alarm system had positive effects since it guaranteed a shorter evacuation time for about 95% of evacuees and a save evacuation for about the 40% of evacuees (while for only 10% of people in the absence of an alarm).
Finally, the comparison between the different types of burning vehicles showed that the time to evacuate was lower for the HGV fire scenario. This is probably due to a lower reduction in visibility and hence in walking speed due to a different combination of the type of materials composing the vehicles and the type of transported goods. The results also showed that in the case of a two-car fire, all people might safely evacuate the tunnel, while for other vehicles, most or all people might be at risk: 89% (178 people) in the event of a bus fire, 96% (191 people) for a HGV fire, and 100% (200 people) for petrol a tanker fire.
With reference to emergency exits, the results expressed in terms of SI showed a reduction in the number of people that might be at risk of being severely burned (SI < 0) from 191 people to 103 people with one emergency exit, 72 with two emergency exits, and 67 with three emergency exits. In other words, significant benefits were found with one and two emergency exits, which correspond to a distance from exits (including the portals) equal to 580 and 387 m, respectively; by adding another emergency exit (i.e., distance between exits equal to 290 m), only small benefits in terms of safety of people evacuation were found compared to two emergency exits. In other words, we found that, in the case investigated of a bi-directional road tunnel, an optimal distance from the emergency exits should be of about 350 m.
The authors of this paper are confident that by carrying out an appropriate analysis and implementing appropriate assumptions, they have calibrated CFD modelling and people evacuation simulation quite accurately. However, although this paper contributes to increase our knowledge of the effects of the position of various burning vehicles in a tunnel, there are still several points of interest that are worth investigating. First of all, different evacuation models should be also investigated in order to understand whether any differences may occur in the results of the calculations. This should also be done by assuming different occupancy rates for cars and including also disabled people. Moreover, the possibility that evacuees can follow different paths towards the exit portal also might be taken into account. Thus, research needs to be addressed towards applying the evacuation modelling on a larger scale for making a further incremental step possible in the field of transportation safety in road tunnels.
Competing Interests
The author declares no competing interest
Correction
This article has been republished with minor changes. These changes do not impact the academic content of the article.
Additional information
Funding
Notes on contributors
Ciro Caliendo
Ciro Caliendo is a full professor of “Roads, railways and airports.” His interests include road and tunnel safety; risk analysis, traffic microsimulation, and structural behaviour of infrastructure pavements. He is the author of over 100 papers published in journals and conferences.
Paolo Ciambelli
Paolo Ciambelli is a professor emeritus of “Chemical engineering”, CEO of NARRANDO start-up. His interests are catalytic materials and processes for industry, energy, and environment, safety in road tunnels. He is the author of 350 articles and 12 patents.
Maria Luisa De Guglielmo
Maria Luisa De Guglielmo, is a Ph.D. and research assistant. Her interest deals with road and tunnel safety, and risk analysis. She is the author of over 20 publications.
Maria Grazia Meo
Maria Grazia Meo, is a Ph.D. and post-doc, has experience in CFD fire simulation and people evacuation. She is the author of five publications (Scopus).
Paola Russo
Paola Russo is an associate professor of “Process & Product Safety in the Chemical Industry.” She has expertise in CFD modelling, experimental analysis of gas and explosions, and mitigation and protection systems for industrial equipment. She is the author of 96 publications (Scopus).
References
- ANAS . (2009). Linee guida per la progettazione della sicurezza nelle gallerie stradali (Second ed.). Italian: Condirezione Generale Tecnica, Direzione Centrale Progettazione.
- ANSYS . (2015). ANSYS CFX, Release 16.2 . Pennsylvania, USA.
- Babrauskas, V. , Fleming, J. M. , & Russel, B. D. (2010). RSET/ASET, a flawed concept of fire safety assessment. Fire and Materials , 34, 341–355. doi:10.1002/fam.1025
- Betta, V. , Cascetta, F. , Musto, M. , & Rotondo, G. (2010). Fluid dynamic performances of traditional and alternative jet fans in tunnel longitudinal ventilation systems. Tunnelling and Underground Space Technology , 25, 415–422. doi:10.1016/j.tust.2010.02.006
- Boyce, K. E. , Shields, T. J. , & Silcock, G. W. H. (1999). Toward the characterization of building occupancies for fire safety engineering: capabilities of disabled people moving horizontally and on an incline. Fire Technology , 35, 51–67. doi:10.1023/A:1015339216366
- Caliendo, C. , Ciambelli, P. , De Guglielmo, M. L. , Meo, M. G. , & Russo, P. (2012a). Numerical simulation of different HGV scenarios in curved bi-directional road tunnels and safety evaluation. Tunnelling and Underground Space Technology , 31, 33–50. doi:10.1016/j.tust.2012.04.004
- Caliendo, C. , Ciambelli, P. , De Guglielmo, M. L. , Meo, M. G. , & Russo, P. (2012b). Simulation of people evacuation in the event of a road tunnel fire. Procedia - Social and Behavioral Science , 53, 178–188. doi:10.1016/j.sbspro.2012.09.871
- Caliendo, C. , Ciambelli, P. , De Guglielmo, M. L. , Meo, M. G. , & Russo, P. (2013). Simulation of fire scenarios due to different vehicle types with and without traffic in a bi-directional road tunnel. Tunnelling and Underground Space Technology , 37, 22–36. doi:10.1016/j.tust.2013.03.004
- Caliendo, C. , & De Guglielmo, M. L. (2016). Quantitative risk analysis based on the impact of traffic flow in a road tunnel. International Journal of Mathematics and Computers in Simulation , 10, 39–45.
- Caliendo, C. , & De Guglielmo, M. L. (2017a). Quantitative risk analysis on the transport of dangerous goods through a bi-directional road tunnel. Risk Analysis , 137(1), 116–129. ISSN 1539-6924. doi:10.1111/risa.12594
- Caliendo, C. , & De Guglielmo, M. L. (2017b). Simplified method for risk evaluation in unidirectional road tunnels related to dangerous goods vehicles. International Journal of Civil Engineering and Technology , 8(6), 960–968.
- Capote, J. A. , Alvear, D. , Abreu, O. , Cuesta, A. , & Alonso, V. (2013). A real-time stochastic evacuation model for road tunnels. Safety Science , 52, 73–80. doi:10.1016/j.ssci.2012.02.006
- Chow, W. K. (2011). Six points to note in applying timeline analysis in performance-based design for safety provision in the far east. International Journal on Engineering Performance-Based Fire Codes, 10 , 1–5.
- Chu, G. , & Wang, J. (2011). Uncertainty analysis on number of fatalities in building fires . Proceedings of the 2011 International Conference on Industrial Engineering and Engineering Management, December 6-9 , Singapore, pp. 1902–1906.
- Chu, G. Q. , Chen, T. , Sun, Z. H. , & Sun, J. H. (2007). Probabilistic risk assessment for evacuees in buildings fires. Building and Environment , 42, 1283–1290. doi:10.1016/j.buildenv.2005.12.002
- Ciambelli, P. , Meo, M. G. , Russo, P. , & Vaccaro, S. (2006). Sensitivity analysis of a computer code for modelling confined fire. WIT Transaction on Engineering Sciences , 53, 299–309.
- Ciambelli, P. , Meo, M. G. , Russo, P. , & Vaccaro, S. (2007). CFD simulations for the comparison of the effectiveness of some fire protection systems in road tunnels . Proceedings of the 5th International Seminar on Fire and Explosion Hazards, April 23-27, School of Engineering and Electronics . Edinburgh (UK): University of Edinburgh Press, pp. 758–767.
- Ciambelli, P. , Meo, M. G. , Russo, P. , & Vaccaro, S. (2011). Thermal radiation modelling in tunnel fires. Advances in Applied Mathematics and Mechanics , 3, 327–353. doi:10.4208/aamm.10-10s2-05
- Colella, F. , Rein, G. , Borchiellini, R. , & Torero, J. L. (2011). A novel multi-scale methodology for simulating tunnel ventilation flows during fires. Fire Technology , 47, 221–253. doi:10.1007/s10694-010-0144-2
- Colella, F. , Rein, G. , Carvel, R. , Reszka, P. , & Torero, J. L. (2010b). Analysis of the ventilation systems in the Dartford tunnels using a multi-scale modelling approach. Tunnelling and Underground Space Technology , 25, 423–432. doi:10.1016/j.tust.2010.02.007
- Colella, F. , Rein, G. , Carvel, R. , & Torero, J. L. (2010a). Tunnel ventilation effectiveness in fire scenarios. FS-World Magazine . Special Edition on Tunnel Safety. 36–40.
- Cooper, L. Y. (1982). A mathematical model for estimating available safe egress time in fires. Fire and Materials , 6, 135–144. doi:10.1002/(ISSN)1099-1018
- Cooper, L. Y. (1983). A concept for estimating available safe egress time in fires. FireSafety Journal , 5, 135–144.
- Cooper, L. Y. , & Stroup, D. W. (1982). Calculating Available Safe Egress Time (ASET) - a computer program and user’s guide . Washington, D.C: US Department of Commerce, National Bureau of Standards.
- Domenichini, L. , La Torre, F. , Vangi, D. , Virga, A. , & Brazzi, V. (2017). Influence of the lighting system on the driver’s behavior in road tunnels: A driving simulator study. Journal of Transportation Safety& Security , 9(2), 216–238. doi:10.1080/19439962.2016.1173155
- EEA . (2010). Occupancy rates of passengers vehicles . Denmark: European Environment Agency. Website. eea.europa.eu
- Europe, C. F. P. A. (2009). Fire safety engineering concerning evacuation from buildings. European Guideline CFPA-E , 19, 4–46.
- European Parliament and Council . (2004, April 30). Directive 2004/54/EC on minimum safety requirements for tunnels in the trans-European road network. Official Journal of the European Union L.167, Bruxelles , 1–53.
- FIT-European Thematic Network Fire in Tunnels . (2005). Design fire scenarios (Technical Report Part 1, A. Haack, STUVA), Copyright © WTCB, Brussels, Belgium..
- Fleischmann, C. M. (2009). Prescribing the input for the ASET versus RSET analysis: Is this the way forward for Performance Base Design? Proceedings of the Advanced Research Workshop on Fire Protection and Life Safety in Buildings and Transportation Systems, October 15-17 , Santander (Spain),pp. 1–17.
- Glasa, J. , Valasek, L. , Halada, L. , & Weisenpacher, P. (2014). Modeling of impact of fire on safety evacuation in tunnel. Journal of Physic: Conference Series , 490, 1–4.
- Hall, J. (2004). How many people can be saved from home fires given more time to escape? Fire Technology , 4, 117–126. doi:10.1023/B:FIRE.0000016839.11376.b3
- Hu, L. H. , Zhou, J. W. , Huo, R. , Peng, W. , & Wang, H. B. (2008). Confinement of fire induced smoke and carbon monoxide transportation by air curtain in channels. Journal of Hazardous Materials156 , 327–334. doi:10.1016/j.jhazmat.2007.12.041
- Ingason, H. (2008). UPTUN workpackage 2 fire development and mitigation measures d221, target criteria. In Officialdeliverable © versionSeptember (pp. 2008). UPTUN (Consortium of partners from different european countries).
- ISO/TR 13387-8 . (1999). Fire safety engineering - part 8: Life safety – occupant behaviour, location and condition . Genève, Switzerland: International Organization for Standardization (ISO).
- ISO/TR 16738 . (2009). Fire-safety engineering - technical information on methods for evaluating behaviour and movement of people . Genève, Switzerland: International Organization for Standardization (ISO).
- Italian Ministry of Infrastructures and Transports (2006, October). Adoption of the directive 2004/54/EC on the safety of tunnels belonging to the trans-European road network(G.U. No. 235). Italian.
- Jin, T. , & Yamada, T. (1985). Irritating effects of fire smoke on visibility. Fire Science and Technology , 5, 79–89. doi:10.3210/fst.5.79
- Kashef, A. , Saber, H. H. , & Gao, L. (2009). Optimization of emergency ventilation strategies in a curved section of a road tunnel. Nrcc-51289 , 11, 1–17.
- Kretz, T. , Mayer, G. , & Muehlberger, A. (2010). Behaviour and perception-based pedestrian evacuation simulation . Proceedings of5th International Conference on Pedestrian and Evacuation Dynamics (PED2010), March 8-10 , Gaithersburg, MD (USA), pp. 827–831.
- Kuligowski, E. D. , & Peacock, R. D. (2005). A review of buildings evacuation models . Technical Note 1471, Washington (USA): NIST, Fire Research Division.
- Li, J. , & Chow, W. K. (2003). Numerical studies on performance evaluation of tunnel ventilation safety system. Tunnelling and Underground Space Technology , 18, 435–452. doi:10.1016/S0886-7798(03)00023-3
- Lin, C. J. , & Chuah, Y. K. (2008). A study on long tunnel smoke extraction strategies by numerical simulation. Tunnelling and Underground Space Technology , 23, 522–530. doi:10.1016/j.tust.2007.09.003
- Liu, Y. , Apte, V. , Luong, Y. , Liu, X. , & Yung, D. (2007). A methodology for assessment of visibility during road tunnel fires. Journal of Fire Protection Engineering , 17, 65–79. doi:10.1177/1042391507064995
- Meo, M. G. (2009). Modelling of enclosure fires(PhD Thesis in Chemical Engineering). Department of Chemical and Food Engineering, University of Salerno(Italy). ISBN 88-7897-032-8.
- Miles, S. , Kumar, S. , & Chong, K. (2002). Development of a CFD methodology for predicting the combined effect of sprinklers and smoke ventilation in tunnels . Proceedings of the Fourth International Conference on Tunnel Fires, December 2-4, Basel (Switzerland), pp. 329–338.
- Mott MacDonald . (2015). STEPS simulation of transient evacuation and pedestrian movements user manual (5.3 Version) . United Kingdom: Author.
- NIST Website . (2016). Retrieved from http://www.nist.gov/el/fire_protection/buildings/fire-modeling-programs.cfm
- Nmira, F. , Consalvi, J. L. , Kaiss, A. , Fernandez-Pellob, A. C. , & Porterie, B. (2009). A numerical study of water mist mitigation of tunnel fires. Fire Safety Journal , 44, 198–211. doi:10.1016/j.firesaf.2008.06.002
- Norén, A. , & Winér, J. (2003). Modelling crowd evacuation from road and train tunnels - data and design for faster evacuations(Report 5127). Department of Fire Safety Engineering, Lund University (Sweden).
- Papaioannou, P. , & Georgiou, G. (2008). UPTUN workpackage 3 human response D32, human behaviour in tunnel accidents and incidents: End-users, operators and response teams. In Official deliverable © version September (pp. 2008). UPTUN (Consortium of partners from different european countries).
- Pauls, J. L. (1980). Building evacuation: Research findings and recommendations. In D. Canter (Ed.), Fires and human behaviour , chapter 14 (pp. 251–276). Chichester/New York: Wiley.
- Persson, M. (2002). Quantitative risk analysis procedure for the fire evacuation of a road tunnel(Report 5096). Department of Fire Safety Engineering, Lund University (Sweden). doi:10.1044/1059-0889(2002/er01)
- PIARC . (1999). Fire and smoke in road tunnels. PIARC technical committee C5 road tunnel. Retrieved from http://www.piarc.org
- PIARC (2008). Risk analysis for road tunnels. PIARC Technical Committee C3.3 road tunnel operation. Retrieved from http://www.piarc.org
- Pribly, P. , & Pribyl, O. (2014). Effect of tunnel technological systems on evacuation time. Tunnelling and Underground Space Technology , 44, 88–96. doi:10.1016/j.tust.2014.07.014
- Prolux, G. (2006). Egress times from single family houses(Research Report IRC-RR-209). NRC-CNRC National Research Council of Canada.
- Purser, D. (2003a). ASET and RSET: Addressing some issues in relation to occupant behaviour and tenability . Proceedings of the seventh International Symposium Fire Safety Science 7, pp. 91–102. Massachusetts, USA.
- Purser, D. (2003b). Behaviour and travel interactions in emergency situations and data needs for engineering design . Proceedings of the 2nd International Conference on Pedestrian and Evacuation Dynamics (PED), August 20-22, U.K.: University of Greenwich, pp. 355–370.
- Purser, D. (2009). Physiological effects of combustion products and fire hazard assessment . Proceedings of the Europacable Seminar: Safety during Fire, May 6th, Brussels (Belgium), pp. 3–36.
- Purser, D. (2011). Design behavioural scenarios for escape behaviour modelling in tunnels and underground complexes . Proceedings of Advanced Research Workshop on Evacuation and human behaviour in emergency situations, October 21, Santander (Spain): University of Cantabria, pp. 1–19.
- Qu, L. , & Chow, W. K. (2013). Common practices in fire hazard assessment for underground transport stations. Tunnelling and Underground Space Technology , 38, 377–384. doi:10.1016/j.tust.2013.07.018
- Ronchi, E. (2013). Testing the predictive capabilities of evacuation models for tunnel fire safety analysis. Safety Science , 59, 141–153. doi:10.1016/j.ssci.2013.05.008
- Ronchi, E. , Alvear, D. , Berloco, N. , Capote, J. , Colonna, P. , & Cuesta, A. (2012). The evaluation of different evacuation models for assessing road tunnel safety analysis. Tunnelling and Underground Space Technology , 30, 74–84. doi:10.1016/j.tust.2012.02.008
- Ronchi, E. , Reneke, P. A. , & Peacock, R. D. (2014). A method for the analysis of behavioural uncertainty in evacuation modelling. Fire Technology , 50, 1545–1571. doi:10.1007/s10694-013-0352-7
- Schrefler, B. A. , Brunello, P. , Gawin, D. , Majorana, C.E. , & Pesavento, F. (2002). Concrete at high temperature with application to tunnel fire. Computational Mechanics , 29, 43-51.
- SFPE . (2008). Handbook of fire protection engineering. 4th Edition (Di Nenno, P.J. et al. Eds. ). Quincy (USA): National Fire Protection Association.
- Shields, J. (2005). Human Behaviour in Tunnel Fires. In A. Beard & R. Carvel (Eds.), The handbook of tunnel fire safety (pp. 323–342). London: Thomas Telford Ltd.
- Shields, T. J. , Silcock, G. W. , & Dunlop, K. E. (1992). A methodology for determination of code equivalency with respect to the provision of means of escape. Fire Safety Journal , 19, 267–278. doi:10.1016/0379-7112(92)90009-2
- Sime, J. D. (1986). Perceived time available: The margin of safety in fires . Proceedings of the first International SymposiumFire Safety Science 1, pp. 561–570. Retrieved from http://www.iafss.org/publications/fss/1/561/view/fss_1-561.pdf
- Steinert, C. (1994). Smoke and heat production in tunnel fires . Proceedings of the International Conference on Fires in Tunnels, October 10-11, Boras (Sweden), pp. 123–137.
- Tuovinen, H. , Holmstedt, G. , & Bengtson, S. (1994). CFD modelling of tunnel fires . Proceedings of the International Conference on Fires in Tunnels, October 10-11 , Boras(Sweden), pp. 297–312.
- Valasek, L. , & Glasa, J. (2013). Simulation of the course of evacuation in tunnel fire conditions by FDS+Evac . Proceedings of the 2013 International Conference on Applied Mathematics and Computational Methods in Engineering, July 16-19 , Rhodes (Greece), pp. 288–295. doi:10.1177/1753193412450651
- Van Maele, K. , & Merci, B. (2008). Application of RANS and LES field simulations to predict the critical ventilation velocity in longitudinally ventilated horizontal tunnels. Fire Safety Journal , 43, 598–609. doi:10.1016/j.firesaf.2008.02.002
- Wang, H. Y. (2009). Prediction of soot and carbon monoxide production in a ventilated tunnel fire by using a computer simulation. Fire Safety Journal , 44, 394–406. doi:10.1016/j.firesaf.2008.08.007
- Woodburn, P. J. , & Britter, R. E. (1996). CFD simulation of a tunnel fire. Part I and II. Fire Safety Journal , 26, 35–62, 63–90. doi:10.1016/0379-7112(96)00018-5
- Wu, Y. , & Bakar, M. Z. A. (2000). Control of smoke flow in tunnel fires using longitudinal ventilation systems - a study of the critical velocity. Fire Safety Journal , 35, 363–390. doi:10.1016/S0379-7112(00)00031-X
- Xue, H. , Ho, J. C. , & Cheng, Y. M. (2001). Comparison of different combustion models in enclosure fire simulation. Fire Safety Journal , 36, 37–54. doi:10.1016/S0379-7112(00)00043-6
- Yang, G. , Peng, L. , Peng, J. , Zhang, J. , Zhao, M. , & Yong-Lin, A. (2006b). Cross passage interval of super long tunnel from view of people’s safe escape . Proceedings of International Symposium on Safety Science and Technology , Changsha (China), pp. 360–364.
- Yang, G. , Peng, L. , Zhang, J. , & Yong-Lin, A. (2006a). Simulation of people’s evacuation in tunnel fire. Journal of Central South University of Technology , 13, 307–312. doi:10.1007/s11771-006-0130-5
- Yoon, S. , Rie, D. , & Kim, H. (2009). Smoke control of fire in a tunnel with vertical shaft. Journal of Loss Prevention in the Process Industries , 22, 954–957. doi:10.1016/j.jlp.2009.08.024
- Yuan, J. , Fang, Z. , Tang, Z. , & Sun, J. (2011). Performance- based fire safety assessment of city underwater tunnel. Procedia Engineering , 11, 86–90. doi:10.1016/j.proeng.2011.04.631
- Zhou, J. B. , Chen, H. , Yan, B. , Shi, X. , & Li, X. W. (2014). Risk assessment of operation safety in freeway tunnels: An evaluation approach using multiple safety indices. Journal of Transportation Safety& Security , 6(2), 93–116. doi:10.1080/19439962.2013.817494