
 ?Mathematical formulae have been encoded as MathML and are displayed in this HTML version using MathJax in order to improve their display. Uncheck the box to turn MathJax off. This feature requires Javascript. Click on a formula to zoom.
Abstract
This paper investigates the effects of different preparation methods (dry tamping, moist tamping, dry pluviation and wet pluviation) on inherent fabric anisotropy of reconstituted sand samples in the laboratory. An image analysis approach was used to quantify the inherent fabric anisotropy in terms of the vector magnitude based on a second-order fabric tensor. In addition, the effects of reconstituted soil sample preparation methods on the void ratio and density index were investigated. This study shows that the specimens prepared by pluviation methods possess more pronounced inherent fabric anisotropy than those by tamping methods. Among all the methods considered in this investigation, the dry pluviation method provided the highest degree of inherent fabric anisotropy. It is shown that the mass-flow and drop height does not effectively influence the packing density. Also, it has been found that no significant effect on void ratio is observed while using different tamping methods, which may be attributed to the fact that the sand used in this study is less well graded. In addition, it is found that the increase in the height of tamper leads to an increase in packing density or a decrease in relative density, with an approximately linear relationship.
PUBLIC INTEREST STATEMENT
This paper investigates the effects of different sample preparation methods on inherent anisotropy. An image analysis approach was used to quantify the inherent anisotropy using a second-order tensor. In addition, the effects of sample preparation methods on the void ratio and density index were investigated. It has been found that no significant effect on void ratio is observed while using different tamping methods, which may be attributed to the fact that the sand used in this study is less well-graded. In addition, the increase in the height of tamper leads to an increase in packing density or a decrease in relative density, with an approximately linear relationship.
1. Introduction
Macroscopically, soils are composed of discrete particles together with voids and/or fluids, which are often treated as a continuum for engineering analysis and design. Due to the existence of gravitational forces, naturally deposited soils have prominent fabrics which inevitably affect the mechanical behaviour of soils under loading conditions. To understand the relationship between the fabric anisotropy and mechanical behaviour of granular materials, quantifying fabric anisotropy is crucial. However, this is not an easy job and there is no standard way of doing it. Therefore, a comprehensive yet simple experimental procedure needs to be developed for the purpose. In recent years, soil anisotropy and its importance have gained more and more attention in providing the effective geotechnical engineering solutions, and substantial research attempts have been made in the laboratory, as well as in the field (Yang, Li, & Yang, Citation2008).
Tessellation of particles in soils remains largely unknown until suitable optical techniques, such as scanning electronic microscope (SEM), are used to observe its evolution. Conventionally, clay samples can be obtained by trimming from a large block of cohesive soils in the field. Nevertheless, such a method may not be applicable for granular soils, such as sand due to the high cost of obtaining the representative field soil samples without any disturbance (Yoshimi, Tokimatsu, & Phara, Citation1994). The structural tessellation of soil grains remains the most significant phenomenon influencing the constitutive stress–strain behaviour of the reconstituted soil samples in the laboratory. Typically, an image-based analysis method has become a promising approach used in geotechnical labs (Jang, Frost, & Park, Citation1999; Kuo & Frost, Citation1996).
Many investigators prepared remolded and reconstituted soil samples using dry/wet pluviation (DP/WP), slurry deposition, vibrations/moist tamping (MT) in layers in the laboratory (Amini & Qi, Citation2000; Ladd, Citation1974; Li, Yang, Yu, & Roberts, Citation2018). Oda, Koishikawa, and Higuchi (Citation1978) revealed that the reconstitution by wet pluviated (WP) method could be used to mimic the fabric of fluvial and hydraulic-fills with sands. It was described by Casagrande (Citation1975) that the fabric of a granular material after MT method resulted in a honeycomb structure and appeared to be potentially collapsible. The evidence of such collapse is attributed to the large reduction in the void ratio (e) during saturation of the MT specimens prior to the undrained testing (Chang, Hseih, Samuelson, & Horita, Citation1981; Marcuson & Gilbert, Citation1972; Sladen, D’Hollander, & Krahn, Citation1985). The effect of sample reconstitution methods on the behaviours of granular materials under shearing was studied by Li et al. (Citation2018). From the experimental results, it was noticed that different sample reconstitution methods have limited effects on the shear behaviour in monotonic loading tests. The liquefaction resistance was high using the dried wet tamping method followed by the dry funnel method and air pluviated method.
A lot of research has been carried out on the WP sands (Vaid & Sivathayalan, Citation2000). Also, the air pluviation (AP) and MT approaches have been used by several investigators for the preparation of reconstituted soil samples. If the specimen is considered to be uniform, the relative density (ID ) of the complete specimen differs by a maximum of ± 10% from the average value. Similarly, pronounced heterogeneities have been described by Castro (Citation1969), especially for the reconstituting low-density specimens. A stationary pluviation and vibratory methods are found to be very simple to prepare because of the presence of only two diffusers with an ability to produce uniform samples in a short time span. The relative density from these methods was noticed as 53–99% and 74–99% for IS Grade II and III grains of sand, respectively (Hariprasad, Rajashekhar, & Umashankar, Citation2016). Using a portable travelling pluviator, the relative density has achieved a range of 45–100% and 36–100% for the two poorly graded sands by changing both the height of fall and the opening width of the sieves (Dave & Dasaka, Citation2012).
Vaid, Uthayakumar, Sivathayalan, Robertson, and Hofmann (Citation1995) used WP, AP, and MT methods to get a reconstituted Syncrude sand sample with identical initial states, and investigated the response under undrained direct simple shear (DSS). It was observed that the extreme dissimilarities were addressed in the behaviour depending on the method of reconstitution, which controls the resultant fabric. Cresswell, Barton, and Brown (Citation1999) observed that the AP technique can produce reconstituted sand samples with the least soil degradation. Also, the compaction during pluviation reached peak efficiency when a continuous energetic layer was formed. Within the energetic layer, the grain displacement and grain hammering were operated to their greatest effectiveness. A new mobile pluviation equipment was designed based on the AP technique to prepare different sand samples in the laboratory (Khari, Anuar Kassim, & Adnan, Citation2014). The densities of soil samples were estimated based on the correlation between falling height and the rate of soil discharge of the shutter. The relative density using this apparatus was ranged from 10 to 98% and the main advantage of using this pluviator is to cover a wider range of areas during the raining process.
This paper aims to address the effects of different preparation methods on inherent fabric anisotropy in the laboratory using dry tamping (DT), MT, dry pluviation (DP) and WP methods. The experimental program consists of two parts. In the first part, the inherent fabric anisotropy was quantified using an image analysis approach (IAA) for the samples prepared using various methods. In the second part, the influence of reconstituted soil samples on the void ratio (e), and relative density (ID ) was studied.
2. Experimental program
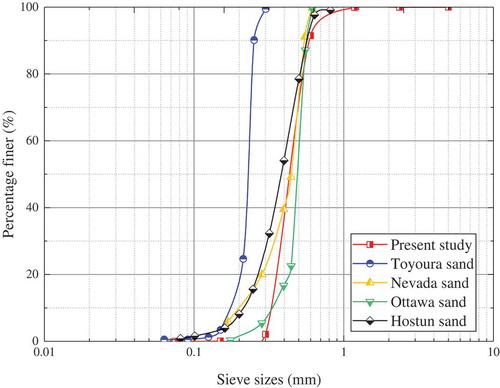
All the samples were prepared using ISO standard sand, which was commercially obtained from a supplier in China. A comparison of the grain size distribution (GSD) curve of ISO sand and those for the standard sands is shown in Figure . It is noted that the gradation of the ISO sand is less well graded. Furthermore, the physical and mineral properties of sands are furnished in Table .
Table 1. Physical and mineral properties of sands
Figure 1. Grain size distributions of the sand samples.
2.1. Sample preparation methods
DT method was conducted on the air-dried sand sample, while the MT method was conducted on the partially saturated sand (~5% of water added to the soil by its mass). A standard mould with a diameter of 88 mm and a height of 84 mm was used to prepare the reconstituted soil specimens using the above-mentioned methods. A tamping rod with the weight of 400 g was used in both cases. The reconstituted soil samples were prepared in 3–5 layers by a free drop height from 10 to 90 mm. In the normal compaction (NC) method, 25 standard number of blows were given to each successive layer, whereas in under compaction (UC) method, by offering light blows to the lower layers when associated with its successive upper layers. These samples were prepared in 3 layers—8, 16 and 25 blows; and 5 layers—5, 10, 15, 20 and 25 blows, respectively.
Pluviation is a renowned and extensively used method for the preparation of reconstituted sand samples in the laboratory. It has several advantages over the tamping and vibratory method of compaction in achieving the uniform density without grain crushing (Lo Presti, Pedroni, & Crippa, Citation1992). The maximum density achieved by pluviation method can be used as a reference point for measuring relative density (Barton & Palmer, Citation1989). DP and WP samples were prepared in the same mould as used for the tamping methods. A schematic diagram of the pluviation equipment used in this study is presented in Figure . In both the cases, the air-dried sand sample was constantly poured through a funnel positioned above the mould, whereas in WP, the mould was completely filled with water up to the brim. The opening size of funnels used was 4, 6 and 8 mm and the mass flow of 4.2, 6.5, 9 g/s, respectively. These funnels are denoted as F1, F2 and F3 in the text, respectively.
Figure 2. Schematic representation of pluviation apparatus.
In the fixed funnel (FF) tests, the samples were prepared by keeping the funnel at fixed height (FH) above the base of the mould, whereas in the FH tests, the samples were prepared by keeping the height of fall constant and slowly rising up the funnel as the sand was poured into the mould. The procedures for reconstituted soil sample preparations are also given in Raghunandan, Juneja, and Hsiung (Citation2012) and Yong et al. (Citation2008).
2.2. Particle orientations and magnitude vector
A random distribution of non-spherical particles possesses statistical characteristics in the spatial distribution. A major axis of elongation can be specified for each particle. Let and
represent the unit vectors parallel, but opposite in direction, to the major axis of orientation. The assembly of these unit vectors of
number of particles in V (volume) in terms of the orientation fabric can show the preferred orientation of non-spherical particles. One can take the average over
to derive an index measure representing the fabric characteristics, called fabric tensor. A second order fabric tensor (Oda, Citation1999) can be defined as:
where the superscript k denotes the k
th of 2 unit vectors. The principal values of F
1 and F
2, corresponding to the principal axes, are given as:
where
in which is the inclination angle of a unit vector of the k
th particle measured in reference to the H1 axis in a representative V~ H1 section, as shown in Figure ). It is noted that the value of Δ mainly depends on the shape and the process of soil deposition. The range of Δ equals unity when all particles are completely parallel. Curray (Citation1956) called the index Δ, is a vector magnitude, which represents the intensity of the fabric anisotropy of preferred orientation of particles considered in the domain. If in Eq. (1),
is replaced by
(number of contacts) and the unit vector representing the major axis of the particles is replaced by contact normal vector (also represented by
for simplicity), then a similar second order tensor is given as:
Figure 3. Measure of particle orientations through the long axis. (a) Preferred particle orientation. (b) Contact normal orientations.
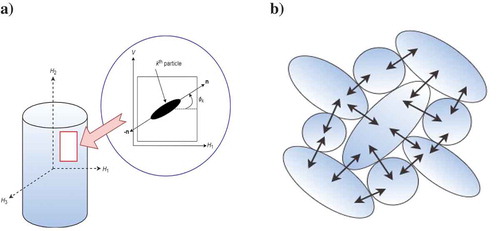
which is also sometimes called as fabric tensor, for describing stress-induced anisotropy (Satake, Citation1982; and Gong, Citation2008). The schematic representation of the contact normal orientations is given in Figure ).
3. Results and discussion
The effects of preparation methods on inherent fabric anisotropy of reconstituted soil samples obtained using various methods are compared and discussed in the following sections.
3.1. Evaluation of inherent fabric anisotropy
Evaluation of the fabric anisotropy of a granular assembly is of utmost importance, yet it is a challenging task and the available experimental methods for quantifying soil fabric anisotropy are very limited. There are several methods in the literature for quantifying the soil fabric anisotropy, among which the method through measuring the electrical properties (i.e. dielectric constant and conductivity) and correlating them with the micro-features of the soils is preferred. However, this kind of method may not always be applicable to granular materials, such as the sandy soils. Therefore, an alternative approach based on the microstructural analysis called an IAA was used and a wide range of applications in the recent investigations on microstructure of the granular soils were quoted (Jang et al., Citation1999; Kuo & Frost, Citation1993; Masad & Muhunthan, Citation2000; Muhunthan, Masad, & Assaad, Citation2000; Rahimi, Chan, Nouri, & Rasouli, Citation2016).
Epoxy resin was used to preserve the internal fabric structure of the soil, and care has been taken during the impregnation and curing process to minimize the disturbance in the sample. According to the previous investigations, loose sand specimens are highly susceptible to the disturbance if the resin has a relatively high viscosity or if significant shrinkage of the resin occurs during curing (Jang et al., Citation1999). Crystal epoxy glue/resin which has a very low viscosity in nature was used to impregnate the particles in this study. After this stage, a diamond saw was used to cut the cured specimen into the desired shape. In addition, grinding and polishing processes were undertaken using a Buehler grinder-polisher. For moist specimens, we allowed the sample to air dry for a couple of hours and then the coupon surface has been prepared.
Typical images which were captured by SEM are presented in Figure . The image contains several hundred particles or so, thus it can be treated as a representative elemental volume(REV) for the analysis. A common method of displaying and interpreting the particle orientations is by line diagrams, where each line represents a particle intersection with the 2D image surface (Bates & Phillips, Citation2000; Engelhardt & Gaida, Citation1963; Foster & De, Citation1971; Nygård, Gutierrez, Høeg, & Bjørlykke, Citation2004; Vasseur et al., Citation1995). This is an appropriate method for getting an overview of the preferred particle orientations across the entire image. However, with a large number of images, identifying individual particles is a very time-consuming process. An automated identification of particles can be achieved using binary images (Whitney & Velde, Citation1993). One of the difficulties in using binary images is the selection of grey level threshold (Figure )) (Tovey & Hounslow, Citation1995). This problem can be enhanced when using SEM images as the initial contrast of the image, which is greatly dependent on the user’s preference. Also, it was suggested that by including an overlap region, particles and voids can be identified, with a margin of errors between the images known as a contact zone (Hu, Yue, Tham, & Wang, Citation2005). The SEM-captured REVs are used for analysis, and each particle is numbered and its orientation was acquired using an open source code ImageJ (Rasband Citation1997–2011). It should be noted that only the vertical section of the specimen is used to analyze the fabric anisotropy, and the degree of anisotropy in the horizontal section is usually much smaller and therefore is not studied further in this paper, see also Yang (Citation2005).
Figure 4. Typical images for analysis. (a) Original SEM micrograph. (b) B/W mask for image analysis. (c) Converted binary image. (d) Outlined skeleton image. (e) Selected filled particles. (f) Numbered particles.
It is obvious that the samples prepared using various methods provide different inherent fabric anisotropy. The angle with respect to the vertical sections in the frequency histogram and polar distribution, illustrations are presented in Figures and (a,b), for DT and MT; and DP and WP methods, respectively. By statistical analysis on REVs of the vertical sections of coupons, the results in terms of the magnitude vector Δ, which were calculated based on Eq. (3), are summarized in Table .
Table 2. Vector magnitudes for the specimens prepared using different methods
Figure 5. Characterization of inherent fabric anisotropy using dry and moist tamping methods. (a) Preferred particle orientation. (b) Contact normal orientations.
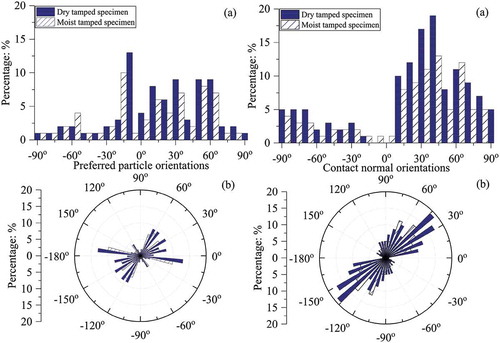
Figure 6. Characterization of inherent fabric anisotropy using dry wet pluviation methods. (a) Preferred particle orientation. (b) Contact normal orientations.
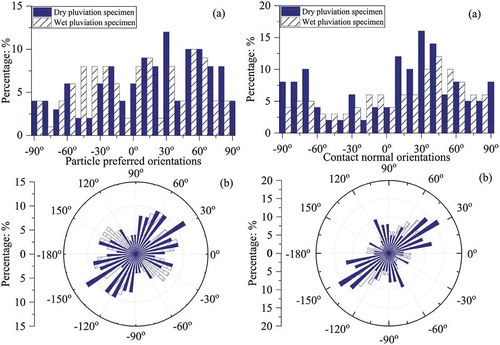
From the analysis of obtained results, pluviated specimens possessed higher degrees of inherent fabric anisotropy than tamping methods. During the raining process of sample preparation, the preferential particle orientation is in the horizontal direction, which was mainly caused by the gravitational force. Among the methods used in this study, DP provides the highest vector magnitude of inherent fabric anisotropy in comparison to all other methods.
3.2. Effects on reconstituted samples
Figure presents the effect of void ratio, e against the falling height of tamper using tamping methods. The concept of loosest and densest state of soils are, in fact, the relative and mechanical responses that mainly depends on the applied stresses. However, the e is a basic approximation of particle packing in an assembly. From the figures, it can be seen that there is no significant effect on e when using different tamping methods, which may be attributed to the fact that the sand used in this investigation is less well-graded.
Figure 7. Effects of tamping method. (a) Dry tamping (DT). (b) Moist tamping (MT).
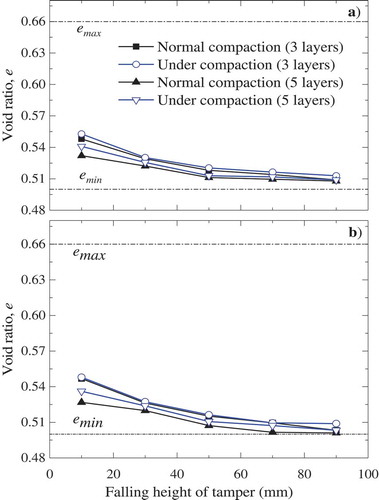
Figure shows the variation of e against the drop height, H obtained using the dry and wet pluviation methods. In the FF tests, the sand particles were poured at a height of 200–600 mm measured from the base. Similarly, in the FH tests, the funnels were progressively raised up to keep the standard drop height of the soil particles in each attempt. Almost similar trends were noticed for the variation of e with changing H in both the methods. Also, the e values were increased with the funnel opening diameter in both the cases. It can be correspondingly seen that in FF and FH tests, the effect of F1 or F2 were not as significant as that of H. If H is significant, these findings seem to be comparable with the samples of different funnels used for the preparation. The average e values in FF and FH tests were noticed to be 0.53 and 0.59 using F1 and F3, respectively.
Figure 8. Effects of pluviation method. (a) Dry pluviation (DP). (b) Wet pluviation (WP).
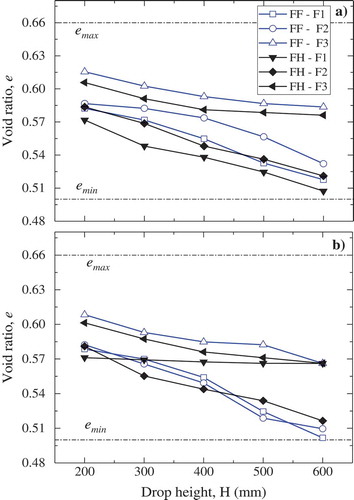
Figure it can be observed that the increase in H, leads to a reduction in e value by 12% using F1 in FF tests. As it can evidently say that the mass—flow and drop height doesn’t effectively influence the packing density. Particle interface during the free fall was extremely small in F1 because of the minimum mass flow. Therefore, the particle packing is more stable and becomes dense. This transformation is analogous to the solution provided by Vaid and Negussey (Citation1988). From Figure , it can be further observed that the drop height and funnel sizes don’t significantly affect the e and the average e in WP methods noticed to be around 0.55. It can be further noticed that based on the coefficients of uniformity and curvatures, the sand considered in this study is less well graded; consequently, the e values are less significant when compared to the study conducted on well-graded sand (Raghunandhan et al., Citation2012).
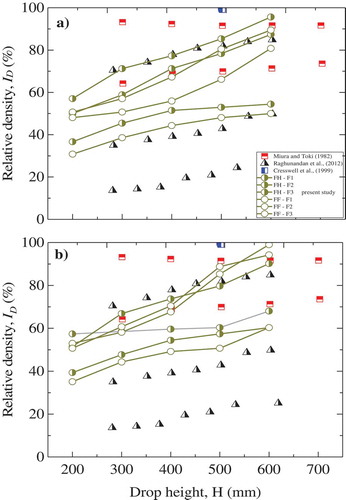
Figure shows the effect of density index, ID against the drop height, H in dry and wet pluviation methods, respectively. In addition to Figure , an approximately linear trend was observed. This is due to the increase in density which led to an increase in further more contacts. An almost similar trend was noticed for the funnel size increased from 4 to 8 mm. Correspondingly, ID doesn’t affect much in FF than FH tests. It can be interestingly pointed out that there was a variation on ID in FH tests compared with FF tests. This can be attributed to the gravity flow of sand which increased initially, whereas linearly decreased as the mould gets filled up with soil. This might affect the ID in both the cases. The figure also indicates the data of Miura and Toki (Citation1982), Cresswell et al. (Citation1999) and Raghunandan et al. (Citation2012) for the mass flow less than 7.7 g/s. However, the current study presents a similar trend of relationship between ID and H as observed by the aforementioned investigators using both the methods.
Figure 9. Effect of relative density on drop height. (a) Dry pluviation (DP). (b) Wet pluviation (WP).
4. Concluding remarks
Based on the experimental observations in the laboratory and the analysis of the obtained results, the following conclusions can be made:
Dissimilar fabrics of commercially obtained sand specimens were prepared and quantified at the micro-scale level in the laboratory. From the experimental observations, it was found that pluviated specimens possessed higher degrees of inherent fabric anisotropy when compared to tamping methods. Among all the methods considered in this study, DP provides the highest degree of inherent fabric anisotropy.
Irrespective of the tamping methods, void ratios are not significantly affected.
The mass-flow and drop height does not significantly influence the packing density. Although, the drop height and funnels sizes do not significantly affect the void ratios in pluviation methods.
Acknowledgements
The authors would like to gratefully acknowledge the financial support from National Natural Science Foundation of China (Grant No: 51578499) and Xi’an Jiaotong – Liverpool University (RDF-15-01-38 and RDF-14-02-44). Also, the authors thank Prof. Kristian Krabbenhoft at University of Liverpool (UK) and Prof. Zhongxuan Yang at Zhejiang University (China) for their support in the work described here.
Additional information
Funding
Notes on contributors
Guobin Gong
Guobin Gong is a lecturer in civil engineering at Xi’an Jiaotong-Liverpool University (XJTLU) in China. His research areas focus on constitutive behaviour of engineering materials, micromechanics of granular materials, soil liquefaction, composite concrete-steel materials, variational principles, continuum mechanics, linear and nonlinear finite element method (FEM), discrete element method (DEM) etc. He works on projects related to short-circuit effects on dynamical behaviour of substation structures, human/vehicles induced vibration, DEM simulations of soil behaviour, numerical simulations (FEM and DEM) of concrete. This paper is part of work related to a project relevant to DEM simulations of soil behaviour (experimental part), in collaboration with Zhejiang University.
Related Research Data
References
- Amini, F. , & Qi, G. Z. (2000). Liquefaction testing of stratified silty sands. Journal Geotech and Geoenv Engineering , 126(3), 208–217. doi:10.1061/(ASCE)1090-0241(2000)126:3(208)
- Barton, M. E. , & Palmer, S. N. (1989). The relative density of geologically aged, British fine and fine-medium sands. Quarterly Journal of Engineering Geology. , 22, 49–58. doi:10.1144/GSL.QJEG.1989.022.01.04
- Bates, C. R. , & Phillips, D. R. (2000). Multi-component seismic surveying for near surface investigations: Examples from central wyoming and southern England. Journal App Geoph , 44, 257–273. doi:10.1016/S0926-9851(99)00017-8
- Casagrande, A. (1975). Liquefaction and cyclic deformation of sands: a critical review. In proceedings of the Pan-American conference on soil mechanics and foundation engineering. Buenos Aires , 5, 79–133.
- Castro, G. (1969), Liquefaction of sands (Ph.D. thesis), Harvard University, Cambridge, Mass.
- Chang, N. Y. , Hseih, N. P. , Samuelson, D. L. , & Horita, M. (1981), Static and cyclic behaviour of monterey #0 sand, In Proceedings of the 3rd Microzonation Conference , Seattle, Wash., 929–944.
- Cresswell, A. , Barton, M. E. , & Brown, R. (1999). Determining the maximum density of sands by pluviation. Geotechnical Testing Journal, ASTM , 22(4), 324–328. doi:10.1520/GTJ11245J
- Curray, J. R. (1956). The analysis of two-dimensional orientation data. Journal of Geo-Engineering Sciences , 64(2), 117–131. doi:10.1086/626329
- Dave, T. N. , & Dasaka, S. M. (2012). Assessment of portable travelling pluviator to prepare reconstituted sand specimens. Geomech Engineering , 4(2), 79–90. doi:10.12989/gae.2012.4.2.079
- Engelhardt, W. V. , & Gaida, K. H. (1963). Concentration changes of pore solutions during the compaction of clay sediments. Journal of Sedim Petr , 33, 919–930. doi:10.1306/74D70F74-2B21-11D7-8648000102C1865D
- Foster, R. H. , & De, P. K. (1971). Optical and electron microscopic investigation of shear induced structures in lightly consolidated (soft) and heavily consolidated (hard) kaolinite. Clays and Clay Minerals , 19, 31–47. doi:10.1346/CCMN.1971.0190104
- Gong, G. (2008), DEM simulations of drained and undrained behaviour , Ph.D. thesis, Univ. of Birmingham, UK.
- Hariprasad, C. , Rajashekhar, M. , & Umashankar, B. (2016). Preparation of uniform sand specimens using stationary pluviation and vibratory methods. Geotechnical and Geological Engineering , 34, 1909–1922. doi:10.1007/s10706-016-0064-0
- Hu, R. L. , Yue, Z. Q. , Tham, L. G. , & Wang, L. C. (2005). Digital image analysis of dynamic compaction effects on clay fills. Journal of Geotec and Geoenv Engineering , 131, 1411–1422. doi:10.1061/(ASCE)1090-0241(2005)131:11(1411)
- Jang, D. J. , Frost, J. D. , & Park, J. Y. (1999). Preparation of epoxy impregnated sand coupons for image analysis. Geotechnical Testing Journal , 22(2), 147–158.
- Khari, M. , Anuar Kassim, K. , & Adnan, A. (2014). Sand samples preparation using mobile pluviator. Arabian Journal of Science and Engineering , 39, 6825–6834. doi:10.1007/s13369-014-1247-8
- Kuo, C. Y. , & Frost, J. D. (1993). A revised methodology to minimize bias in determining the porosity and void tensor of particulate media. In Frost & Wright (eds), Digital image processing: Techniques and applications in civil engineering (pp. 186–194). New York: ASCE.
- Kuo, C. Y. , & Frost, J. D. (1996). Uniformity evaluation of cohesionless specimens using digital image analysis. Journal of Geotech and Geoenv Engineering ASCE , 122(5), 390–396. doi:10.1061/(ASCE)0733-9410(1996)122:5(390)
- Ladd, R. S. (1974). Specimen preparation and liquefaction of sands. Journal of Geotech and Geoenv Engineering ASCE , 100(10), 1180–1184.
- Li, Y. , Yang, Y. , Yu, H.-S. , & Roberts, G. (2018). Effect of sample reconstitution methods on the behaviors of granular materials under shearing. Journal of Testing and Evaluation , 46, 20170126. doi:10.1520/JTE20170126
- Lo Presti, D. C. F. , Pedroni, S. , & Crippa, V. (1992). Maximum dry density of cohesionless soils by pluviation and by ASTM D4253-83: A comparative study. Geotech Testing Journal , 15(2), 180–189. doi:10.1520/GTJ10239J
- Marcuson, W. F. I. I. I. , & Gilbert, P. A. (1972), Earthquake liquefaction potential at Patoka Dam, Indiana. U.S. Army Waterways Experiment Station, Vicksburg, Miss., Miscellaneous Paper S-72-42
- Masad, E. , & Muhunthan, B. (2000). Three-Dimensional characterization and simulation of anisotropic soil fabric. Journal of Geotech and Geoenv Engineering ASCE , 126(3), 199–207. doi:10.1061/(ASCE)1090-0241(2000)126:3(199)
- Miura, S. , & Toki, S. (1982). A sample preparation method and its effect on static and cyclic deformation strength properties of sand. Soils and Foundations , 22(1), 61–77. doi:10.3208/sandf1972.22.61
- Muhunthan, B. , Masad, E. , & Assaad, A. (2000). Measurement of uniformity and anisotropy in granular materials. Geotechnical Testing Journal , 23(4), 423–431. doi:10.1520/GTJ11063J
- Nygård, R. , Gutierrez, M. , Høeg, K. , & Bjørlykke, K. (2004). Influence of burial history on microstructure and compaction behaviour of kimmeridge clay. Petroleum Geoscience , 10, 259–270. doi:10.1144/1354-079303-591
- Oda, M. (1999). Fabric tensor and its geometrical meaning. In M. Oda & K. Iwashita (eds), Introduction to mechanics of granular materials (pp. 27–34). Rotterdam: A.A. Balkema.
- Oda, M. , Koishikawa, I. , & Higuchi, T. (1978). Experimental study of anisotropic shear strength of sand by plane strain test. Soils and Foundations , 18(1), 25–38. doi:10.3208/sandf1972.18.25
- Raghunandan, M. , Juneja, A. , & Hsiung, B. (2012). Preparation of reconstituted sand samples in the laboratory. International Journal of Geotechnical Engineering , 6(1), 125–131. doi:10.3328/IJGE.2012.06.01.125-131
- Rahimi, M. , Chan, D. , Nouri, A. , & Rasouli, R. (2016). Effects of inherent fabric anisotropy and intermediate principal stress on constitutive behavior of uncemented and cemented sands. Computers and Geotechniques , 80, 237–247. doi:10.1016/j.compgeo.2016.08.024
- Rasban, W. S. (1997–2011), ImageJ, US National Institutes of Health, Bethesda, Maryland, USA Retrieved January 05, 2018, from http://image.nih.gov/ij/
- Satake, M. (1982), Fabric tensor in granular materials, IUTAM Conference on Deformation and Failure of Granular Materials, Balkema, Delft, 63–68.
- Sladen, J. A. , D’Hollander, R. D. , & Krahn, J. (1985). The liquefaction of sands, a collapse surface approach. Canadian Geotechnical Journal , 22, 564–578. doi:10.1139/t85-076
- Tovey, N. K. , & Hounslow, M. W. (1995). Quantitative micro-porosity and orientation analysis in soils and sediments. Journal of the Geological Society, London , 152, 119–129. doi:10.1144/gsjgs.152.1.0119
- Vaid, Y. P. , & Negussey, D. (1988). Preparation of reconstituted sand specimens. In R. Donaghe , R. Chaney , & M. Silver (Eds.), Advanced triaxial testing of soils and rock (pp. 405–417). American Society for Testing and Materials, Special Technical Publication STP 977.
- Vaid, Y. P. , & Sivathayalan, S. (2000). Fundamental factors affecting liquefaction susceptibility of sands. Canadian Geotechnical Journal , 37(3), 592–606. doi:10.1139/t00-040
- Vaid, Y. P. , Uthayakumar, M. , Sivathayalan, S. , Robertson, P. K. , & Hofmann, B. (1995). Laboratory testing of syncrude sand. In Proceedings of the 48th Canadian Geotechnical Conference, Vancouver , 1, 223–232.
- Vasseur, G. , Djeran-Maigre, I. , Grunberger, D. , Rousset, G. , Tessier, D. , & Velde, B. (1995). Evolution of structural and physical parameters of clays during experimental compaction. Marine and Petroleum Geology , 12, 941–954. doi:10.1016/0264-8172(95)98857-2
- Whitney, G. , & Velde, B. (1993). Changes in particle morphology during illitization: An experimental study. Clays and Clay Minerals , 41, 209–218. doi:10.1346/CCMN.1993.0410209
- Yang, Z. X. (2005), Investigation of the fabric anisotropic effects on granular soil behavior , A PhD dissertation, The Hong Kong University of Science and Technology. Retreived from http://hdl.handle.net/1783.1/2593
- Yang, Z. X. , Li, X. S. , & Yang, J. (2008). Quantifying and modelling fabric anisotropy of granular soils. Geotechnique , 58(4), 237–248. doi:10.1680/geot.2008.58.4.237
- Yoshimi, Y. , Tokimatsu, K. , & Phara, J. (1994). In situ liquefaction resistance of clean sands over a wide density range. Geotechnique , 44(3), 479–494. doi:10.1680/geot.1994.44.3.479