
 ?Mathematical formulae have been encoded as MathML and are displayed in this HTML version using MathJax in order to improve their display. Uncheck the box to turn MathJax off. This feature requires Javascript. Click on a formula to zoom.
Abstract
Conversion of wastes to energy needs serious attention to boost energy supply and reduce environmental pollution. Biogas yields were obtained from co-digestion of cattle dung with sunflower leaves, pawpaw and potato peels at different compositions in four biogas digesters (A, B, C and D). The substrates were mixed with water in ratio 1:2 and left for a 40-day retention time. Proximate analysis of the substrates, volumeand quality of the biogas was determined. Analysis of variance was carried out to show significance of time and temperature over biogas yield. Results revealed that the total volumeof biogas and methane content from digester A, B, C and D were 46.64, 45.80, 39.55 and 38.02 m3, and 71.82%, 53.71%, 66.80% and 52.70%, respectively. Retention time and temperature, at significance level of 0.05, were found to be significant in biogas production. Also, there was high methane contents in the biogas produced.
PUBLIC INTEREST STATEMENT
This study investigated the potential of sunflower leaves, pawpaw and potato peels for production of biogas when co-digested with cattle dung under anaerobic condition in four cylindrical biogas digesters with varied feedstock compositions. This was done in order to determine the composition which would produce the highest volumeof biogas and methane. This method ensured that quality methane with high heating value was obtained from anaerobic digestion of these wastes. The cumulative volumeof biogas collected from the anaerobic digestion revealed that production of gas took place every day. This system can be used to utilize livestock manure, such as cow dung, pig dung, poultry litters and agricultural residues, converting them into useful biogas. The digesters are easy to construct and can be designed in larger capacities to accommodate domestic and on-farm wastes for biogas production.
1. Introduction
Livestock manure like cow dung in the absence of appropriate disposal methods can cause adverse environmental and health problems, such as pathogen contamination, odour, airborne ammonia, greenhouse gases and others (Harikishan & Sung, Citation2003). Several archaic and environment unfriendly methods of waste management have been employed in the time past, such as dumping of refuse in a landfill or dunghill which causes odour, empting of refuse in a drainage, which causes erosion and flood and burning of refuse which can cause release of greenhouse gases with attendant adverse effects on agricultural plantations.
According to BioEnergy Consult (Citation2018), anaerobic digestion is a unique treatment solution for animal manure as it can deliver positive benefits that are related to generation of renewable energy, eradication of water pollution and reduction of odorous gaseous emissions. Anaerobic digestion of animal manure is attaining recognition as a means to secure our environment and to reprocess fertile input materials into the farming systems. The creation of anaerobic digestion systems for energy production from livestock waste and stabilization of manure has increased significantly in the past few years. The commercialization of efficient digesters for livestock facilities is growing in Europe, United States, Asia and elsewhere in the world (BioEnergy Consult Citation2018). Biodigester plants, which are used for anaerobic digestion of cow manure, are highly efficient in capturing the unused renewable energy potential of organic waste by converting the biodegradable part of the waste into high calorific gas called biogas.
Biogas is a mixture of different gases produced as a result of the biodegrading actions of anaerobic microorganisms on domestic and agricultural residues (Ezeonu, Dioha, & Eboatu, Citation2005). It usually contains 50% and above methane and other gases in relatively low proportions, namely carbon dioxide (CO2), hydrogen (H2), nitrogen (N2) and oxygen (O2) (Kalia, Sonakya, & Raizada, Citation2000). The mixture of the gases is combustible if the methane content is more than 50% (Agunwamba, Citation2001). The benefits of biogas technology cannot be overemphasized. A well-functioning biogas system can yield a whole range of benefit for their users, the society and the environment in general. It is being used in the production of energy such as heat, light, electricity and others (Ramachandra, Krishna, & Shruthi, Citation2005). Biogas production helps in transformation of organic waste into high-quality fertilizer or manure and thereby improves the hygienic conditions of the environment through reduction of pathogens, worm eggs and flies (Singh, Singh, Araujo, Ibrahim, & Sulaiman, Citation2011). It also reduces the work load in collection of firewood for cooking and improves the environment through protection of soil, water, air and woody vegetation.
Certain factors like co-digestion and pretreatment of feed substrate can lead to increased biogas yield through improvement of the anaerobic digestion process (Quiroga et al., Citation2011). Application of co-digestion technology has the potential to create green jobs and also helps in waste management (Deressa, Libsu, Chavan, Manaye, & Dabassa, Citation2015). Co-digestion involves simultaneous anaerobic digestion of more than one type of residue in the same unit (Agunwamba, Citation2001). Co-digestion is often applied with the sole intention of improving the biogas yield and quality by increasing the methane content production from substrates that generally have low yields and initiating other process parameters that favour the methanogenic bacteria (Salunkhe & Paranjpe, Citation2015).
Optimization of anaerobic digestion is a common pathway to increase the waste-to-energy self-sufficiency. Several research efforts to improve biogas production process efficiency, stability and economic competitiveness from wastes have shown that anaerobic digestion of mixed feedstocks increases biogas production, enhanced degradation rates and higher digester capacity (Aichinger et al. Citation2015; Labatut, Angenent, & Scott, Citation2014). In this regard, many types of biowaste with high methanogenic potential are being selected to be mixed with cow dung or sewage sludge for biogas production through anaerobic co-digestion process. The advantages of co-digestion include better digestibility, enhanced biogas production/methane yield, arising from availability of additional nutrients, as well as a more efficient utilization of equipment and cost sharing (Agunwamba, Citation2001; Mshandete & Parawira, Citation2009; Parawira, Murto, Zvauya, & Mattiasson, Citation2004). Substrates like cow manure, poultry waste, pig waste and food waste are normally used for co-digestion and have been reported to increase the methane yield (Callaghan et al. 2002). Co-digestion of food waste and manure has been observed to enhance biogas production and also leads to more stable digestion processes (Agyeman et al. Citation2014; Zhang et al. Citation2013). The improved methane production and digestate quality are achieved through optimal feeding blend ratio of feedstocks that can facilitate synergetic interactions (Tsapekos, Kougias, Treu, Campanaro, & Angelidaki, Citation2017).
The increasing demand of biogas as a household fuel for daily use necessitates that technology for co-digestion from readily available plants and agricultural residues should be developed. This is to improve the retention days, enhance larger volumeproduction and quality (in term of cleanliness) of the methane gas, which is the essence of this study. Information about substrates is strongly demanded by biogas plant operators and future investors. Research works are, therefore, targeted towards examining reachable degradation rates and methane yields in anaerobic digestion and co-digestion processes of mixtures of different waste fractions that are peculiar to different regions (Thorin, Ahrens, Hakalehto, & Jaaskelainen, Citation2013).
Previous research works accessible were not based on pawpaw peels, potato peels and sunflower leaves and their co-digestion. The tropical rain forests of Africa continent favour the production of pawpaw plant, potatoes crop and the heavy growth of sunflower plant. The peels of pawpaw and potatoes constitute serious nuisance waste to our environmental serenity and sanctity. Similarly, since sunflower are always readily and heavily available especially during rainy season, if these wastes favourably yield high-quality biogas, it will be of great advantage to meet up with the great energy demand of the society. The study presents the quality biogas yields from co-digestion of pawpaw peels, potato peels and sunflower leaves with cattle dung.
2. Materials and methods
2.1. Operation of biogas digester
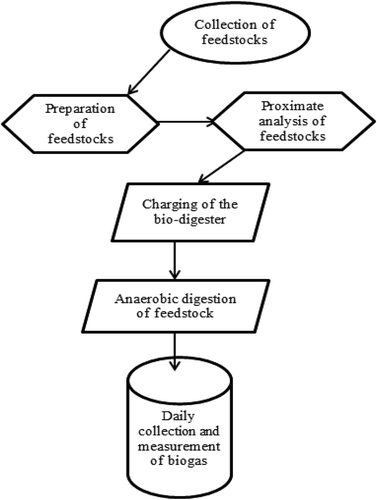
The biodigester designed for the anaerobic digestion is a simple, manually operated vertical cylinder. The bioreactor was designed in such a way to provide suitable condition for fermentation, gas collection, temperature and pressure measurement and pH probes, inlet hole for feeding substrate, outlet hole for flushing out the spent materials which can be used as manure. Airtightness of the biodigester was ensured. The digester was made of mild steel owing to its high strength, corrosion resistance and availability. The setup scheme for biogas production is shown in Figure .
Figure 1. Set-up scheme for biogas production.
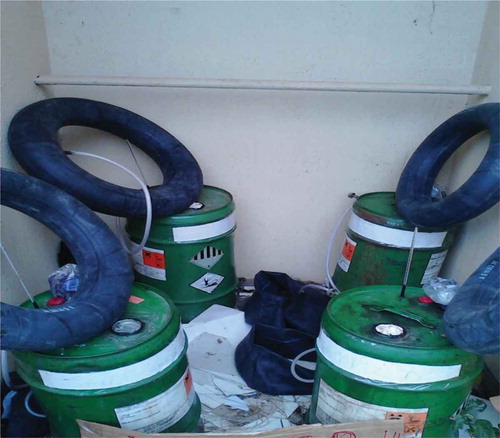
The digester plant is cylindrical. It is made of mild steel because of its corrosion resistant ability. It has a height and diameter of 640 and 320 mm, respectively. It has the capacity to hold an average of 0.052 m3 of co-substrates for co-digestion. It has an inlet pipe of 65 mm diameter. The slurry outlet is 65 mm diameter and located at the base of the plant. It has a gas outlet of 10 mm diameter. The digester is manually agitated every day to break the hard scum formed on the surface of the slurry inside the digester and ensure continuous production of gas. The cover of the digester is circular and has a diameter of 320 mm. The cover is permanently closed to ensure airtightness within the digester. The pressure gauge and thermometer are also fixed to the top of the digester via a hole of 6 mm diameter. These are specifically designed to allow measurement of internal temperature and pressure. The pictorial view of the biodigester with gas collection tubes is shown in Figure .
Figure 2. Pictorial view of the biodigester with gas collection tubes.
2.2. Material preparation
Fresh cattle dung was collected from the feedlot of slaughter houses. Fresh pawpaw peels and potatoes peels were obtained freshly peeled. The cattle dung was collected in a big open container to prevent methanogenesis because anaerobic digestion process can easily be initiated in a confined place where there is absence of air. The fresh sunflower leaves were collected from their plants. This research work employed batch test approach. It was a discontinuous test in which organic co-substrates (cattle dung, pawpaw peels, potatoes peels and sunflower leaves) were subjected to fermentation under defined anaerobic conditions. Gas yields were obtained and proximate analysis of cattle dung, pawpaw peels, potatoes peels and sunflower leaves was done to determine their chemical composition.
2.3. Experimentation
The experimental procedure of this research work was done using four digesters (A, B, C and D) of the same design. These were simultaneously set up and observed concurrently under the same ambient temperature and pressure. The set-up is a batch-feeding type. The usage of four digesters in this study was to vary the mass composition of sunflower leaves, pawpaw and potato peels co-digested with cow dung in order to achieve an optimized biogas yield. In the first digester (digester A), which contained 5 kg of cattle dung, 2 kg of pawpaw peels, 2 kg of potatoes peels and 2 kg of sunflower leaves, the wastes were mixed with water in ratio 1:2 of waste to water and the slurry is properly stirred. The slurry was charged into the digester through the inlet pipe of the digester and closed immediately after charging. All the valves and the screw pipe on the gas outlet and slurry outlet were also closed. The working volumeof the bioreactor was maintained at about 350 l and run under uncontrolled pH, which was without acid or base addition.
The daily ambient and slurry temperatures were measured at 1 p.m. daily using thermometer (−10 to 1,100). Similarly, the daily ambient and slurry pressure were measured at the same time. The experimental set-up was then left for a period of 30–40 days retention time as suggested by Ostrem (Citation2004). Immediately gas production began, collection of biogas commenced using tyre tubes which has been properly fixed to the gas outlet from the digester and the direct volumeof daily biogas generated was obtained using Equations (1)–(3) (Yaru, Adewole, & Adegun, Citation2013).
where R o is the specific gas constant of a gas (J/kg K), R is the universal gas constant (J/kg K), M is the molecular mass of the gas concerned, R o mixture is the total specific gas constant of the assumed biogas composition (i.e. CH4 and CO2), P e is the estimated daily pressure of the digester, T digester is the estimated daily temperature in °C of the digester and V is the volumeof biogas generated in m3.
After the digester has been operated for a while, the volumeof gas production reduced slightly. Therefore, some effluent slurry was removed and re-entered at the charging opening, and this tends to buffer the slurry inside the digester and gas production resumes soon. In the second digester (digester B), 5 kg of cattle dung, 3 kg of pawpaw peels, 1 kg of potatoes peels and 2 kg of sunflower’s leaves were mixed with water in ratio 1:2 of waste to water and the substrates were properly mixed and charged into the second digester such that the total weight of solid waste and water equals to that of the first batch and retention day and gas collection method was the same. Similarly, in the third digester (digester C), 5 kg of cattle dung, 2 kg of pawpaw peels, 3 kg of potatoes peels and 1 kg of sunflower’s leave were mixed with water in ratio 1:2 of waste to water and co-digested. In the fourth digester (digester D), 5 kg of cattle dung, 1 kg of pawpaw peels, 2 kg of potatoes peels and 3 kg of sunflower’s leave were mixed with water in ratio 1:2 waste to water and co-digested. All the measurements and gas collection was taken in the same way as in digester A.
Summarily, digester A had a percentage composition of 45.45% cattle dung, 18.18% pawpaw peels, 18.18% potatoes peels and 18.18% sunflower leaves. Digester B had 45.45% cattle dung, 27.27% pawpaw peels, 9.09% potatoes peels and 18.18% sunflower leaves composition. Digester C contained 45.45% cattle dung, 18.18% pawpaw peels, 27.27% potatoes peels and 9.09% sunflower leaves. Digester D composed of 45.45% cattle dung, 9.09% pawpaw peels, 18.18% potatoes peels and 27.27% sunflower leaves.
2.4. Determination of biogas and methane yields from fresh mass and organic dry matter
Throughout the retention period, volumeof biogas produced (m3); ambient pressure (mbar) and ambient temperature (°C) were taken daily. The quantity of biogas yield was computed at standard temperature and pressure conditions (273.15 K and 1,013.25 mbar). The gas factor (F) was calculated and the fresh mass biogas and methane yields were determined as well. The gas factor (F) was calculated according to the following equation (VDI Citation4630Wuff, 2004):
where T o = 273.15 K (standard temperature), t = gas temperature in °C, P o = 1,013.25 mbar (standard pressure) and P = air pressure.
The vapour pressure of water is dependent on the gas temperature and amounts to 23.4 mbar for 20°C. The respective vapour pressure of water as a function of temperature for describing the range between 15 and 30°C is given in the following equation:
where yo =-4.3905;a=9.762 and b=0.0521
The normalized amount of biogas volumeis given as
Normalized by the amount of biogas, the amount of gas taken off the control batch is given as
The standard mass of biogas yield in litres/kg Fresh Mass (FM) is based on the weight.
The followings apply:
1 standard ml/g FM = 1 standard l/kg FM = 1 m3/t FM
The organic dry matter (ODM) biogas yield is based on the percentage of volatile solids in substrate:
2.5. Proximate analysis
The proximate analysis of the substrates in each digester was carried out. The chemical analysis of the substrates was carried out two times and the average value gave the chemical composition for each of the selected wastes. A top loading balance (50 kg capacity, “five goat models no Z051599”) was used to measure the water and the waste masses. The composition of the flammable biogas produced from each of the waste was analysed.
2.6. Statistical analysis
Design-Expert 8.0.7.1 software was used to analyse the biogas yields from the four digesters and to estimate their analysis of variance (ANOVA) and R-squared value using response surface linear model. A user-defined design which involved three categorical factors and four responses was used to set up the experimental biogas production data. The three categorical factors are ambient temperature (A), ambient pressure (B) and retention day (C), while the four responses are fresh mass biogas yield (FMBY), organic dry matter biogas yield, (ODMBY), fresh mass methane yield (FMMY) and organic dry matter methane yield (ODMMY).
3. Results and discussions
The daily volumeof biogas production from all the digesters including the temperature and pressure readings are included in the Appendices A and B.
3.1. Chemical analysis of pawpaw and potatoes peels, cattle dung and sunflower leaves
The results of chemical analysis of the substrates are shown in Table .
Table 1. Chemical analysis of pawpaw peels, cattle dung, sunflower leaves and potatoes peels on wet basis
3.2. Carbon–nitrogen ratios of the selected wastes
The carbon–nitrogen (C/N) ratio of the substrates was obtained from the chemical analysis. Pawpaw peels had the highest C/N ratio of 28, followed by potatoes peels (26.88). Sunflower leaves had 20.34 while cattle dung had the least of 8.16. Generally, all the four selected waste had very high C/N ratio and their co-digestion formed an excellent mixture of substrates for biogas production. This confirms the submission of Santosh, Sreekrishnan, Kohli and Rana (Citation2004) that during anaerobic digestion, microorganism utilizes carbon 25–30 times faster than nitrogen; therefore, microbes need a Carbon to Nitrogen ratio between 20:1 - 30:1 with the largest percentage of the carbon being readily degradable. Similarly, Verma (Citation2002) ascertained that optimum C/N ratio of the substrates can be achieved by mixing materials of high and low C/N ratios such as organic solid waste mixed with sewage or animal manure and the selected wastes in this research show a good mixture.
3.3. The FMBY
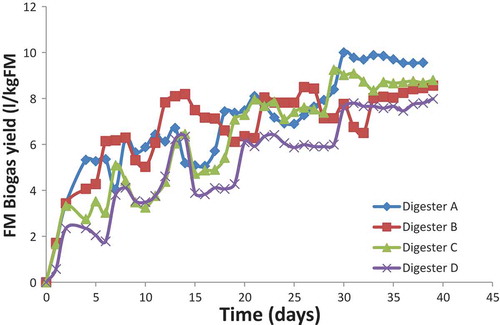
It was observed that all the digesters showed a relative increase in the FMBY as shown in Figure . At the first 10 days of incubation, digester B yielded highest, followed by digester A. Digester D yielded the least biogas over this period. From 15 to 30 days of incubation period, FMBY of digester B dropped due to a noticeable pressure drop while the yield from digester A increased rapidly. At the end of 40 days of incubation, digester A produced highest FMBY, followed by digester C. The biogas yield next to C is from digester B while digester D produced the least yield in the overall. Similar biogas yield results were obtained from co-digestion of biomass wastes with pig manure and cow dung by Poulsen and Adelard (Citation2016), Koch, Helmreich and Drewes (Citation2015) and Mao, Feng, Wang and Ren (Citation2015).
Figure 3. Fresh mass biogas yield.
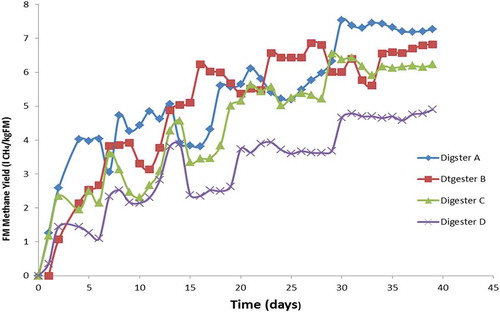
3.4. FMMY
A steady increase in FM methane yield was recorded from all the digesters as shown in Figure . In the first 10 days of incubation, digester A showed rapid and highest FM methane yield followed by digester B. Next to digester B is digesters C and D, respectively. The steady sinusoidal form of graph pattern was due to unstable rise and fall weather condition of the atmosphere which drastically causes the rise and fall in temperature and pressure of both the digester and the environment, because temperature and pressure are principal determining factors of biogas production under anaerobic condition (Ostrem Citation2004). At the end of the 40 days of retention time, digester A produced highest FMMY, followed by digester B, C and D, respectively. The values obtained for methane yield from the co-digestion were similar and comparable to observations in earlier studies (Poulsen & Adelard, Citation2016; Zamanzadeh, Hagen, Svensson, Linjordet, & Horn, Citation2017).
Figure 4. Fresh mass methane yield.
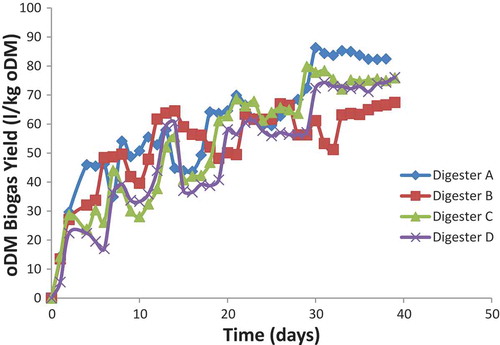
3.5. ODMBY
All the digesters showed a good increase in the ODM biogas yield as shown in Figure . At the first 8 days of incubation, they rapidly increased in biogas yield with the digester B having the highest yield, followed by digester A. Digester D showed least yield while digester C showed yield next to digester A. The rising and falling pattern in the graph was due to imbalance in atmospheric conditions. Each time precipitations occurred, there was drastic fall in temperature in both the atmospheric and digester temperature. Cumulatively at the end of 40 days retention period, digester A produced highest ODM biogas yield which was followed by digester D. Next to digester D in ODM, biogas yield was digester C while digester B produced the least ODM biogas yield. Observed values of ODMBY were matching with results from similar studies (Koch et al., Citation2015; Mao et al., Citation2015; Poulsen & Adelard, Citation2016).
Figure 5. Organic dry matter biogas yield.
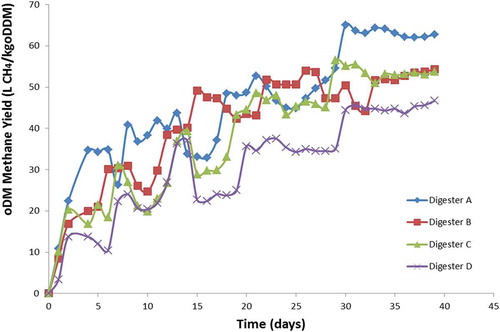
3.6. ODMMY
It is shown in Figure that all the digesters steadily increased in ODM methane yield throughout the incubation period. However, digester A shows highest ODM methane yield in the first 15 days of incubation period. Between incubation periods of 10–15 days, digesters C and D showed equal ODM methane yield. The fluctuating atmospheric temperature and pressure affected all the digesters in the same way. At the end of the 40 days of retention time, digester A produced highest ODM methane yield, followed by digesters B, C and D, respectively. The highest yield of the digester A was due to uniform composition of the substrates co-digested in the digester while digester D yielded least because sunflower which had largest percentage by mass in substrate composition of digester D had the lowest % organic dry matter content and %fibre, compared with pawpaw peels and potatoes peels which were major constituents in the other digesters. The results obtained for ODMMY from the co-digestion were similar and comparable to values obtained from similar research studies by Poulsen and Adelard (Citation2016) and Zamanzadeh et al. (Citation2017).
Figure 6. Organic dry matter methane yield.
3.7. Quality of biogas generated
Several samples of the biogas generated from each of the four digesters were collected and analysed and the average values of the components of their biogas are given in Table . It can be clearly seen that digester A had the highest methane content of 71.82% and lowest carbon dioxide content of 23.43%. The absence of oxygen shows the spontaneous digestion of the feedstock. The remaining impurities are at lowest minimum. This implies that from the four biogas samples, biogas from digester A is the purest, this shows that the mixture of the pawpaw peels, potatoes peels and sunflower leave that are uniform (2 kg each) actually improved methane yield in biogas production. This is due to the high C/N ratios and the high ODM of both pawpaw and potato peels (Anunputtikul & Rodtong Citation2004).
Table 2. Composition of biogas generated by percentage volume
Also, digester C had a high-quality methane content of 66.80% and carbon dioxide content of 27.59% next to digester A. It is relatively purer compare with biogas generated from digesters B and D. This is due to higher percentage of potatoes peels (3 kg) in digester C than in digesters B and D. It can be concluded that potato had higher dry matter, carbon content and ammonium–nitrogen content than pawpaw peels and sunflower leaves, which favoured the high methane content in digester C than in digesters B and D.
In addition, digester B had an average methane content of 53.71% and carbon dioxide content of 32.59%. Its water content is higher than that of biogas generated from digesters A and C, this is due to higher percentage content of pawpaw peels (27.27%) in the substrate mixture of digester B. The methane content of the biogas generated in the digester D was the lowest from all the selected substrates considered. It had methane content of 52.70% and highest carbon dioxide content of 33.22% compared with the other selected substrates. It shows that the presence of greater percentage of sunflower leaves reduced the methane content and increases impurities in the biogas yield.
3.8. Statistical analysis
ANOVA for FMBY, FMMY, ODMBY and ODMMY are presented in Tables –, respectively. From Table , digesters A, B, C and D showed that the model used is significant for all the digesters with model F-values 58.44, 20.82, 82.45 and 69.71 for digesters A, B, C and D, respectively. Also, at 95% significant level, that is at prob > F less than 0.0500, it was revealed that only retention days was a significant factor for FMBY of co-digested substrates in digester A, C and D while the significant factors for FMBY of co-digested substrates in digester B are temperature and retention days. As shown in Table , the analysis model is significant with F-values 58.47, 43.97, 82.47 and 69.75 for digesters A, B, C and D, respectively. At prob > F less than 0.0500 significant level, only retention day is significant for FMMY for the digesters A, C and D while temperature and retention day are significant for FMMY of Digester B.
Table 3. ANOVA for FMBY
Table 4. ANOVA for FMMY
Table 5. ANOVA for ODMBY
Table 6. ANOVA for ODMMY
ANOVA for ODMBY as presented in Table shows that the model for the analysis of the results is significant with F-values 58.44, 20.82, 82.45 and 69.71 for digesters A, B, C and D respectively. At prob > F less than 0.0500 significant level, retention days is the only significant factor for ODM Biogas yield of substrates co-digested in the digesters A, C and D, while temperature and retention days are significant factors for ODM Biogas yield in the Digester B. Also, Table revealed that the models for ODMMY are all significant for all the four digesters with F-values, 58.47, 43.97, 82.47 and 69.75. At significant level of prob > F less than 0.0500, retention day is the only significant factor for ODMMY in digesters A, C and D while temperature and retention day are significant for ODMMY in digester B.
The adjusted R-squared values for FMBY from digesters A, B, C and D are 0.8154, 0.6039, 0.8624 and 0.8409, respectively while their predicted R-squared values are 0.7684, 0.5344, 0.8394 and 0.8184 for FMBY from digesters A, B, C and D, respectively. There is reasonable agreement between adjusted R-squared and predicted R-squared, since their difference is less than 0.2. However, digester C (45.45% cattle dung, 18.18% pawpaw peels, 27.27% potatoes peels and 9.09% sunflower leaves) shows highest adjusted R-square value which implies highest FMBY followed by digester D (45.45% cattle dung, 9.09 pawpaw peels, 18.18% potatoes peels and 27.27% sunflower leaves), then next to digester D is digester A (45.45% cattle dung, 18.18% pawpaw peels, 18.18 potatoes peels and 18.18% sunflower leaves). Digester B shows the least adjusted R-square value, hence least FMBY from the four digesters.
The statistical model values of FMMY for the four digesters showed reasonable agreement between their predicted-squared and adjusted R-squared values. Digester C had highest adjusted R-squared value of 0.8624, hence highest FMMY, followed by digester D with adjusted R-squared value of 0.8410. This is followed by digester A while the least FMMY is from digester B. There was reasonable agreement between the adjusted R-squared and predicted R-squared of ODMBY. Digester C had highest adjusted R-squared values of 0.8624 hence, highest ODMBY, while digester D followed digester C, with 0.8409 adjusted R-squared values. Next to digester C is digester A with adjusted R-squared value of 0.8154. Digester B had least ODMBY with adjusted R-squared value of 0.6039. Also, the adjusted R-squared values and predicted R-squared values are in reasonable agreement for all ODMMY from all the four digesters. Digester C had higher adjusted R-squared value of 0.8624, hence had highest ODMMY, and followed by digester D with 0.8410 adjusted R-squared values. Next to digester D is digester A and digester B had the least ODMMY.
4. Conclusion
The study has revealed the results of biogas yield and its quality from co-digestion of cow dung with sunflower leaves, pawpaw and potato peels at different mass composition.
The results obtained showed that digester A with 45.45% cattle dung, 18.18% pawpaw peels, 18.18% potatoes peels and 18.18% sunflower leaves had the highest biogas yields from fresh mass and organic dry matter of the substrates. This has shown that co-digestion of these feedstocks can be done to obtain high yield of biogas at the experimented retention time.
Also, the quality of the biogas obtained showed that biogas produced by digester A had the highest methane content which is considered flammable for domestic combustion.
Pawpaw and potato peels have high C/N ratios and ODM which were responsible for the improved methane yield in biogas production of digester A.
Supplemental Material
Download ()Acknowledgements
The authors would like to express their acknowledgement to the authors/editors/publishers of all those articles and journals that are cited and included in references of this manuscript. We acknowledge the immeasurable contributions of Dr. I. K. Adegun of University of Ilorin, Dr. A. O. Adebayo of LAUTECH for their technical contributions. Also, we acknowledge the effort of Mr. J. B. Adeyemo of LAUTECH.
We did not receive any funding support. We have no conflicts of interest to disclose.
Additional information
Funding
Notes on contributors
Oyetola Ogunkunle
Oyetola Ogunkunle is a researcher at the department of Mechanical Engineering Science, University of Johannesburg, Johannesburg, South Africa. His research interests is renewable energy focusing on biogas production from biomass, biodiesel production from seed oil, engine tests using blended biodiesel, combustion analysis of biofuel combustion in internal combustion engines using CFD. He can be reached through this email: [email protected]. This research forms a part of waste utilization projects that we have embarked on most especially in the Western part of Nigeria. Our efforts are to develop research methods of generating efficient renewable energy which can be adopted locally and industrially. As an erudite scholar, he has published reputable articles in referred journals. He belongs to the following professional bodies: Full member, The Nigerian Society of Engineers (NSE); Registered Engineer, Council for the Regulation of Engineering in Nigeria (COREN).
References
- Agunwamba, J. C. (2001). Waste engineering and management tool . Enugu, Nigeria: Immaculate Publication Limited.
- Agyeman, F. O. , & Tao, W. (2014). Anaerobic co-digestion of food waste and dairy manure: Effects of food waste particle size and organic loading rate. Journal of Environmental Management , 133, 268–274. doi:10.1016/j.jenvman.2013.12.016
- Aichinger, P. , Wadhawan, T. , Kuprian, M. , Higgins, M. , Ebnerb, C. , Fimml, C. , … Wett, B. (2015). Synergistic co-digestion of solid-organic-waste and municipal-sewage-sludge: 1 plus 1 equals more than 2 in terms of biogas production and solids reduction. Water Res , 87, 416–423. doi:10.1016/j.watres.2015.07.033
- Annuputtikul, W. , & Rodtong, S. (2004), “Laboratory scale experiments for biogas production from cassava tubers.” The joint International Conference on “Sustainable Energy and Environment (SEE)”, Hua Hinm Thailand, December 1- 3.
- BioEnergy Consult (Powering Clean Energy Future) . 2018. Anaerobic digestion of animal manure. https://www.bioenergyconsult.com/anaerobic-digestion-of-cow-manure/
- Deressa, L. , Libsu, S. , Chavan, R. B. , Manaye, D. , & Dabassa, A. (2015). Production of biogas from fruit and vegetable wastes mixed with different wastes. Environment and Ecology Research , 3, 65–71.
- Ezeonu, S. O. , Dioha, I. J. , & Eboatu, A. N. (2005). Daily biogas production from different wastes and identification of methanogenic bacteria involved. Nigerian Journal Solar Energy , 15, 80–85.
- Harikishan, S. , & Sung, S. (2003). Cattle waste treatment and class – A biosolid production using temperature-phased anaerobic digester. Advances Environmental Research , 7, 701–706. doi:10.1016/S1093-0191(02)00034-5
- Kalia, V. C. , Sonakya, V. , & Raizada, N. (2000). Anaerobic digestion of banana stems waste. Bioresources Technologies , 73, 191–193. doi:10.1016/S0960-8524(99)00172-8
- Koch, K. , Helmreich, B. , & Drewes, J. E. (2015). Co-digestion of food waste in municipal wastewater treatment plants: Effect of different mixtures on methane yield and hydrolysis rate constant. Appl. Energy , 137, 250–255. doi:10.1016/j.apenergy.2014.10.025
- Labatut, R. A. , Angenent, L. T. , & Scott, N. R. (2014). Conventional mesophilic vs. thermophilic anaerobic digestion: A trade-off between performance and stability. Water Research , 53, 249–258. doi:10.1016/j.watres.2014.01.035
- Mao, C. , Feng, Y. , Wang, X. , & Ren, G. (2015). Review on research achievements of biogas from anaerobic digestion. Renew. Sustain. Energy Rev. , 45, 540–555. doi:10.1016/j.rser.2015.02.032
- Mshandete, A. M. , & Parawira, W. (2009). Biogas technology research in selected sub-saharan African countries – A review. African Journal on Bio Technology , 8, 116–125.
- Ostrem, K. 2004. Greening waste: Anaerobic digestion for treating the organic fraction of municipal solid waste (M.S Thesis). Department of Earth and Environmental Engineering, Columbia University, New York, NY.
- Parawira, W. , Murto, M. , Zvauya, R. , & Mattiasson, B. (2004). Anaerobic digestion of solid potatoes waste alone and in combination with sugar beet leaves. Renewable Energy , 29, 1811–1823. doi:10.1016/j.renene.2004.02.005
- Poulsen, T. G. , & Adelard, L. (2016). Improving biogas quality and methane yield via co-digestionof agricultural and urban biomass wastes. Waste Management , 54, 118–125. doi:10.1016/j.wasman.2016.05.020
- Quiroga, G. , Castrillon, L. , Fernandez-Nava, Y. , Maranon, E. , Negral, L. , & Rodriguez-Iglesias, J. (2011). Effect of ultrasound pre-treatment in the anaerobic co-digestion of cattle manure with food waste and sludge. Bioresource Technology , 154, 74–79. doi:10.1016/j.biortech.2013.11.096
- Ramachandra, T. V. , Krishna, S. V. , & Shruthi, B. V. (2005). Decision Support system to assess regional biomass energy potential. International Journal of Green Energy , 1(4), 407–428. doi:10.1081/GE-200038704
- Salunkhe, L. , & Paranjpe, A. (2015). Optimization of biogas production from co-digestion of MSW, with cow manure & poultry waste. International Journal of Engineering Technologies and Management Research , 3, 114–118.
- Santosh, Y. , Sreekrishnan, T. R. , Kohli, S. , & Rana, V. (2004). Enhancement of biogas production from solid substrates using different techniques – A review. Bioresource Technology , 95, 1–10. doi:10.1016/j.biortech.2004.02.010
- Singh, R. P. , Singh, P. , Araujo, A. S. F. , Ibrahim, M. H. , & Sulaiman, O. (2011). Management of urban solid waste: Vermicomposting a sustainable option. Resources. Conservation and Recycling , 5(7), 719–729. doi:10.1016/j.resconrec.2011.02.005
- Thorin, E. , Ahrens, T. , Hakalehto, E. , & Jaaskelainen, A. (2013). Organic waste as a biomass resource. ERIK DAHLQUIST. Biomass as Energy Source: resources, systems and applications (3rd ed., pp. 112–137). London, UK: CRC Press/Balkema Taylor and Francis Group.
- Tsapekos, P. , Kougias, P. , Treu, L. , Campanaro, S. , & Angelidaki, I. (2017). Process performance and comparative metagenomic analysis during co-digestion of manure and lignocellulosic biomass for biogas production. Applied Energy , 185(1), 126–135. doi:10.1016/j.apenergy.2016.10.081
- VDI 4630 Wuff . (2004). Vergarung Organischer Stoffe (Green Paper: Fermentation of Organic Materials) . Berlin: Beuth Verlag GmbH, D – 10772.
- Verma, S. 2002. Anaerobic digestion of biodegradable organics in municipal solid wastes (M.S Thesis). Columbia University, New York, NY. doi:10.1044/1059-0889(2002/er01)
- Yaru, S. S. , Adewole, K. A. , & Adegun, I. K. (2013). Comparative study of biogas from cattle dung and mixture of cattle dung with plantain peels (pp. 135–137). Minna, Nigeria: 3rd Biennial Engineering Conference Federal University of Technology.
- Zamanzadeh, M. , Hagen, L. H. , Svensson, K. , Linjordet, R. , & Horn, S. J. 2017. Biogas production from food waste via co-digestion and digestion- effects on performance and microbial ecology. Scientific Reports , 7, 1–12. Article number: 17664. doi:10.1038/s41598-016-0028-x.
- Zhang, C. , Xiao, G. , Peng, L. , Su, H. , & Tan, T. (2013). The anaerobic co-digestion of food waste and cattle manure. Bioresource Technology , 129, 170–176. doi:10.1016/j.biortech.2012.10.138
Appendix A
The supplemental information and data show the daily volumeof biogas production from all the digesters. The temperature and pressure readings, which were taken, are also tabulated.
Appendix B