
Abstract
The absence of tactile sensory feedback in transradial prosthetic hands is one of the major contributing factors for these devices to be rejected by users. This paper reports human psychophysical response to vibrotactile sensations in discriminating surface textures, as a possible non-invasive method to supplement sensory feedback for prosthetic hand users. The vibrotactile sensations were supplied by a specially fabricated actuator that vibrates according to signals obtained by a prosthetic finger when sliding across textured surfaces. Participants were provided with four different types of vibration patterns, randomly repeated for five times and were required to state which surface textures that the vibration patterns represent. A Chi-square test statistical procedure was designed to evaluate the relationships between these two categorical variables. The investigation which comprises of 300 samples has shown a statistically significant relationship between the vibration patterns and the surface textures (p < 0.001). The participants were able to discriminate surface textures and associate them to the vibration patterns provided by the vibrotactile actuator accordingly. The outcome of this work has provided optimistic possibility for implementation of painless, non-invasive sensory feedback that will undoubtedly boost the users’ sense of embodiment and encourage them to fully utilize a well-designed prosthetic device.
Public Interest Statement
Performing daily chores without a lower arm is undeniably very challenging. While it is possible to replace the missing hand with various prosthetic devices available in the current market, the users tend to neglect these devices after utilizing them for some time. One of the primary factors that lead to this rejection is that the devices do not provide tactile sensory feedback to the users. This paper reports the capability of a specially designed prosthetic finger to translate the information gathered when sliding across a surface texture to a vibration output that could be felt on residual arm. The outcome of this research highlights the optimistic possibility for the design of non-invasive, painless, more natural, “life-like” quality prosthetic devices that promotes sense of embodiment between the users and the devices.
1. Introduction
The human upper limb consists of at least 25 degrees of freedom with 19 articulations and 18 tendons crossing the wrist (Van Duinen & Gandevia, Citation2011). This complex architecture structure enables a person to perform daily tasks with ease. With no limbs, the quality of life for a person will be affected tremendously as it limits their capacity to carry out simple tasks, and consequently leads to dependency on others (Cordella et al., Citation2016; Yong, Chew, Mahmood, Sudirman, & Omar, Citation2011). With technological advances, prosthetic devices have been designed, manufactured and are becoming more and more efficient over the years.
However, although these devices are capable of assisting amputees in performing various tasks, the utilization of these devices remains limited and to some extent, they are abandoned by users. A comparative survey spanning a period of 25 years has shown that the rejection rate of prosthetic devices could be as high as 87% (Biddiss & Chau, Citation2007). One of the contributing factors of this rejection is the sense of embodiment, which is not evident when utilizing the device (Gouzien, Vignemont, Touillet, Martinet, & De Graaf, Citation2017; Peerdeman, Boere, Witteveen, & Huis, Citation2011).
A sense of embodiment means being self-conscious of one’s own body. It is also associated with feelings of bodily ownership, bodily control and affective feelings (Gouzien et al., Citation2017). Most often, an amputee does not view the prosthetic device as part of his or her body (De Vignemont, Citation2011) and will be inclined to use their contralateral arm rather than the device itself to overcome their disability (Gouzien et al., Citation2017). However, several research investigations have shown that the sense of embodiment with prosthetic devices could be enhanced with the availability of sensory feedback (Berg, Tenore, Jessica, Vogelstein, & Bensmaia, Citation2014; Gonzalez, Soma, Sekine, & Yu, Citation2012; Visell, Citation2009).
Several research studies have been conducted to provide sensory feedback to prosthetic users to compensate their missing sensory system such as force, pressure, temperature and slip detection (Beccai et al., Citation2008; Chatterjee, Chaubey, Martin, & Thakor, Citation2008; Cotton, Chappell, & Cranny, Citation2007; Cranny, Cotton, Chappell, Beeby, & White, Citation2005; Kim & Colgate, Citation2010). Not until recently have researchers been interested in adding surface texture detection, a function that is only perceived from the mechanoreceptors of glabrous skin, which covers the palm and flexor surfaces of fingers (Pritchard & Alloway, Citation1999). This feature is very useful as most of the tactile sensory systems are located at the skin of fingers and palm. This sensory system is responsible for touch sensation, and is much superior as compared to visual and auditory senses (Mano & Ohka, Citation1999; Pritchard & Alloway, Citation1999; Visell, Citation2009). The design of prosthetic device normally focuses on the mechanics or movement of the system without considering the need to replicate the tactile sensation. The loss of a hand does not only mean the loss of capability to move, but also the capability to feel and touch.
The focus of this research is the integration of the tactile acuity of a prosthetic finger in discriminating surface textures, to the creation of haptics sensation at the human residual limb. Extensive research has been done on differentiating the many properties of surface textures using various data acquisition techniques (Jamali & Sammut, Citation2010; Muridan, Chappell, Cranny, & White, Citation2010), and a range of research topics on haptic feedbacks have been thoroughly investigated for many applications (Antfolk et al., Citation2013; Demain, Metcalf, Merrett, Zheng, & Cunningham, Citation2012). There is, however, not much reported research into incorporating textural detection from artificial fingers to sensation at the residual arm, which should make a more significant experience for upper limb prosthetic users (Li, Fang, & Zhou, Citation2017). Most of the research that integrates between the two entities involves surgeries such as intraneural stimulation (Oddo et al., Citation2016; Raspopovic & Capogrosso, Citation2014). Due to high possibilities of pain, this is the least favoured method among users. Therefore painless, non-invasive techniques have been sought to address this issue (Li, Fang, Zhou, Citation2017; Stephens-Fripp, Alici, & Mutlu, Citation2018; Svensson P. et al., Citation2017) and thus become the motivation for this research.
In our previous study, we used a piezoelectric sensor, mounted on a fingertip of a Southampton Hand, to acquire voltage signals from four different types of surface textures. The signals were obtained by sliding the surface texture across the piezoelectric sensor at a constant velocity and later processed in MATLAB® to point out dominant frequencies associated with the surface textures. The frequencies were used to calculate the grating widths of the surface texture under investigation (Chappell, Muridan, Mohamad Hanif, Cranny, & White, Citation2015; Mohamad Hanif, Citation2015; Mohamad Hanif, Chappell, Cranny, & White, Citation2015).
The post-processed data from MATLAB® were next fed into LabView® to produce “on” and “off” pulses that represent the surface textures. The pulses were later channelled to a data acquisition board, a high voltage isolator and a buffer circuit before becoming input signals to a vibration actuator. The actuators rotate according to the “on” and “off” signals to produce the four different types of vibration patterns accordingly (Mohamad Hanif, Citation2015; Mohamad Hanif, Chappell, White, Cranny, & Hashim, Citation2016).
The vibrations were provided by a selected 11-mm long miniature motor with a maximum supply of 2 V, 50 mA. As reported in our previous work, we evaluated this motor in terms of its transients, frequency responses and effective vibration energy (Mohamad Hanif, Chappell, Cranny, & White, Citation2014, Citation2013). From the investigations, this motor was selected as it was capable of producing vibrations at 250 Hz, the optimum frequency of the Pacinian Corpuscle mechanoreceptors located underneath the skin of the upper arm (Kandel, Schwartz, & Jessell, Citation2000; Mohamad Hanif, Citation2015).
In this present work, we seek to confirm whether people are able to discriminate and match surface textures with the associated vibration patterns. As the vibration patterns were generated from the information gathered form the textured surface, it was conjectured that the sensation perceived on the index finger would have close similarity to the sensation felt at the posterior upper arm. This assessment involves psychophysics evaluation which is a scientific study that measures the relationship between the sensations felt by the human organ (psychological domain) with the properties that cause the sensation (physical domain) (Gescheider, Citation1997). This study has been reviewed and approved by the Ethics Committee of the University of Southampton, U.K. (Ethics ID: ERGO/FPSE/15,290).
2. Stimuli
Two types of stimuli were present in this psychophysics evaluation; the surface textures and vibration patterns.
2.1. Surface textures
Four surface textures (A, B, C and D) of different dimensions were fabricated on acrylic strips with a length of 100 mm per texture. The textures vary from smooth (Texture A) to course (Texture B & C) and very course (Texture D). The detailed dimensions of all four strips have been described in our previous work (Mohamad Hanif et al., Citation2016). The dimensions of the surface textures under investigation are as shown in Figure .
Figure 1. Dimensions of surface textures under investigation (Texture A—smooth surface, Texture B and C—rough surface, Texture D—very rough surface) (reproduced from Mohamad Hanif et al. (Citation2015)).
2.2. Vibration patterns
The vibration patterns generated by the selected actuator were applied at the upper arm of every participant. In this psychophysical investigation, the four different types of vibration were each randomly repeated for five times. Therefore, the total number of samples, N was 300 (4 types of vibration × 5 repetitions × 15 participants). To prevent discomfort to the users, we ensured that the vibration pulses were less than 500 ms during each test (except for Pattern A that requires continuous vibration of 1,500 ms to represent a smooth surface). The description of the four vibration patterns and their associated surface textures are as listed in Table .
Table 1. Descriptions of the vibration patterns and their associated surface textures
The vibration patterns were selected by the investigator (according to the predetermined random sequence) from the graphical user interface (GUI) programmed in LabView® by National Instruments. The input signals from the GUI were translated to vibration output through a buffer circuit.
2.3. Vibration device
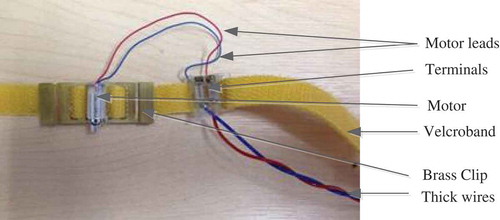
The selected vibration device, a miniature motor, was battery-powered and opto-electronically coupled to provide isolation with the mains power supply. To prevent metal fatigue that may break the wires, plastic terminals with attached thicker wires were included to the device.
The vibration device has been designed to operate at a frequency of 250 Hz, which is the peak frequency for the characteristics of the mechanoreceptors located underneath the skin of the upper arm in detecting vibration (E. Kandel et al., Citation2000). In our previous findings, the vibration stimuli were able to produce repeatable 250-Hz vibration frequencies at a predetermined input voltage when it was glued on a flat and hard surface (a table) (Mohamad Hanif et al., Citation2014) (Mohamad Hanif et al., Citation2013). However, when the vibration device was strapped and tested on the upper arm, the frequency range fluctuated between 250 ± 20 Hz which may affect the perceived sensations. The inconsistencies, apart from the compliance of the skin surface, were due to the instability during the rotation of the motor as it was not strongly and properly anchored as compared when glued onto a hard and flat surface.
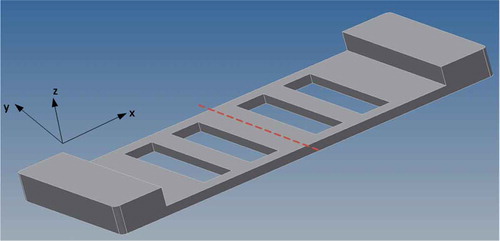
To reduce the variability of the vibration frequency, a 6.9-g solid brass clip with length, width and thickness of 40, 16 and 1 mm, respectively, was specially fabricated. In ensuring an even stable platform, both ends of the platform were designed to be thicker than the middle of the platform. Thus the z-axis of the platform became properly anchored to allow only the x-axis of the motor, which is the strongest vibration axis to be felt (y-axis had the lowest vibration strength). By anchoring the motor to the brass platform, the variation of the vibration device reduced to 249.6 ± 6.62 Hz, which was acceptable for this psychophysics investigation. Figure illustrates the fabricated brass clip.
Figure 2. Brass clip as a mechanical mounting for the vibration motor. Dashed red line is the middle area of the platform where the motor was glued. Both end sides of the platform are thicker than the rest of the platform. The velcro band was weaved between the four slots (reproduced from Mohamad Hanif (Citation2015)).
The frequency of the vibration stimuli during operation was checked using the frequency measurement method described in our earlier work (Mohamad Hanif et al., Citation2016). In this measurement method, the positive and negative terminals of the motor were connected to the probes of a digital oscilloscope. The Fast Fourier Transform (FFT) function of the oscilloscope was utilized to obtain the frequency content for one revolution of the motor.
The FFT results show a dominant frequency of 250 Hz with a very low standard deviation (less than 3%). These measurements ensured that the frequency supplied by the vibration stimuli was at the desired frequency. The vibration frequency was assessed before and after every psychophysics test to ensure that there was no variation (or very minimal variations) in the set vibration frequency that may cloud participants’ judgement on the associated surface textures.
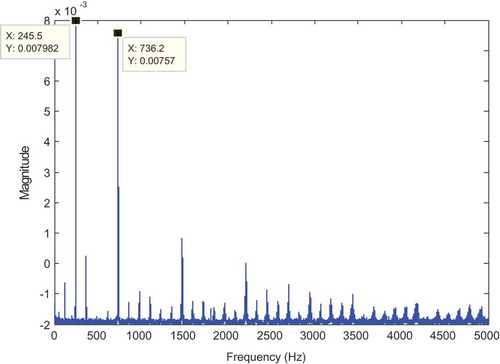
The FFT outputs produced by the vibration stimuli during one of the frequency measurements method is as shown in Figure . The dominant frequency was observed at 245.5 Hz, while the next dominant frequency was 736.2 Hz. This subsequent dominant frequency was due to the motor commutation points that were three times per rotation.
Figure 3. FFT output of the vibration stimuli.
The complete vibration device is shown in Figure . A velcro band was weaved into the designed slots of the terminals and clips and then strapped onto the participants’ upper arms during the psychophysics test.
Figure 4. Vibration device.
3. Methods
3.1. Subject
Fifteen subjects (12 female and 3 male) with age range between 18 and 39 years participated in this study. All subjects were undergraduate and postgraduate students of University of Southampton. All participants were medically stable and able to tolerate the transcutaneous sensations of continuous vibrations applied to the upper arm. Other exclusion criteria include pacemaker users, or people with poorly controlled epilepsy, on long-term medication and with history of upper motor neuron condition. It was important to ensure that all participants adhere to these exclusion criteria, as prolonged vibration may cause inaccurate findings to the study, and to another extent, may worsen their health conditions. None have taken part in psychophysical experiments before. All the participants gave written consent prior to starting the test.
3.2. Procedure
The psychophysical test was performed to one individual subject at a time. First, the subject was invited to sit in front of a workbench. While seated, the subject will be requested to be acquainted to all four surface textures by sliding his/her index finger across the surfaces (labelled and colour-coded as Texture A, Texture B, Texture C and Texture D), already prepared on the workbench.
Next, the length of the dominant upper arm (between the tip of shoulder (scapular acromion) and the elbow (humeral coronid fossa)) of the subject was determined using a measuring tape. The subject positioned his/her arms by his/her sides when measurements were recorded. This measurement was conducted to ensure that all participants will feel the vibration at the same parts of their posterior upper arms, as the vibration device will be strapped at one-fourth of the total length from shoulder tip.
While wearing the vibration stimuli, he/she was then introduced to the four different types of vibration patterns (Pattern A, Pattern B, Pattern C and Pattern D) to become familiar before the test began. The subject may request for the stimuli to be repeated before starting the test.
Once the test began, 20 vibrations (4 patterns, randomly repeated 5 times) were provided one at a time. All 15 participants received the same sequence of stimulation, pre-set in a random order. In this work, the random order means that sequence of vibration was not necessarily began from pattern A, to pattern B, followed by pattern C and ended with pattern D. The sequence was done according to the data collection plan sheet. The sequence in the data collection plan was designed to ensure that the judgements on the perceived vibrations were not influenced by the preceding vibration patterns.
Participants were asked to associate the provided surface textures with the generated vibration. For each vibration pattern perceived at the upper arm, the participants verbally stated the type of textures that were closely represented by the vibration.
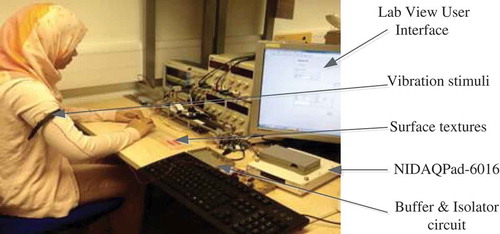
The maximum duration of the vibration was 5 seconds per pattern and it took about 20 minutes in total to complete the test. Figure shows how the haptic device was mounted on a person’s arm, the position of the surface texture and apparatus in conducting the psychophysics test.
Figure 5. Positions of the vibration stimuli, surface textures and other test apparatus for the psychophysical test.
4. Results
In evaluating the association between the vibration patterns and the surface textures, a Chi-squared (χ2) test of independence was performed with the criterion for significance of α = 0.01, on the gathered data. This evaluation was conducted in three stages. The first stage was to observe the number of times that a surface texture is selected when a vibration pattern is supplied to the upper arm. The second stage is a follow-up analysis in verifying the strong association between the vibration patterns and their corresponding surface textures. The third stage is a similar follow-up analysis as with the second stage, but this was conducted to assess the weakest association between the vibration patterns and the selected surface textures. All analyses were carried out using IBM SPSS Statistics (Version 22) software.
We set “vibration patterns and surface textures are independent” as the null hypothesis, H0, while “vibration patterns and surface textures are not independent” was set as the alternative hypothesis, Ha. The H0 will be rejected if the p-value is less than the chosen significance value of 0.01 (p < .01). The rejection H0 will provide indication that there is a certain extent of association between the vibration patterns and the surface textures. The strength of association between both variables was obtained by checking the Phi value, ϕ (for 2-by-2 contingency tables) or Cramer’s V value (for contingency table with size of more than 2-by-2).
4.1. First-stage analysis: overall association
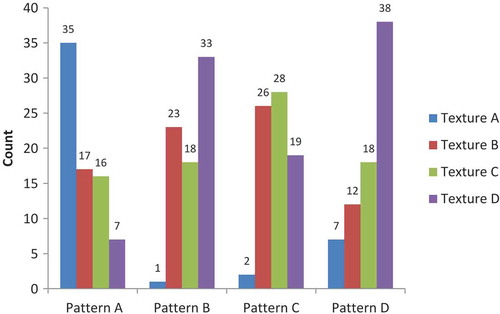
The outcome from the first-stage analysis is as shown in Figure . The histogram displays the frequency (observed count) of a texture being selected for a given vibration pattern. Ideally, texture A should have the highest count for vibration A. Similarly, textures B, C and D should have the highest count for vibration patterns B, C and D. In this analysis, it was noted that textures A and D have the highest count for vibration patterns A and D, respectively. This result provided early indication that there is association between these two properties.
Figure 6. Histogram of selected surface textures with supplied vibration patterns.
The χ 2 test of independence also implied that there is a statistically significant relationship between the vibration patterns and the perceived texture. The Pearson’s Chi-Square value for this test was 103.450, with p-value of less than 0.001 (p < 0.001). The Cramer’s V value obtained from this association was 0.339. This is the strength of the association between the vibration pattern and the surface texture. This value indicates that there was a moderate association between the two variables (Warmbrod, Citation2001).
4.2. Follow-up analysis 1: evaluation of the strongest association
The second stage of evaluation only involved vibration patterns A and D as well as surface textures A and D. This was due to the fact that Vibration A and Texture A as well as Vibration D and Texture D gave the most contribution in associating the vibration patterns and their corresponding surface textures (as shown in histogram in Figure ). This follow-up analysis was carried out to verify their strength of association. The Bonferoni correction was included in this follow-up test to ensure the chances of Type I error (false-positive result) is reduced (Sharpe, Citation2015). As four comparisons were made in this follow-up test (vibration pattern A with texture A, vibration pattern A with texture D, vibration pattern D with texture A and vibration pattern D with texture D), the criterion for significance became α/4 = 0.01/4 = 0.0025. The p-value has also been adjusted using the SPSS software.
The result from the χ 2 test of independence for this follow-up analysis shows that the association between both vibration patterns and the surface textures was significant, χ 2 (1, N = 87) = 39.966, p < 0.001, with the effect value, ϕ = 0.678. This is a strong association, as has been outlined in (Warmbrod, Citation2001). The histogram of the analysis for the surface textures and vibration patterns A and D are as shown in Figure .
Figure 7. Histogram of the follow-up analysis for the surface textures and vibration patterns A and D.
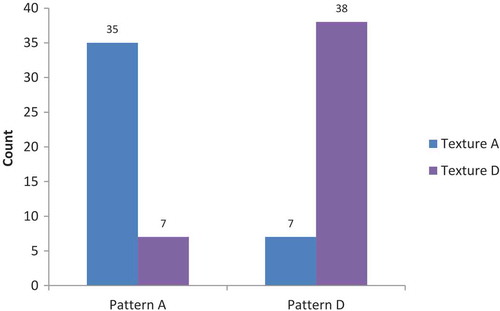
From this observation, it can be deduced that given a vibration pattern, people are more likely to select the same surface texture that has been used to produce signals in generating that particular vibration pattern. As shown in Figure , the frequency (count) of texture A being selected when given a vibration pattern A is 35. As the total number of repetition of each vibration pattern is 75 (1 vibration pattern × 5 repetition × 15 participants), the selection percentage of texture A being selected when given vibration A is 46.7%. The odds that people will likely to select texture A when given vibration A are 8.5 times higher than the odds of selecting texture A when given vibration D.
Similarly, the frequency (count) of texture D being chosen when vibration D was provided is 38 (percentage selection is 50.7%). The odds that people that will tend to select texture D when given vibration D is 9.98 higher than selecting texture D when given vibration A.
4.3. Follow-up analysis 2: evaluation of the weakest association
Another follow-up analysis was conducted to evaluate the weakest association between the two variables. From Figure , the observed counts for vibration patterns B and C with textures B and C were almost equal. This indicated that the participants were having some difficulty in associating the vibration patterns with the surface texture. This observation suggests that the association between the variables were very low. Similar to the follow-up analysis for vibration patterns A and D with textures A and D, the criterion of significance was reduced to 0.0025. The p-value for this test has been adjusted according to the Bonferoni corrections using the SPSS software.
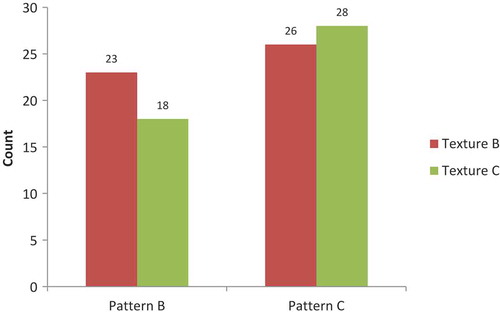
The results from the χ 2 test of independence showed that there was no statistically significant association between Vibration B with Texture B and Vibration C with Texture C, χ 2 (1, N = 95) = 0.590, p = 0.443. The Phi value, ϕ = 0.078, confirmed that the strength of association between the selected vibration and textures were very weak.
The histogram in Figure showed the selection tendency of the people when supplied with vibrations patterns B and C. A higher frequency count was observed for texture B when supplied with vibration B (30.7%). Similarly, a higher frequency count was observed for texture C when supplied with vibration C (37.3%). From this observation, we gathered that although the associations between the selected variables were weak, people were still able to match the vibration patterns with the surface texture.
Figure 8. Histogram of the follow-up analysis for the surface textures and vibration patterns B and C.
5. Discussion
In this work, a psychophysical test was designed carefully that allows observations on the association between the generated vibration patterns with the surface textures. As our sampling method was random (vibration patterns supplied in random order) and the variables were categorical (vibration patterns A, B, C and D and surface textures A, B, C and D), we found out that the Chi-square test for independence (also known as Pearson’s Chi-square test) is the most appropriate for this qualitative evaluation Chi-Square Test for Independence, Citation2015).
It was anticipated that the participants may tend to make quick judgements by associating short vibration pulses with simple textures and longer vibration pulses with more complicated textures without concentrating on the actual vibration sensations felt at the upper arm. To address this issue, the duration of all stimulation was maintained to within 1.5–2.5 s. This was achieved by setting Patterns A, B, C and D to repeat in 1, 5, 3 and 1 cycle(s), respectively, for each stimulation test.
The subject population was imbalanced in terms of gender in which the ratio of female to the male participants was 4:1. However, this should not affect the perception of stimulations as the mechanoreceptors responsible for sensing vibration stimulation on the skin surface are located deep beneath the skin layers (Kandel et al., Citation2000). Based on this information, we found that regardless of gender and physical attributes, the same stimulation could be felt similarly for every participant.
To ensure the vibration patterns were associated with surface textures solely based on participants’ perceived sensations, the stimuli were introduced to them in such a way that the judging was made without the presence of “learning” effects and memory based deduction. Prior to the beginning of the test, the participants were required to touch and explore the surface texture. The vibration patterns were then presented to them in a random order without informing the types of patterns (whether A, B, C or D).
A point worth noting when a judgement was made without a priori knowledge was the possibilities of false assumptions. This matter was raised by some participants as they felt that they should be trained about the types of vibration patterns to avoid continually making false assumptions throughout the test. An example of such a case can be observed in Figure . When given vibration pattern B, the number of counts for selection of textures A, B, C and D were 1, 23, 18 and 33, respectively. Texture D has the highest selection count, in which the selection percentage is 13.3% higher than texture B. This occurs as assumptions that vibration pattern B should be associated with texture D remained from the initial encounter until the end of the test.
To address this issue, a further test would have been possible to conduct with different set of data from people with priori information about the vibration patterns. Although the outcome of the test may likely provide stronger association between both variables, it may not be applicable for the study. The main objective of this experiment is to evaluate whether the surface texture signals (translated vibration patterns by the system—piezoelectric sensor, data acquisition system and actuator) could be deciphered accordingly by the users. Providing users with information of what a certain vibration should be like would result in incorrect findings. Furthermore, in an ideal situation, the whole process of acquiring signals from various types of surface textures to the generation of vibration patterns by the actuator should be in real time. For these reasons, at this time, we believe that judgement of vibration patterns based on previously known patterns is unnecessary and may lead to inaccurate findings.
Another matter raised by participants during discussions with the investigator was the difficulties in differentiating between patterns B and C. The main reason for this matter could be due to the dimensions of the surface textures under investigation. Although the width of ridge of texture C is more than three times than that of texture B, both textures have almost the same groove width. According to research findings by Lawrence (Lawrence, Kitada, Klatzky, & Lederman, Citation2007) and Lederman (Lederman, Klatzky, Hamilton, & Ramsay, Citation1999), groove widths play the strongest effect in providing the roughness sensation of a surface texture. Therefore, although the vibration patterns may have correctly represent the surface textures, people will tend to find it challenging to differentiate between the surface textures using a bare finger and thus resulted in mismatched results between the two variables.
One important observation made during this investigation is that the participants could easily associate patterns with distinctive features as compared to the less distinct ones. In this test, most participants accurately matched a constant vibration from the motor (pattern A) with a smooth texture (texture A). Similarly, longer pulses of vibration (pattern D) were correctly matched to the roughest surface texture (texture D). Similar perception to these types of vibration could be attained from reports in Brown & Kaaresoja (Citation2006) and Demain et al. (Citation2012). This clearly suggests that approximation of smoothness and roughness could be created by varying the pulses of the vibration.
In this study, a 250 Hz frequency was pre-set to the vibration actuator before being attached onto the upper arm. Although the participants did not complain about dizziness or skin irritation during the psychophysics investigation, it may be convenient if the users were able to adjust the frequency of vibration according to their own comfort level. This can be achieved by implementing closed-loop control to the system.
6. Conclusions
The hypothesis that the vibrations generated and perceived at the upper arm should have association with surface textures has been validated in this research work. The investigation has revealed that there is a statistically significant relationship between the vibration patterns and the surface textures (probability value, p < 0.001). In particular, patterns with well-defined features (extremely smooth or extremely rough) produced higher matching scores as compared to the less distinct ones. As the dimensions of the textures were calculated prior to supplying input pulses to the actuator, it provides assurance that the generated vibration signals fittingly represent the surface textures.
As the vibration signals generated by the tactile signals gathered by the artificial finger could be distinguished by users, it opens up promising possibilities for implementation of painless, non-invasive sensory feedback to upper prosthetic device users. The users will be able to “touch” and “feel” objects held by the prosthetic hand without having to undergo surgeries. Undeniably further upgrades will be required to improve the percentage of selection matching between the vibration patterns with surface textures.
The enhancement of sensory feedback feature, along with other existing features in prosthetic devices, boosts a sense of embodiment to the users, and should be able to provide greater satisfaction and encourage users to fully utilize the device. Ultimately, this leads to a better quality of life and allows amputees to be more independent.
This work can be further developed for applications that involve discriminating surface textures of various objects used in daily life such as softness, warmness and stickiness. For this purpose, training the users with a learning phase will be beneficial to them as they will easily recognize and appropriately respond to the objects. The reliability of the system to measure the widths of the surface gratings also opens various possibilities for applications in industries, where exact dimensions of surface textures are mandatory.
Supplemental Material
Download ()Acknowledgements
This work was supported by the Ministry of Higher Education, Malaysia and the IIUM Research Initiative Grant Scheme (RIGS16-071-0235).
We dedicate this work to our colleague, Dr. Andy Cranny, who unfortunately passed away during the time this paper was in preparation. He will be remembered for his dedication to science and his willingness to help others.
We would like to thank the Mechatronics Department of International Islamic University Malaysia and the Faculty of Physical Sciences and Engineering, University of Southampton, U.K. for supporting this research work.
Supplementary Material
Supplemental data for this article can be acessed here.
Additional information
Funding
Notes on contributors
Noor Hazrin Hany Mohamad Hanif
Noor Hazrin Hany Mohamad Hanif is an Assistant Professor in the Mechatronics Engineering Department of International Islamic University Malaysia. Her research interests include rehabilitation instrumentation, wearable devices and energy harvesting.
P. H. Chappell
P. H. Chappell is an Associate Professor in Electronics and Computer Science at University of Southampton. His research interests are in medical engineering, particularly prosthetics and functional electrical stimulation.
N. M. White
N. M. White holds a Personal Chair of Intelligent Sensor Systems in the Electronics and Computer Science, University of Southampton. His research interests include thick-film sensors, intelligent instrumentation, MEMS, self-powered microsensors and sensor networks.
A. W. Cranny
A. W. Cranny was a Senior Research Fellow within the Electronics and Computer Science, University of Southampton.
All authors were awarded PhD degrees from the University of Southampton, United Kingdom.
The psychophysical investigation reported in this paper provides optimistic possibilities for implementation of painless, non-invasive sensory feedback in prosthetic devices.
References
- Antfolk, C. , D’Alonzo, M. , Controzzi, M. , Lundborg, G. , Rosén, B. , Sebelius, F. , & Cipriani, C. (2013). Artificial redirection of sensation from prosthetic fingers to the phantom hand map on transradial amputees: Vibrotactile versus mechanotactile sensory feedback. IEEE Transactions on Neural Systems and Rehabilitation Engineering , :21(1), 12–20. doi:10.1109/TNSRE.2012.2217989
- Beccai, L. , Roccella, S. , Ascari, L. , Valdastri, P. , Sieber, A. , Carrozza, M. C. , … Dario, P. (2008). Development and experimental analysis of a soft compliant tactile microsensor for anthropomorphic artificial hand. IEEE/ASME Transactions on Mechatronics, 13(2), 158–168.
- Berg, J. A. , Tenore, F. V. , Jessica, L. , Vogelstein, R. J. , & Bensmaia, S. J. (2014). Restoring the sense of touch with a prosthetic hand through a brain interface. Proceedings of the National Academy of Sciences , 111(2), 18279–18284.
- Biddiss, E. A. , & Chau, T. T. (2007). Upper limb prosthesis use and abandonment: A survey of the last 25 years. Prosthetics and Orthotics International , 31(3), 236–257. doi:10.1080/03093640600994581
- Brown, L. , & Kaaresoja, T. (2006). Feel who’s talking: Using tactons for mobile phone alerts . Paper presented at CHI 2006 Extended Abstractson Human Factors in Computing Systems, Montreal, Canada. doi:10.1145/1125451.1125577.
- Chappell, P. H. , Muridan, N. , Mohamad Hanif, N. , Hazrin, H. , Cranny, A. , & White, N. M. (2015). Sensing texture using an artificial finger and a data analysis based on the standard deviation. IET Science, Measurement & Technology , 9(8), 1–9. doi:10.1049/iet-smt.2015.0003
- Chatterjee, A. , Chaubey, P. , Martin, J. , & Thakor, N. (2008). Testing a prosthetic haptic feedback simulator with an interactive force matching task. JPO Journal of Prosthetics and Orthotics , 20(2), 27–34. doi:10.1097/01.JPO.0000311041.61628.be
- Chi-Square Test for Independence . (2015). Retrieved from http://stattrek.com/chi-square-test/independence.aspx?Tutorial=AP
- Cordella, F. , Ciancio, A. L. , Sacchetti, R. , Davalli, A. , Cutti, A. G. , Guglielmelli, E. , & Zollo, L. (2016). Literature review on needs of upper limb prosthesis users. Frontiers in Neuroscience , 10(209), 1–14. doi:10.3389/fnins.2016.00209
- Cotton, D. , Chappell, P. , & Cranny, A. (2007). A novel thick-film piezoelectric slip sensor for a prosthetic hand. IEEE Sensors Journal , 7(5), 752–761. doi:10.1109/JSEN.2007.894912
- Cranny, A. , Cotton, D. P. J. , Chappell, P. H. , Beeby, S. P. , & White, N. M. (2005). Thick-film force, slip and temperature sensors for a prosthetic hand. Measurement Science and Technology , 16(4), 931–941. doi:10.1088/0957-0233/16/4/005
- De Vignemont, F. (2011). Embodiment, ownership and disownership. Concious and Cognition , 20(1), 82–93. doi:10.1016/j.concog.2010.09.004
- Demain, S. , Metcalf, C. D. , Merrett, G. V. , Zheng, D. , & Cunningham, S. (2012). A narrative review on haptic devices: Relating the physiology and psychophysical properties of the hand to devices for rehabilitation in central nervous system disorders. Disability and Rehabilitation. Assistive Technology , 8(3), 181-189. doi: 10.3109/17483107.2012.697532
- Gescheider, G. (1997). Psychophysical measurement of thresholds: Differential sensitivity. In Psychophysics: The Fundamental s (3rd ed., pp. 1–15). New York, NY: Psychology Press..
- Gonzalez, J. , Soma, H. , Sekine, M. , & Yu, W. (2012). Psycho-physiological assessment of a prosthetic hand sensory feedback system based on an auditory display: A preliminary study. Journal of Neuroengineering and Rehabilitation , 9(33), 1–14. doi:10.1186/1743-0003-9-33
- Gouzien, A. , De Vignemont, F. , Touillet, A. , Martinet, N. , & De Graaf, J. (2017). Reachability and the sense of embodiment in amputees using prostheses. Nature , 7(4999), 1–10.
- Jamali, N. , & Sammut, C. (2010). Material classification by tactile sensing using surface textures. In 2010 IEEE International Conference on Robotics and Automation (pp. 2336–2341). Anchorage, AK. doi:10.1109/ROBOT.2010.5509675
- Kandel, E. , Schwartz, J. , & Jessell, T. (2000). Principles of neural science (4th ed.). New York, NY : McGraw Hill.
- Kim, K. , & Colgate, J. (2010). On the design of miniature haptic devices for upper extremity prosthetics. IEEE/ASME Transactions on Mechatronics , 15(1), 27–39. doi:10.1109/TMECH.2009.2013944
- Lawrence, M. A. , Kitada, R. , Klatzky, R. L. , & Lederman, S. J. (2007). Haptic roughness perception of linear gratings via bare finger or rigid probe. Perception , 36(4), 547–557. doi:10.1068/p5746
- Lederman, S. J. , Klatzky, R. L. , Hamilton, C. L. , & Ramsay, G. I. (1999). Perceiving roughness via a rigid probe: Psychophysical effects of exploration speed and mode of touch. Haptics-E the Electronic Journal of Haptic Research , 1(1), 1–21.
- Li, K. , Fang, Y. , & Zhou, Y. (2017). Non-invasive stimulation-based tactile sensation for upper-extremity prosthesis: A review. IEEE Sensors Journal , 17(9), 1–11. doi:10.1109/JSEN.2017.2674965
- Mano, T. , & Ohka, M. (1999). Mechanisms of fine-surface-texture discrimination in human. Journal Accoust Social American , 105(4), 2485–2492. doi:10.1121/1.426852
- Mohamad Hanif, N. H. H. (2015). Sensory feedback for artificial hands . Southampton, England: University of Southampton.
- Mohamad Hanif, N. H. H. , Chappell, P. H. , Cranny, A. , & White, N. M. (2013). Vibratory feedback for artificial hands. In 2013 International Conference on Electronics, Computer and Computation (ICECCO) (pp. 247–250). Ankara, Turkey. doi: 10.1109/ICECCO.2013.6718275
- Mohamad Hanif, N. H. H. , Chappell, P. H. , Cranny, A. , & White, N. M. (2014).Development of vibrotactile sensory feedback for prosthetic hand users. In IASTED International Conference Biomedical Engineering (BioMed 2014) . Zurich, Switzerland. doi: 10.2316/P.2014.818-076
- Mohamad Hanif, N. H. H. , Chappell, P. H. , Cranny, A. , & White, N. M. (2015). Surface texture detection with artificial fingers. In 37th annual international conference of IEEE engineering in medicine and biology society (pp. 8018–8021). Milan, Italy. doi: 10.1109/EMBC.2015.7320253
- Mohamad Hanif, N. H. H. , Chappell, P. H. , White, N. M. , Cranny, A. W. , & Hashim, N. N. N. (2016). Tactile to vibrotactile sensory feedback interface for prosthethic hand users. In IEEE EMBS Conference on Biomedical Engineering and Sciences (IECBES) (pp. 326–330). Kuala Lumpur, Malaysia. doi:10.1109/IECBES.2016.7843467
- Muridan, N. , Chappell, P. H. , Cranny, A. , & White, N. M. (2010). Texture sensor for a prosthetic hand. In Eurosensors XXIV (Vol. 5, pp.605–608). Linz, Austria: Elsevier. doi:10.1016/j.proeng.2010.09.182
- Oddo, C. M. , Raspopovic, S. , Artoni, F. , Mazzoni, A. , Spigler, G. , Petrini, F. , … Faraguna, U. (2016, March). Intraneural stimulation elicits discrimination of textural features by artificial fingertip in intact and amputee humans. eLife , 1–27. doi: 10.7554/eLife.09148.001
- Peerdeman, B. , Boere, D. , Witteveen, H. , & Huis, R. (2011). Myoelectric forearm prostheses: State of the art from a user-centered perspective. Journal of Rehabilitation Research & Development , 48(6), 719–738. doi:10.1682/JRRD.2010.08.0161
- Pritchard, T. , & Alloway, K. (Eds.). (1999). Medical neuroscience (1st ed.). Madison, Conn: Wiley.
- Raspopovic, S. , & Capogrosso, M. (2014). Restoring natural sensory feedback in real-time bidirectional hand prostheses. Science Translational Medicine , 6(222), 1–11. doi:10.1126/scitranslmed.3006820
- Sharpe, D. (2015). Your chi-square test is significant: Now what? Practical Assesment, Research & Evaluation , 20, 8.
- Stephens-Fripp, B. , Alici, G. , & Mutlu, R. (2018). A review of non-invasive sensory feedback methods for transradial prosthetic hands. IEEE Access , 6, 6678–6899. doi:10.1109/ACCESS.2018.2791583
- Svensson, P. , Wijk, U. , Björkman, A. , & Antfolk, C. (2017). A review of invasive and non-invasive sensory feedback in upper limb prostheses. Expert Rev Med Devices , 14(6), 439–447. doi:10.1080/17434440.2017.1332989
- Van Duinen, H. , & Gandevia, S. C. (2011). Constraints for control of the human hand. The Journal of Physiology , 23(589), 5583–5593. doi:10.1113/jphysiol.2011.217810
- Visell, Y. (2009). Tactile sensory substitution: Models for enaction in HCI. Interacting with Computers , 21(1–2), 38–53. doi:10.1016/j.intcom.2008.08.004
- Warmbrod, J. R. (2001). Calculating, interpreting, and reporting estimates of “effect size” (Magnitude of an effect or the strength of a relationship) . Texas: Texas Tech. University.
- Yong, C. Y. , Chew, K. M. , Mahmood, N. H. , Sudirman, R. , & Omar, C. (2011). Prosthetics: Health quality of life effects of limb loss. In 4th international conference on Biomedical Engineering and Informatics (BMEI) (pp. 1333–1337). Shanghai, China. doi: 10.1109/BMEI.2011.6098617