
 ?Mathematical formulae have been encoded as MathML and are displayed in this HTML version using MathJax in order to improve their display. Uncheck the box to turn MathJax off. This feature requires Javascript. Click on a formula to zoom.
Abstract
Aquaculture is a globally fast-growing food sector, and its economic significance is increasing consistently. Currently, site selection for aquaculture is based on remote sensing and Geographic Information Systems (GIS), which provide infrastructure information. The information regarding environmental factors such as water properties are measured manually. There is a requirement for building a database on water properties at various river sites that are favourable for aquaculture. Underwater wireless sensor network (WSN) systems are being developed to measure various water parameters for aquaculture monitoring, and the mobility of sensor is considered for node deployment to increase the accuracy of measured water parameters. The present system integrates WSN nodes to extract the data and connect to cloud data server. A centralized database is created to store the information/data, which is analysed using clustering k-means algorithm. The proposed work presents an aquaculture resource planning (ARP), a SaaS (Software-as-a-Service) application; the users can access information using the application “Aquaward” and analyse various river sites that can be used for aquaculture development.
PUBLIC INTEREST STATEMENT
Aquaculture is important source of food and contributes to economic growth of the country. The farming area (Site Selection) for aquaculture requires infrastructural and environmental information. Site infrastructural information is collected using remote sensing and Geographic Information Systems. Environmental information such as water properties are measured manually and challenges such as measurement efficiency and delay exists. A knowledge database is required to be built at various river site, which in turn increase the aquaculture farming. The proposed system measures various water parameters using wireless sensor nodes at various selected sites and sends the measured data to cloud server to analyse the site suitability. The collected information is analysed based on clustering technique and statistical tests are carried out. With the analysed data and connecting all the necessary resources pertaining to aquaculture, we have proposed an end-to-end software service application for aquaculture resource planning (ARP) and development for all the stakeholder.
1. Introduction
Aquaculture is a controlled farming and harvest of aquatic animals and plants. It is essential in order to satisfy the growing food demand for the global population due to reduction in natural fisheries stocks. Aquaculture takes place in warm water, cold water, and marine water environments. In warm water, fishes such as catfish, crab fish, baitfish, sport fish, and ornamental fishes are cultured. Salmon and trout fishes are cultured in cold waters. In marine culture, fishes which live in saltwater or brackish water are cultured, which include species such as clams, oysters, seaweed, mussels, shrimp, salmon, and steelhead trout. Aquaculture has developed globally over last decades in terms of species and systems. In India, there is an annual 7% growth rate in aquaculture. Carp fish species are the major aquaculture species grown, and satisfy 90% of aquaculture production for domestic needs, and shrimp contributes 5% of export earnings (Food and Agriculture Organization of the United Nations, Citation2018). Government of India has established a research centre on tropical marine fisheries called Central Marine Fisheries Research Institute (CMFRI). The CMFRI has carried out various experimental culturing on sea bass, mullet, and spiny lobsters. Currently, the CMFRI has mounted small cages at various sites in order to promote aquaculture farming in India. Development in the field of aquaculture can provide alternative for employment and satisfy protein needs. Site selection for aquaculture requires essential information regarding potential locations, which indicate the best promising progress prospective, and also increases in return on investment of resources. With respect to the discussed points, site selection is an important factor in aquaculture planning and development. Presently, remote sensing and GIS based models are used for the site selection of aquaculture. Procuring remote sensing data of high resolution captured by satellite are expensive and are limited only to a particular area (Glasgow, MBurkholder, EReed, JLewitus, & Joseph, Citation2004). The GIS models provide information on spatial features regarding the infrastructure of an aquaculture site (Pérez, Ross, Telfer, & Campo Barquin, Citation2003; Shahadat Hossaina & Chowdhurya, Citation2009; Longdill, Healy, & Black, Citation2008). The information regarding environmental factors such as water parameters are measured manually at different locations irrespective of time. The traditional approach has the following limitations: (i) Single point of observation causes limited data; (ii) There is a time gap between sampling and detection; and (iii) There is an increase in cost of measurement due to labour and equipment. Hence, the traditional method is time consuming and inefficient.
Water temperature, salinity, dissolved oxygen, pH, and turbidity are the important water parameters which help to know the suitability of site for aquaculture. Water temperature is one of the important parameters required to maintain the aquatic life. Concentration of dissolved oxygen in water is affected by the water temperature. Higher the water temperature, lower is the dissolved oxygen concentration. Every aquatic being has its own upper and lower temperature limits, and the aquatic being will be in stress if the temperature goes above or below the limits. An abrupt change is that the temperature might reduce the disease resistance of the cultured aquatic being and increase the chances of being infected easily. The water temperature affects metabolic, reproduction activities of aquatic organisms (Davies & Bromage, Citation2002). The turbidity determines total suspended material, which causes cloudiness in water. Lower level of turbidity determines a healthy eco system with adequate quantity of plankton. Higher level of turbidity blocks the penetration of light that is needed within water for the aquatic beings. The higher level of turbidity reduces the dissolved oxygen absorption of fish (José Juan Carbajal Hernández, Fernández, & Oleksiy, Citation2011). pH is an important chemical factor, which determines the quantity of hydrogen ions in water. The amount of pH level determines the acidity or alkalinity of water. An ideal pH range must be maintained while culturing the aquatic species in order to reduce stress, sickness, and death (Chien (Citation1992). The salinity of water determines the total amount of dissolved salt in water. The salinity level in water effects salt and water stability in the aquatic beings. Higher the level of salinity, lower will be the amount of dissolved oxygen (Bosma & Verdegem, Citation2011). Dissolved oxygen is one of the important parameters to be considered for aquaculture. An ideal level of dissolved oxygen results in the growth and well-being of the cultured species. It is necessary for fish and algal respiration and decomposition of waste. It is required to maintain the dissolved oxygen above 2 mg/l for the mineralization of organic matter. Lower level of dissolved oxygen causes an adverse effect on fish health leading to death (Hargreaves, Citation2006).
Real time aquaculture monitoring can minimize economic losses due to mismanagement and disease spreading. In 2013, about 5 billion dollar financial losses have occurred in shrimp farming industry alone due to declining production. Monitoring and controlling of water parameter in aquaculture farm help in optimized growth and minimize chances of diseases. (Wireless water monitoring system, Citation2017). Currently, a significant quantity of work has been done related to the WSN issues, but the interaction with the external world has not yet been explored fully. The availability of WSN based system in market is considerably limited. Various challenges are to be considered while designing the WSN based system such as design and performance, sensor node power consumption, communication failure, environmental factors, and scalability. The WSN comprises a large number of nodes that is deployed in an area of interest to sense the change in environmental parameters, and transmit the sensed information to the end user or data centre for further analysis. WSN transmits real time information to the user terminal by means of multi-hop relay approach over randomly deployed self-organized wireless communication networks (Ertuð & Mirza, Citation2010). WSN finds application in environmental monitoring, remote control, industrial and other applications. Cloud connected wireless networks provide optimal solution for data gathering in remote locations, making data available through internet. The cloud computing platform provides remotely located servers to dynamically reconfigured with respect to actual requirements. Cloud computing offers dominant and reachable services to process and store data. The resources are assigned on demand and provided to users as services (Flammini & Sisinni, Citation2014).
Considering resources such as site, water parameters, sensor devices, data collection, open source aquaculture information, cloud based aquaculture application, and the end user, all together form an aquaculture resource planning (ARP) system. This work aims at developing an ARP system by bringing in all the entities pertaining to aquaculture development and connecting between all the stakeholders. The developed ARP provides a site selection system for aquaculture by combining underwater sensor with WSN technology and cloud platform based on SaaS. The system consists of the WSN based on Zigbee approach for water monitoring in order to select the site for aquaculture farming. The integration of WSN and cloud framework is to store the sensor data, examine, mine the data, and provide an application for aquaculture site. The site selection process for an aquaculture is accomplished by gathering and interpreting massive sums of data collected from the site to know the variability of water parameters, and to propose suitable kinds of fishes that can be cultured in a particular site. The system also includes a decision model to choose the suitability of site in terms of class labels which are most suitable, moderate, and not suitable. The integrated research approach provides data acquisition, transmission, and analysis for site selection of an aquaculture farm to promote aquaculture in India.
The remainder of the paper organized as follows. Section 2 discusses literature review related to aquaculture monitoring using WSN considering water parameters and deployment on cloud platform. Section 3 describes system design for ARP. Section 4 discusses the methodology and implementation with the activity diagram of designed web application. Section 5 presents results and discussion. Section 6 presents conclusion and future work.
2. Literature review
Before setting up an aquaculture farm, it is important to study the environmental and infrastructural parameters of a chosen site. The physiological activities of fish such as breathing, feeding, excretion of waste, maintaining salt balance, and reproduction are performed within water. Therefore, the quality of water determines the success or failure of an aquaculture. Water temperature, salinity, dissolved oxygen, pH, and turbidity are the important water parameters, which help to know the suitability of a site for aquaculture. It is required that a water parameter measuring device must be a part of WSN, making the system sophisticated (Ertuð & Mirza, Citation2010). Aquaculture takes place in shallow freshwater such as river estuaries where water depth is lower than 10 m. Radio wave communication is potentially efficient in shallow water (Cella, Johnstone, & Shuley, Citation2009). Freshwater is a low loss medium for wireless communication due to its low conductivity and negligible amount of turbidity (Sendra, Lloret, Rodrigues, & Aguiar, Citation2013).
Qi Lin et al. developed a WSN based traceability system for recirculation aquaculture (RATS). The system measures the water parameters such as water temperature, salinity, dissolved oxygen, and pH, and transfers the data measured in real time. The RATS were based on Microsoft Visual Studio 2008 using C# with a real time display chart using Mat lab (Lin et al., Citation2011). Xin Wang et al. developed an online water monitoring system using Zigbee and GPRS modules. The data was processed using Lab VIEW software (Wang, Longquan, & Yang, Citation2011). Tai Haijiang et al. developed an aquaculture monitoring system using smart sensor. The system was divided into following: data collection node, routing node, on-site monitoring centre, and remote monitoring centre. The system monitored water parameters and meteorological parameters in real time (Haijiang, Shuangyin, Daoliang, Qisheng, & Daokun, Citation2012). Francisco J proposed a real time monitoring and recirculating system for aquaculture with Zigbee technology based on the WSN. The setup consists of temperature, dissolved oxygen, air pressure, water pressure, and electric current sensor. The data measured by the module was transmitted to network coordinator. The program for monitoring is developed based on C# programming language, which runs on Windows PC for storing and displaying sensor values, comparing with the reference limits (Epinosa-Faller & Rendon-Rodriguez, Citation2012). Xiuna Zhu developed an online remote monitoring system for intensive fish culture to measure the water parameters. The system combined the mobile technology with the web server embedded technology. The system used artificial neural networks to forecast the water parameters using previously measured water parameters and reduced catastrophic losses by controlling the water parameters. The system requires a high cost for maintenance since the code division multiple access (CDMA) technology was considered for remote transfer of data, which was done through paid service through mobile networks (Zhu et al., Citation2010). D. Simbeye et al. designed and deployed WSN for aquaculture built on virtual devices. The system uses Zigbee standard for short-range communication. The system consists of sensor node, gateway node, and personal computer. The system consists of a sensor node that can measure the water parameters such as water temperature, dissolved oxygen, pH, and water level. A graphical user interface was designed to help the user to observe and analyse the measured sensor values. Two sensor nodes were installed in a fishpond and the water parameters were monitored (Simbeye, Zhao, & Yang, Citation2014).
Jaime Lloret et al. developed a group based underwater sensor network for aquaculture application. The system measures the amount of faecal waste and uneaten food deposit below the fish cage. It considered a sensor nodes mobility model, topology of network, number of sensor node (Lloret, Garcia, Sendra, & Lloret, Citation2015). Cesare Alippi et al. developed a solar powered WSN framework for aquatic monitoring. The system performs sensing activity, transmission of data to remote centre, data storage, and data visualization. A power aware Time division multiple access (TDMA) protocol is developed for local transmission, which is robust and adaptive to network topology changes. To extend battery lifetime, the WSN nodes are incorporated with adaptive energy harvesting technique and tandem batteries (Alippi, Camplani, Galperti, & Roveri, Citation2011). O. Postolache et al. developed a prototype of WSN based water quality monitoring based on Zigbee. A low cost conductive, temperature, and turbidity sensor for water quality measurement was developed (Postolache, Pereira, & Silva Girão, Citation2014). The system consists of a limited number of water quality sensors and lacks calibration system.
Presently, a lot of study has been taking place in merging the WSN with the cloud framework (Alamri et al., Citation2013; Rajesh, Pandithurai, & Mageshkumar, Citation2010). Our work focuses on using WSN–cloud for aquaculture water monitoring purpose. The research works focused on using cloud platform for environmental monitoring purposes (Kanagaraj, Kamarudin, Zakaria, Gunasagaran, & Shakaff, Citation2015; Fazio, Celesti, Puliafito, & Villari, Citation2015; Suakanto, Supangkat, Saragih, Nugroho, & Nugraha, Citation2012).
To enhance the production efficiency and to consume optimal resources available, organization focuses on every bit of information gathering and analysing that information. The data generated can be integrated with cloud services and leverage the profit, and deliver powerful service on cloud platform. This research work describes the advantages and disadvantages with respect to adopting cloud with WSN technologies (Flammini & Sisinni, Citation2014).
Bharat shah developed an assessment plan in order to provide support to organizations that provide and consume cloud based services. The assessment plan provides policies, business strategies, judiciary, and administrative requirements needed for the organizations with respect to cloud platform (Shah, Citation2015). The emerging cloud computing technology provides scalable data process and storage power and some types of connectable services, which can helpfully utilize the sensor data from the WSN. In this paper, we propose an integration framework of cloud computing with WSN, in which the sensor data is transmitted from WSN to cloud, processed and stored in cloud, then mined and analysed to be supplied to various clients. By applying virtualization and cloud storage technology, and Infrastructure as a Service (IaaS) and Software as a Service (SaaS) of cloud service model, the frameworks can fully process and store mass sensor data from multiple types of WSN. Besides, it efficiently mines and analyses sensor data, based on which the data applications are well supplied to various types of clients in the form of services (Pengfei, Huiba, Peng, & Ziyang, Citation2013).
GIS/Remote sensing based method provides geographical information on suitable site, and water samples are collected at particular spots and tested in laboratories. In order to provide water parameter changes with respect to weather condition, currently the methods are not favourable since they are not monitored real-time. A proper study on water parameters gives a clear idea that a specific fish can be grown in a particular season. Aquaculture planning is one of the key ideas, which drive farmers and vendors to plan for culturing the fishes. Currently, the entities like monitoring, site selection, data gathering, and analysis provide complete information to have ARP system. In our proposed work, we have connected the ARP through a web based application service and made accessible with the required information.
3. Proposed system design and aquaculture resource
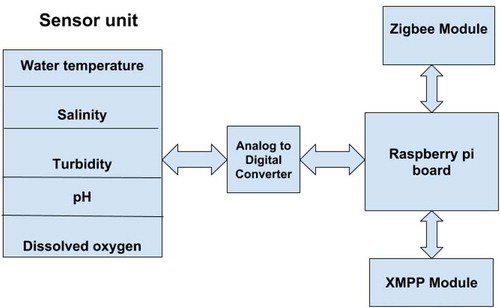
In the proposed ARP, the designed system uses entities pertaining to aquaculture farming such has open source data with respect to aquaculture cloud data centre, Mobility model for node deployment, underwater sensor unit to measure the water parameters, data acquisition and uses ETL (Extract, Transform, Load) methods. These entities help in site selection and provide information about different types of fish that can be cultured. Figure describes the ARP model architecture of proposed work for monitoring site for aquaculture. The underwater sensors measure the water parameters such as water temperature, dissolved oxygen, pH, salinity, and turbidity required for aquaculture. The sensor nodes use wireless communication to continuously send monitored data and upload it to the cloud data centre. The system consists of sensor system module integrated with API gateway in the cloud.
Figure 1. ARP System architecture for monitoring aquaculture site.
3.1. Sensor system and underwater sensor unit
The sensor system consists of communication unit, controller unit, analogue to digital convertor and water parameter measuring the sensor unit. The communication unit comprises two modules: Xbee and SIM 300GSM modules. The zigbee module in sensor system is used to communicate with the neighbouring sensor system, and the Global System for Mobile communications (GSM)/Extensible Messaging and Presence Protocol (XMPP) module is used for long-range communication with cloud data centre. The Xbee module provides wireless connectivity to devices with low power consumption produced by MaxStream (Digi Xbee-ZigBee, Citation2017). Sim 300 is a plugin device which provides Tri-band GSM/GPRS solution. The GSM module provides SMS, voice, data, and fax services at low power usability in small form factor (Sim300 modem, Citation2017). The controlling unit of the proposed sensor unit consists of raspberry pi model B. The board consists of ARM11 microcontroller@ 700 MHZ, and comes with 512 Mbytes random access memory (Raspberry pi B Model, Citation2017). The Raspberry pi does not have internal analogue to digital (ADC) converter, and hence the external ADC MCP3008 is used (MCP3008 10-bit Analog-to-Digital Converter, Citation2017). The ADC sends equivalent digital data of the sensors to raspberry using its general input/output pins (GPIO).
The water parameter measuring the sensor unit consists of temperature sensor, pH sensor, dissolved oxygen sensor, salinity sensor and turbidity sensor. Considering the work requirements related to precision, stability, budget, durability, and availability, the following sensors are selected.
Temperature sensor: DS18B20 is a digital thermometer that measures temperature from −55° C to + 125° C (−67°F .to + 257°F). Operating voltage ranges from 3–5.5 V with accuracy up to ± 0.5° C. It indicates the temperature in 9–12 bit (configurable) temperature reading. 1 – wire interface is used to send the information from DS18B20 to connected microprocessor. Operations like reading, writing, and temperature conversion use power from data line and not from external power source (DS18B20-Programmable Resolution 1-Wire Digital Thermometer, Citation2017).
pH sensor: The pH E series sensor with display from Sansel measures pH from 0 to 14, resolution of 0.01 pH and accuracy is ± 0.01pH. It can measure with temperature compensation from 0 to 100° C (pHT 692, Citation2017).
Dissolved oxygen sensor: ORP E series with display from Sansel measures dissolved oxygen from 0 to 20 mg/L. Temperature compensation is up to 50°C and resolution 0.1% mg/L. Response time = 0.06 mg/L per second (Dissolved Oxygen, Citation2017).
SAL salinity sensor: The sensor measures total non-carbonate salts dissolved in water in terms of ppt (parts per thousand). The sensor measures salinity from 0 to 50 ppt with ± 3% of full-scale accuracy. The response time of sensor is 10s for 90% of full scale reading (Salinity sensor, Citation2017).
Turbidity sensor: TSD-10 measures the amount of suspended particles in water. The sensor unit consists of optical transmitter and receiver optical diodes. The receiver optical diode measures the sum of light coming from optical transmitter in order to calibrate water turbidity (Turbidity Sensor—TSD-10, Citation2017).
The wireless radio communication is faster in fresh water yielding lower propagation delay which enables faster signal communication. The developed sensor system in our proposed work, we have carried out an investigation with respect to underwater environment. The characteristics of wireless communication with respect to underwater environment are studied with some of the parameters such as signal attenuation, conductivity, absorption loss, and underwater noise. The sensor nodes are deployed in River Netravathi, where water depth is around 5 m. The signal attenuation experienced is lower due to lower water depth. The river water conductivity ranges from 0.025 S/m to 0.075 S/m and it keep varying, due to signal propagation the absorption loss increases with increase in water conductivity. The frequency range of developed system is 2.4 GHz to make absorption losses less than 3dB at a water conductivity of 0.1 S. Underwater noise is basically caused due to manmade noises such as movement of ships, boats, and military activity. The work carried out with respected to the proposed system (at river estuaries, the ambient noise like, movement of water including tides, currents, storm, and wind, etc., are very low) is experienced very low ambient noise. Aquaculture takes place in region where human intervention is lower, and hence underwater noise is also lower.
3.2. Mobility model of surface floating node
The positioning of wireless sensor node plays a key role in measuring the water parameters for aquaculture monitoring. Considering water currents, the mobility model for sensor system architecture (Figure ) is proposed for aquaculture to find specific points with water parameter variation in the river. The sensors connected with probes are deployed to float at specific depth, and the required water parameters such as temperature, dissolved oxygen, pH, salinity, and turbidity are measured. The water parameters monitored using sensor system is transmitted to cloud data centre through XMPP protocol which registers the data into a MySQL database using web services developed in Hypertext Preprocessor (PHP). Locating the floating positions of the sensor is sufficient for obtaining mobility feature of floating sensor network. This helps in node position planning in order to choose specific spots in the river where the sensor nodes can be deployed, and the water parameters are measured timely in design and planning of aquaculture.
Figure 2. Sensor system architecture for real time aquaculture monitoring.
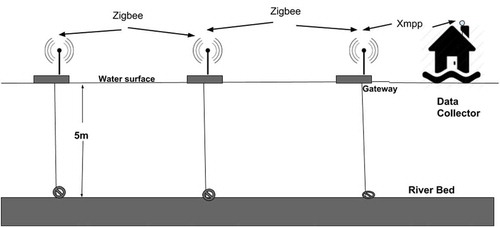
The nodes form restricted floating model since they are anchored to the river bed (Mo, Yang, & Liu, Citation2013). The node movement forms a circular motion within a conical structure with radius 0.55 m for depth of 5 m for maximum angle (Lloret et al., Citation2015) formed due to movement of sea water is 40° as shown in Figure :
Figure 3. Movement of sensor nodes floating at water surface anchored to riverbed.
where
sm is mass of sensor node,
Vnode is volumeof sensor node,
g is gravitational acceleration due to earth gravity,
is fluid density,
is sensor density,
is water flow.
Figure describes the different positions of the node, which predicts the mobility behaviours to achieve high accuracy with reduced overhead for measured water parameters. By locating the floating positions of the sensor, it is sufficient for obtaining mobility feature of the floating sensor network. This helps in node position planning in order to choose specific spots in the river where the sensor nodes can be deployed and the water parameters are measured timely in design and planning of aquaculture.
Figure 4. Sensor node position due to water currents.
3.3. Open source data and data centre
For aquaculture system planning, the information is needed regarding site suitability for culturing and cage placement strategy which is available with government organizations such as CMFRI. The CMFRI has set up various farms of sea cage aquaculture in states like Andhra Pradesh, Orissa, Maharashtra, Vishakhapatnam, and Karnataka. They also provide training facilities for farmers to promote aquaculture farming. They have developed various techniques to breed and rear larva. In our proposed work, data have been collected regarding site selection for aquaculture, fish seed availability, fish breeding and fish feeding information from the CMFRI. Collecting open source data, an API is developed and connected with our ARP system and the news feed will be updated in the system and will be available for the farmers for planning.
Sensor-Cloud is the integration of cloud computing and WSN. It invokes the paradigm SaaS. Several IT people in the present days have evolved and proposed the sensor-cloud infrastructure (Durao, Carvalho, Fonseka, & Vinicius Cardoso, Citation2014). A cloud infrastructure is established to organize and manage sensor-based cloud computing for WSN. Extensive research work is carried out in the field of sensor applications and the number is increasing. The sensor cloud technology fulfils the requirements to design and develop cloud based sensor computation and to deploy the service applications. Collecting data, processing, and analysing is implemented with defined set of framework in the cloud platform (Kwon & Tilevich, Citation2013). In our work, the deployed underwater sensor network is connected to cloud data driven gateway through API, and the measured water parameters data has been stored and analysed.
4. Aquaculture resource planning model
This section uses resources defined in Section 3 for developing an aquaculture monitoring system for river site selection, the methodology and implementation is carried out.
4.1. Sensor system design
The overall sensor system comprises raspberry pi B model board, communication module, power supply board, 8 channel 10-bit ADC (MCP3008), and sensor units. Figure shows the block diagram of the sensor system hardware. The sensor unit measures water parameters such as temperature, dissolved oxygen, pH, salinity, and turbidity. The sensor units are connected to ADC unit and the equivalent digital data of the measured sensor values are interfaced to GPIO pins of raspberry pi board. The raspberry pi sends the measured data to cloud data centre using GSM/XMPP communication modules.
Figure 5. A block diagram of the sensor system hardware.
Raspberry pi is uploaded with developed software program to acquire the data from the sensor unit. The raspberry pi checks for variation in the water parameters with respect to threshold values. The threshold values are set to specific values which are favourable for fish life. If there is a variation in the measured value with respect to the threshold, then an alert signal is sent. The sensor unit goes to sleep mode after transmitting to preserve battery voltage. The sleep mode time interval can be changed depending on the requirement.
Figure shows a flow chart for sensor system operation. The main function of the sensor system is to measure the water parameters of the river sites that can be considered for aquaculture. The sensor system measures the water parameters such as temperature, dissolved oxygen, pH, salinity, and turbidity. The measured water parameter is compared with the threshold sensor value, which is set to specific limit required for the aquaculture as shown in Table .
Table 1. Threshold parameter for aquaculture
Figure 6. A flowchart describing the working of the sensor system.
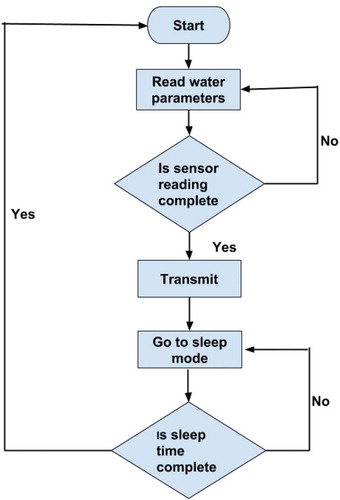
If the measured sensor value falls within the required optimum range, the data are transmitted to cloud data centre. If there is a variation, an alert message along with measured data is transmitted to known about emergency occurring at specific time to cloud data centre. For example, at night, there will be a drop in dissolved oxygen rate in water bodies due to respiration of both aquatic plants and animals. This situation may cause severe oxygen depletion, causing fish kill. Therefore, it is important to track such changes in water environment affecting fish life at a certain period. The sensor node goes into sleep mode after correctly transmitting the measured sensor values to cloud data centre. The sleep mode is incorporated to save the battery energy in order to prolong the sensor node lifetime. The dataset is considered for a specific period from the river site, which is considered for aquaculture. This data set is trained using a classifier model. The knowledge gained from the classifier model is used to decide whether the site is suitable, moderate or not suitable for the aquaculture.
4.2. Cloud architecture
The accuracy of gathering data is achieved using wireless sensor network (WSN) and promotes to apply new sensing strategies. Underwater wireless sensor system is connected to the gateway to collect the sensed water parameters data. The collected data is loaded to database server, analysed, and made available to the users accessed to the aquaculture web application, which is described in Figure .
Figure 7. Sensor cloud architecture for WSN gateway.
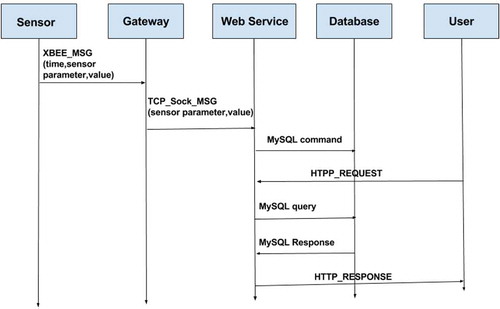
Figure describes the sequence diagram of ARP application called “Aquaward”. The sensor system is one part of our ARP, which provides important information with respect to the water parameters. The sensor system which is deployed in the water to sense the water parameter such as temperature, salinity, dissolved oxygen, pH, and turbidity are transmitted using xbee message to the gateway connected to the cloud architecture. Web service is deployed in the cloud, and MySQL server is used to store and process the data. When user accesses the web application, the HTTP request is sent for the required information, and the user receives the HTTP response request based on the request sent.
Figure 8. Sequence diagram of aquaculture resource planning application.
4.3. High level technical design and activity diagram
The methodology of Model-View-Controller (MVC) web application model is used to develop the proposed system. Jersey and Thrift is implemented, which accepts calls to get query results from the user and the sensors are deployed at selected site for aquaculture monitoring. An application programmable interface (API) is developed for our aquaculture resources model and connected each other; the external system makes synchronous and asynchronous calls using the service request. Internally, each service talks each other to achieve accuracy for requested query, and also handles specific tasks. An index is used to clone the data while the database connection established between the service and the external system. This includes information such as: Type of Connection used such as MySQL database engine using SQL server authentication, DB schema and the developed application is deployed on Azure platform. The hosted application is can be accessed on www.aquaward.in. The database connection established with application on Azure through, IMAP port 1433 and 80.
The proposed diagram of the web application activity described in Figure gives the dynamic aspects of the system design. The flow between one activity to another activity for our web service is represented, and the application can be accessed on www.aquaward.in
Figure 9. Activity diagram of web application.
4.4. Case study
4.4.1. Data clustering
Clustering technique is used based on k-means algorithm to generate collected information on a centroid base.
Listing 1 The pseudo code for building cluster of information is
Select k number of clusters to be Determined\\here k = three rivers which corresponds to Nethravathi, Sita, and Shambhavi.
Select k objects as the initial cluster centre\\fishes are selected as cluster centre.
Rerun
(3.1) Find the closest cluster and assign to each object\\related river site points are selected and if a new position found, the new river point is selected with the fish.
(3.2) Calculate the mean point and compute new cluster\\if it is different fish with respect to the river, new cluster is formed and assigned for computation.
Until
(4.1) Keep the centroid point, no changes on cluster centres and no object changes its cluster\\group the information and push it for data driven model
(4.2) Calculate residual sum of squares (RSS) to known how the centroids represent the members of their clusters.
To minimize RSS the algorithm moves the cluster centres around in space
where
with respect to n
= information cluster k with respect to n
Listing 2 Pseudo-code: To find centroid
Step 1: Initialize global counter = 0;\\initially global counter will be 0 value.
Step 2: Centroid to new list < centroid>;\\variable a is the centroid and a new list of string array is defined.
Step 3: Increment the list < Centroid> Centroid collection;\\first input string, the value increments the centroid position in the array list.
Step 4: For each initial position assign \\for a centroid (fish name) unique key is assigned in the list position, which identifies the cluster.
Step 5: Assign variable \\for new string variable
is assigned to centroid
Step 6: Assign first group information to the \\new list of group information is initiated.
Step 7: Update the and add
\\the group information will be keep updated to the centroid collection.
To know significant variation between the rivers in order to know the suitability for culturing different types of fishes at specific river site spot is analysed using ANOVA and Z test as explained below. The water parameters for river Netravathi, Sita, and Shambhavi are considered from (Mridula, Rajesh, & Reddy, Citation2014; Shetty, Venkateshwarlu, & Muralidharan, Citation2015).
Listing 3 ANOVA test for three river using water parameter
ANOVA test
Use case:
Salinity distribution is considered for four months; from August to November
Let,
Ho = there is no difference between the river parameters
Ha = there is no difference between the river parameters
F-ratio calculation:
T = 1 + 2 + 2 + 2 + 9 + 10 + 10 + 16 + 33 + 33 + 34 + 36
= 188
n = number of samples
= 12
Correction factor = T 2/n
Total sum of squares = SStotal =
Sum of squares between = SS Between =
Sum of squares within; SS within =
Finding the F-calculated and F-tabulated
47.14 < 4.26
Therefore is in rejection region.
Hence, reject the null hypothesis.
This result shows there is a difference between the river water parameters with respect to salinity distribution.
Listing 4 Z-test for two rivers using river water parameter
Z -test
Z-test is used if the sample size is large and is a two-tailed test.
Hence significance which is 1.96 with respect to Statistical Table (Ztable, Citation2017)
Normalized distribution
Therefore, reject the null hypothesis because falls under rejection region.
From the statistical analysis using ANOVA and Z-test, the three rivers are different with respect to their water parameters at a specific river site spot considering the salinity distribution. This can be considered for aquaculture planning by culturing different types of fishes.
The data used for the system development are shown in Tables and . Table specifies river water parameters, fish seed availability in river with respect to months. Table specifies water parameter requirements for specific fish species, fish habitat and feeding habits.
Table 2. Water parameter salinity measured in NTU from rivers
Table 3. River details with respect to water parameters, fish seed availability, and duration of farming specific fish species (Mridula et al., Citation2014; Arunkumar Shetty et al., Citation2015 ; Asia sea bass, Citation2017 )
5. Results and discussion
The results of clustering are shown in Table , which specifies different fish species that can be cultured for a specific river.
Table 4. Standard water parameter required for specific fish species, habitat, and feeding habits (Sujitha Indian prawns, Citation2017 ; Thomas, Citation2017 ; Tigershrimp, Citation2017). Where, 1 mg/L = 1 ppm
Table 5. Clustering results of three rivers with respect to fish species
The clustering is applied to the real-time information, based on fishes that are cultured in these three rivers. Here, fishes such as Sea bass, Red snapper, Mullet, and Pearl spot can be cultured throughout the year, where the information pertaining to this river site with standard water parameter, and seed availability information will be updated and it can be accessed with the group of information as an article for farmers.
5.1. Aquaward application
The proposed SaaS service for ARP application is designed and developed called “Aquaward”. Our objective is the long-term economic, educational, nutritional, and environmental advancement of communities, with “The Fish Farm” being the catalyst for this process to happen. Figure shows the application-landing page for the user access with an option to get started and for user account creation. The user can access the application through www.aquaward.in, on the right pane, create an account and get started with the application. The Aquaward application on the left navigation pane, with options directs to site selection, water parameter, details about different fishes, farming seasons depending on seed availability, and articles from the open source entities with respect to planning and development of aquaculture.
Figure 10. User interface.
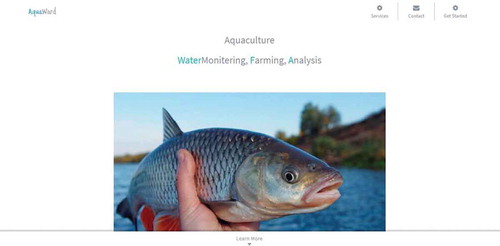
Figure gives an overview of the admin dashboard with statistics of users, server load, and aquaculture trends with an activity calendar. This is also connected with the notifications to the users and on the left side navigation bar with the aquaculture service options.
Figure 11. Admin dashboard.
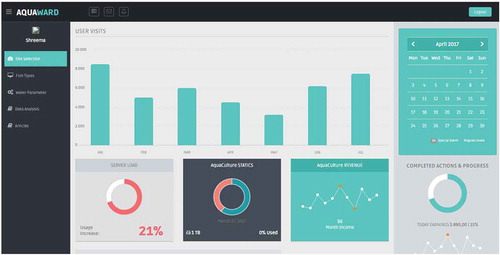
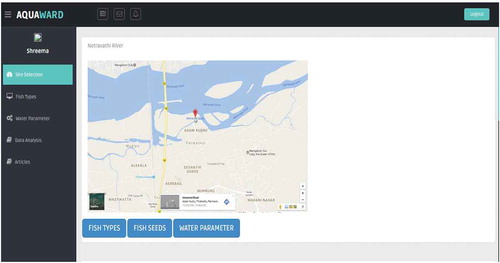
Figure gives the service option for selecting the sites for aquaculture, which works on backend analysis with respect to the selection of rivers with parameters connected for suitable for fish culturing. Considering the use case, we have shown Nethravati river and the selection has been carried out as shown in Section 4.3 with the river details clustering of information applied. The users select the site selection option on the left navigation bar, and in our use case we have considered Nethravathi river site at Adam Kudru. When the user selects the river site option, the users can access the options related to a particular site with types of fishes, which can be farmed with the standard water parameter reading.
Figure 12. Site selection.
Water parameter option is exclusive for a particular river site, where the users can select the river. The fish type’s option provides the complete information about different fish, with the seed availability for a particular fish. The data analysis option provides information about water parameters variation with respect to seasons and time at a particular river site. The proposed application enables farmer groups, aquaculture businesses, government, and non-government agencies working with smallholder farmers make informed decisions, improve overall operational efficiency, and traceability.
6. Conclusion
A software-as-a-service based ARP system and a data driven architecture is proposed. The system for river site selection collects the data related to water parameters for a specified period and the information communicates to cloud data centre. ANOVA and Z-test are applied on three river water parameters to know the significant variation between the rivers. The system includes a decision model to know the suitability of river site with respect to the type of fishes, and helps the user to find which fish are favourable to culture for the selected site. The ARP system provides online support service for water monitoring and assistance for setting up the aquaculture by providing a detailed information regarding the site suitability, water parameters, fish types, seeds for feeding, and aquaculture articles. The proposed software-as-a-service application is the first ARP system wherein the users can access the information required for planning and development of an aquaculture farm.
The future work of the developed SaaS application may be extended to the internet of things (IoT) and create plug and access information devices for aquaculture. The knowledge database can be created and made self-driven for better user engagement and also used for future predictions.
Cover Image
Source:

Additional information
Funding
Notes on contributors
Shreema Shetty
Shreema Shetty is a research scholar at MIT, MAHE. She completed her Undergraduate and Postgraduate in the field of Electronics and Communication. She has 4 years of experience in teaching and 6 years has technology evangelist. Her research interests include digital communication, cloud computing, blockchain technology, and IoT.
Radhika M Pai
Radhika M. Pai is a Professor in the Dept. of ICT, MIT, MAHE. She has 25 years of teaching and industry mentoring experience. She has published 50 technical papers. Her areas of interests include Data Mining, Big Data Analytics, Character Recognition, Sensor networks and e-learning.
Manohara M. M. Pai
Manohara M. M. Pai is a Professor in the Department of ICT, MIT, MAHE. He has 26 years of teaching and industry mentoring experience. He holds six patients to his credit and published 80 technical papers. His research interests include data analytics, cloud computing, IoT, computer networks, mobile computing, scalable video coding, and robot motion planning.
Related Research Data
References
- Alamri, A. , Ansari, W. S. , Hassan, M. M. , Hossain, M. S. , Alelaiwi, A. , & Hossain, M. A. (2013). A survey on sensor-cloud: Architecture, applications, and approaches. International Journal of Distributed Sensor Networks , 9(2).
- Alippi, C. , Camplani, R. , Galperti, C. , & Roveri, M. (2011). A robust, adaptive, solar-powered WSN framework for aquatic environmental monitoring. IEEE Sensors Journal , 11, 45–55. doi:10.1109/JSEN.2010.2051539
- Asian sea bass . (2017, October 10). Retrieved from: http://agritech.tnau.ac.in/fishery/fish_seafishes.html
- Bosma, R. H. , & Verdegem, M. C. J. (2011). Sustainable aquaculture in ponds: Principles, practices and limits. Livestock Science , 9, 58–68. doi:10.1016/j.livsci.2011.03.017
- Cella, U. M. , Johnstone, R. , & Shuley, N. (2009). Electromagnetic wave wireless communication in shallow water coastal environment: Theoretical analysis and experimental results. Proceedings of the Fourth ACM International Workshop on Underwater Networks , Berkeley, California, USA, 1–8.
- Chien, Y. (1992).Water quality requirements and managements for marine shrimp water culture. Proceedings of the Special Session on Shrimp Farming . World Aquaculture Society, USA, pp. 144–156.
- Davies, B. , & Bromage, N. (2002). The effects of fluctuating seasonal and constant water temperatures on the photoperiodic advancement of reproduction in female rainbow trout, Oncorhynchus mykiss. Aquaculture , 205, 183–200. doi:10.1016/S0044-8486(01)00665-2
- Digi Xbee-ZigBee . (2017, November 12). Retrieved from: https://www.digi.com/lp/xbee.
- DS18B20-Programmable Resolution 1-Wire Digital Thermometer . (2017, November 12). Retrieved from: https://www.maximintegrated.com/en/products/analog/sensors-and- sensor-interface/DS18B20.html
- Durao, F. , Carvalho, J. F. S. , Fonseka, A. , & Vinicius Cardoso, G. (2014). A systematic review on cloud computing. The Journal of Supercomputing , 68, 1321–1346. doi:10.1007/s11227-014-1089-x
- Epinosa-Faller, F. J. , & Rendon-Rodriguez, G. E. (2012). A ZigBee wireless sensor network for monitoring an aquaculture recirculating system. Journal of Applied Research and Technology , 10, 380–387.
- Ertuð, K. , & Mirza, I. (2010). Water quality: physical, chemical and biological characteristics (Chapter 3 (pp. 1–96). New York, NY: Nova Science Publishers.
- Fazio, M. , Celesti, A. , Puliafito, A. , & Villari, M. (2015). Big data storage in the cloud for smart environment monitoring. Procedia Computer Science , 52, 500–506. doi:10.1016/j.procs.2015.05.023
- Flammini, A. , & Sisinni, E. (2014). Wireless sensor networking in the internet of things and cloud computing era. Procedia Engineering , 87, 672–679. doi:10.1016/j.proeng.2014.11.577
- Food and Agriculture Organization of the United Nations . National Aquaculture Sector Overview: India. (2018, February 12). Retrieved from: http://www.fao.org/fishery/countrysector/naso_india/en.
- Glasgow, H. B. , MBurkholder, J. , EReed, R. , JLewitus, A. , & Joseph, E. (2004). Real-time remote monitoring of water quality: A review of current applications, and advancements in sensor, telemetry, and computing technologies. Journal of Experimental Marine Biology and Ecology , 300(409–448). doi:10.1016/j.jembe.2004.02.022
- Haijiang, T. , Shuangyin, L. , Daoliang, L. , Qisheng, D. , & Daokun, M. (2012). A multi-environmental factor monitoring system for aquiculture based on wireless sensor networks. Sensor Letters , 10, 265–270. doi:10.1166/sl.2012.1851
- Hargreaves, J. A. (2006). Photosynthetic suspended-growth systems in aquaculture. Aquacultural Engineering , 34, 344–363. doi:10.1016/j.aquaeng.2005.08.009
- Indian prawns . (2017, May 16). Retrieved from: http://agritech.tnau.ac.in/fishery/fish_freshwaterprawn.html
- José Juan Carbajal Hernández, L. P. , Fernández, S. , & Oleksiy, P. (2011). Assessment and prediction of the water quality in shrimp culture using signal processing techniques. Aquaculture International , 19, 1083–1104. doi:10.1007/s10499-011-9426-z
- Kanagaraj, E. , Kamarudin, L. M. , Zakaria, A. , Gunasagaran, R. , & Shakaff, A. Y. M. (2015). Cloud-based remote environmental monitoring system with distributed WSN weather stations. 2015 IEEE SENSORS , Busan, South Korea, 1–4.
- Kwon, Y.-W. , & Tilevich, E. (2013). Cloud refactoring: Automated transitioning to cloud-based services. Automated Software Engineering , 21, 345–372. doi:10.1007/s10515-013-0136-9
- Lin, Q. , Jian, Z. , Mark, X. , Zetian, F. , Wei, C. , & Xiaoshuan, Z. (2011). Developing WSN-based traceability system for recirculation aquaculture. Mathematical and Computer Modelling , 53, 2162–2172. doi:10.1016/j.mcm.2010.08.023
- Lloret, J. , Garcia, M. , Sendra, S. , & Lloret, G. (2015). An underwater wireless group-based sensor network for marine fish farms sustainability monitoring. Telecommunication Systems , 60, 67–84. doi:10.1007/s11235-014-9922-3
- Longdill, P. C. , Healy, T. R. , & Black, K. P. (2008). An integrated GIS approach for sustainable aquaculture management area site selection. Ocean and Coastal Management , 51, 612–624. doi:10.1016/j.ocecoaman.2008.06.010
- MCP3008 10-bit Analog-to-Digital Converter . (2017, November 12). Retrieved from: http://www.microchip.com/wwwproducts/en/MCP3008
- Mo, L. , Yang, Z. , & Liu, Y. (2013). Sea depth measurement with restricted floating sensors. ACM Transactions on Embedded Computing Systems , 13, 21.
- Mridula, R. , Rajesh, K. M. , & Reddy, H. R. V. (2014). Assessment of Microbial population in relation with hydrographical characteristics in Netravati and Gurupur Estuaries ofMangalore, South-West coast of India. The Ecoscan , 8, 253–256.
- Dissolved Oxygen . (2017, November 12). Retrieved from: http://www.sansel.in/pdf/Other-Marketing-Products/Dissolved-Oxygen-Meter.pdf
- Pérez, O. M. , Ross, L. G. , Telfer, T. C. , & Campo Barquin, L. M. (2003). Water quality requirements for marine fish cage site selection in Tenerife (Canary Islands): Predictive modeling and analysis using GIS. Aquaculture , 224, 51–68. doi:10.1016/S0044-8486(02)00274-0
- pHT 692 . (2017, November 12). Retrieved from: http://www.sansel.net/products/analytical-instruments/ph-indicator-transmitter-manufacturer-in-india/
- Postolache, O. , Pereira, J. D. , & Silva Girão, P. (2014). Wireless sensor network-based solution for environmental monitoring: Water quality assessment case study. IET Science,Measurement and Technology , 8, 610–616. doi:10.1049/iet-smt.2013.0136
- Rajesh, V. , Pandithurai, O. , & Mageshkumar, S. (2010). Wireless sensor node data on cloud. 2010 International Conference on communication Control and Computing technologies , Ramanathapuram, India, 476–481.
- Raspberry pi B Model . (2017, May 12). Retrieved from: https://www.raspberrypi.org/products/model-b/
- Salinity sensor . (2017, May 12). Retrieved from: https://www.vernier.com/products/sensors/sal-bta/
- Sendra, S. , Lloret, J. , Rodrigues, J. J. P. C. , & Aguiar, J. M. (2013). Underwater wireless communications in freshwater at 2.4 GHz. IEEE Communications Letters , 17, 1794–1797. doi:10.1109/LCOMM.2013.072313.131214
- Shah, B. (2015). Cloud environment controls assessment framework. In Cloud technology: Concepts, methodologies, tools, and applications (pp. 580–606), Information Resources Management Association, USA. IGI Global.
- Shahadat Hossaina, M. , & Chowdhurya, S. R. (2009). Integration of GIS and multicriteria decision analysis for urban aquaculture development in Bangladesh. Landscape and Urban Planning , 90, 119–133. doi:10.1016/j.landurbplan.2008.10.020
- Shetty, A. , Venkateshwarlu, M. , & Muralidharan, M. (2015). Effect of water quality on the composition of fish communities in three coastal rivers of Karnataka, India. International Journal of Aquatic Biology , 3, 42–51.
- SIM300 GSM Modem . (2017, May 20). Retrieved from: http://www.nskelectronics.com/sim300_modem_with_rs232.html
- Simbeye, D. S. , Zhao, J. , & Yang, S. (2014). Design and deployment of wireless sensor networks for aquaculture monitoring and control based on virtual instruments. Computers and Electronics in Agriculture , 102, 31–42. doi:10.1016/j.compag.2014.01.004
- Suakanto, S. , Supangkat, S. H. , Saragih, S. R. , Nugroho, T. A. , & Nugraha, I. G. B. B. (2012). Environmental and disaster sensing using cloud computing infrastructure. 2012 International Conference on Cloud Computing and Social Networking (ICCCSN), Bandung, West Java, Indonesia, 1–6.doi: 10.1109/ICCCSN.2012.6215712S.
- Thomas, S. Capture based aquaculture of red snapper Lutjanus argentimaculatus in cages. (2017, September 12). Retrieved from: eprints.cmfri.org.in/9724/1/Sujitha.pdf
- Tigershrimp . (2017, May 12). Retrieved from: http://agritech.tnau.ac.in/fishery/fish_shrimps.html
- Turbidity Sensor - TSD-10 . (2017, November 12). Retrieved from: http://amphenol sensors.com/en/products/temperature/turbidity
- Wang, X. , Longquan, M. , & Yang, H. (2011). Online water monitoring system based on ZigBee and GPRS. Procedia Engineering , 15, 2680–2684. doi:10.1016/j.proeng.2011.08.504
- Wireless water monitoring system . (2017, February 12). Retrieved from: https://www.ipi-singapore.org/technology-offers/wireless-water-monitoring-system-aquaculture-and-environmental-professionals
- Pengfei, Y. , Huiba, L. , Peng, Y. , & Ziyang, L. (2013). An integration framework of cloud computing with wireless sensor networks. Ubiquitous Information Technologies and Application , 214, 381–387.
- Zhu, X. , Daoliang, L. , Dongxian, H. , Wang, J. , Daokun, M. , & Feifei, L. (2010). A remote wireless system for water quality online monitoring in intensive fish culture. Computers and Electronics in Agriculture , 715, 53–59.
- Ztable . (2017, February 12). Retrieved from http://www.stat.ufl.edu/~athienit/Tables/Ztable.pdf