
 ?Mathematical formulae have been encoded as MathML and are displayed in this HTML version using MathJax in order to improve their display. Uncheck the box to turn MathJax off. This feature requires Javascript. Click on a formula to zoom.
Abstract
Unreinforced soft-brick masonry structures comprise a large portion of buildings in earthquake prone regions of India. Recent earthquakes have extensively damaged such structures. Experimental and numerical studies on soft brick unreinforced masonry structures are scarce in literature. In this paper, numerical simulation of soft brick unreinforced masonry panels subjected to lateral loads is performed. At the panel level, the masonry structure is modelled using the micro modelling approach within a finite element framework. Monotonic load envelope curve is generated through a pushover analysis of the finite element model. The in-plane failure modes are identified, and the effect of aspect ratio and axial stress on failure is examined. Cyclic load analyses are performed on the finite element model to understand the complex hysteretic behaviour of unreinforced soft-brick masonry walls.
PUBLIC INTEREST STATEMENT
Unreinforced soft-brick masonry structures comprise a large percentage of buildings in earthquake prone regions of India. These regions have witnessed several destructive earthquakes in the past. Recent earthquakes have caused extensive damage to soft brick URM structures. There is a dearth of literature on experimental and numerical analyses on soft-brick masonry structures, leading to a poor understanding of the behaviour of such structures. In this study, numerical simulations of soft brick masonry walls are performed using micro modelling approach. Monotonic pushover curves are developed and the in-plane failure modes are identified. Cyclic load analyses are performed on the finite element model to understand the complex behaviour of soft brick masonry walls.
1. Introduction
Unreinforced brick masonry (URM) has been the predominant form of construction for centuries and represents a large part of building heritage (Formisano, Citation2017a, Citation2017b; Formisano, Florio, Landolfo, & Mazzolani, Citation2015). Due to its low cost, durability and widespread geographic availability, it still finds extensive use as a building material. Also, as compared to reinforced concrete, masonry is advantageous in low rise structures as it eliminates the need for expensive formwork, heavy machinery and equipment for concrete pouring (Akan, Citation2008). The Prompt Assessment of Global Earthquakes for Response (WHE-PAGER, Citation2007) rating for unreinforced masonry building stock in India is high, as about 69% of building inventory in India is made of unreinforced clay fired brick masonry. URM structures are particularly suitable to carry compressive loads and are extensively adopted in regions with low seismic activity and masonry walls in such structures are designed to support only gravity loads.
However, in earthquake prone areas, due to the cyclic nature of earthquake forces, URM walls are required to resist the combined effects of shear force, bending moment, vertical loads and overturning moments. As URM walls have relatively low load carrying capacity in tension and shear, they are particularly vulnerable under seismic action. In India, there is a considerable variation in the strength of bricks with the geographic location: the strength of clay bricks ranges from 3 to 20MPa, depending on the region (Bureau of Indian Standards, Citation1991). The lack of automation in the production process and the use of kilns at lower firing temperature results in soft bricks (Bureau of Indian Standards, Citation1991). While exhaustive experimental and numerical research is available on seismic behaviour of URM structures comprising strong, stiff bricks as units (FEMA P-774, Citation2009; Formisano, Citation2012; Formisano, Florio, Landolfo, & Mazzolani, Citation2011; Formisano & Marzo, Citation2017; Milani & Venturini, Citation2011; Quagliarini, Maracchini, & Clementi, Citation2017; Vemuri, Ehteshamuddin, & Kolluru, Citation2018), the seismic behaviour of low strength brick masonry comprising weak, soft bricks is still not clearly understood (Ravula & Subramaniam, Citation2017). Masonry being a nonhomogeneous composite material, the nature of stresses developed in it depends on the relative elastic properties of the masonry unit and mortar. Even the available research on in-plane wall behaviour is limited and inconsistent due to variation in materials, experimental procedures and modes of reporting (Federal Emergency Management Agency, Citation1999). Further, there is lack of calibrated hysteretic models to predict the seismic response of load-bearing soft brick masonry structures.
Overall, the above observations indicate the need to evaluate the seismic behaviour of soft brick URM structures. In this paper, the in-plane behaviour of soft brick URM wall is modelled at the panel level using the micro modelling approach within a finite element framework. The in-plane failure modes are identified, and the effect of aspect ratio and axial stress on failure is examined. Cyclic load analyses are performed on the finite element model to understand the complex hysteretic behaviour of unreinforced soft-brick masonry walls.
2. Literature review
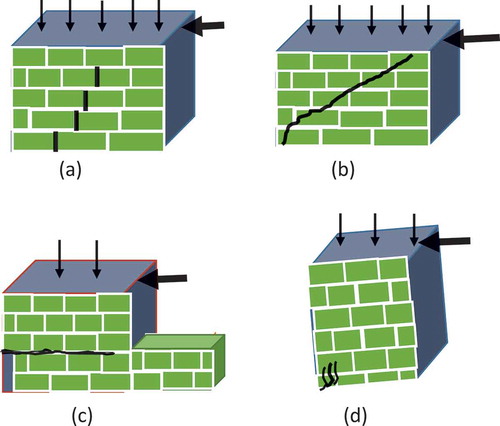
Observations from earthquake reconnaissance surveys and results from laboratory experiments show principally three types of failure mechanisms which define the seismic behaviour of masonry walls subjected to in-plane seismic loads (Tomaževič, Citation2006). These principal modes of failure of load-bearing masonry walls are identified with shear cracking, bed-sliding and flexural cracking (or rocking) and are shown in Figure . The lateral load resistance and the peak load capacity depends on the mode of failure in the pier. The mechanism of lateral force resistance depends on several factors, which include the pier geometry (the aspect ratio), boundary conditions, magnitude of vertical stress and the characteristics of brick, mortar and brick mortar interface (Haach, Vasconcelos, & Lourenco, Citation2011).
Figure 1. (a) Mortar head joint shear cracking, (b) diagonal shear cracking through brick, (c) sliding cracking and (d) flexural cracking.
Despite being the oldest construction material, masonry is the least understood (Abrams, Citation2001). Although the application of modern principles of mechanics for analyses of masonry has been an active research area (Orduna, Citation2003), the use of structural masonry is limited by the fact that the research and development of design rules have not kept pace with the developments in concrete and steel. This is primarily due to a lack of understanding of the complex behaviour of masonry as a composite comprising of units, mortar and joints. Masonry is heterogeneous and anisotropic, made up of brick and mortar arranged in a periodic or non-periodic manner. While the different mechanical properties of brick and mortar cause heterogeneity, the possibility of various geometries and arrangement of brick and mortar leads to anisotropy. Consequently, the nonlinear behaviour of masonry is highly complicated – the two constituents, brick and mortar, are quasi-brittle and have a significant difference in stiffness. The complex interaction between the constituents heavily influences the structural response. The lack of homogeneity and standardization (Drysdale, Hamid, & Baker, Citation1994; Hendry, Citation1991) causes masonry to exhibit unusual mechanical behaviour. Several constitutive models have been proposed for modelling masonry (Avossa & Malangone, Citation2015; Giordano, Mele, & De Luca, Citation2002; Lemos, Citation1995; Lotfi & Shing, Citation1991, Citation1994; Lourenco, Citation1996; Lourenco, Rots, & Feenstra, Citation1995; Pegon & Anthoine, Citation1994).
In literature, the behaviour of masonry has been simulated numerically at three levels: macro modelling, detailed micro modelling and simplified micro modelling. In macro-modelling, the bricks units, the mortar and the brick unit-mortar interface are smeared out in the anisotropic continuum, and there is no distinction between units and joints (Aldemir, Citation2010). Typically, macro-modelling is preferred to model large masonry structures and to understand global behaviour (Abdulla, Cunningham, & Gillie, Citation2017). In detailed micro-modelling, the unit and mortar are represented by discrete, continuum elements, while discontinuous elements represent the unit-mortar interface. This procedure is preferred to model small structures and to understand heterogeneous stresses and strains (Akhaveissy & Desai, Citation2011). However, the micro-modelling approach is very accurate but computationally intensive (Elgawady, Lestuzzi, & Badoux, Citation2006). Consequently, the simplified micro-modelling of masonry has been increasingly used by researchers (Berto, Saetta, Scotta, & Vitaliani, Citation2004; La Mendola, Accardi, Cucchiara, & Licata, Citation2014; Milani, Citation2008; Shing, Schuller, & Hoskere, Citation1990; Stavridis & Shing, Citation2010). The approach was first developed by Arya and Hegemier (Citation1978) and Page (Citation1978), who modelled masonry by modelling the brick elements as discrete, continuum elements and the mortar joints as interface elements. Lotfi and Shing (Citation1994) extended the approach by representing the fracture of mortar joints by interface elements. Lourenco and Rots (Citation1997) developed a multi-surface interface model by including three yield effects: cap model for compressive failure, tension cut-off for tensile failure and Mohr-Coulomb failure envelope for shear failure. Shing and Cao (Citation1997) modelled partially grouted masonry shear walls by using a smeared crack model for representing the fracture behaviour of masonry units and plasticity-based interface elements for simulating tensile and shear response of mortar joints. Oliveira and Lourenco (Citation2004) extended the Lourenco and Rots (Citation1997) model to damage formulation for simulating the cyclic behaviour of the interface element.
In this paper, the in-plane behaviour of soft brick URM at the panel level is numerically investigated using the simplified micro modelling approach of Lourenco (Citation1996).
3. Simplified numerical analysis of soft brick masonry walls
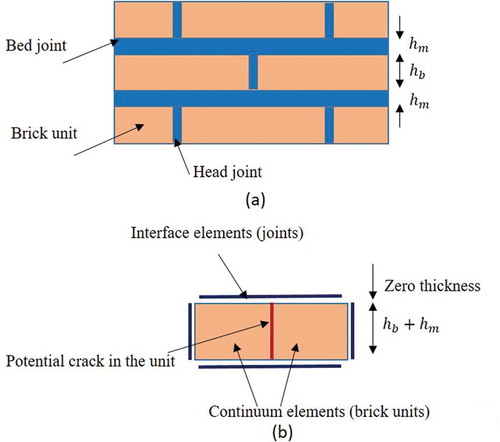
Numerical models are used for a better understanding of the behaviour of masonry walls for scenarios different from the ones tested in experiments. In this paper, the simplified micro-modelling strategy is adopted, and numerical simulations are performed to assess the lateral load response of masonry walls made with soft bricks. All the basic types of failure mechanisms associated with masonry, namely diagonal shear failure, bed-joint sliding failure and flexural failure are evaluated. Numerical modelling of masonry walls is performed using the software DIANA (TNO DIANA BV, Citation2011). Parametric studies are performed for different combinations of aspect ratios of the wall and axial stress on the wall. The simplified micro-modelling strategy shown in Figure is adopted wherein all failure modes are concentrated in joint interfaces and tensile crack interfaces placed vertically in the middle of each unit. The crack interface reproduces the jump from one head joint into the other, implying that all inelastic phenomena occur in the interface elements resulting in a robust type of modelling. In micro-modelling, zero thickness interface is adopted, and the size of the unit is expanded by half mortar thickness in both directions.
Figure 2. (a) Actual masonry sample. (b) Simplified micro modelling strategy.
Interface model is represented in terms of generalized stress and strain vectors as
where
where
= stress and relative displacement, respectively in interface normal direction
= shear stress and relative displacement, respectively
= normal and tangential stiffness, respectively
For the numerical implementation of the simplified micro-modelling approach for the case of masonry with soft brick, the normal and shear stiffness, and
, of the interface elements are derived. Considering a unit thickness of the interface, the
and
are derived for the case where the brick has a lower elastic stiffness than the mortar. The total lateral displacement for an applied shear stress, τ for the unit cell consisting of brick and mortar with full-thickness (Figure )) is given as
Figure 3. (a) Masonry brick and joint sample. (b) Simplified micro model.
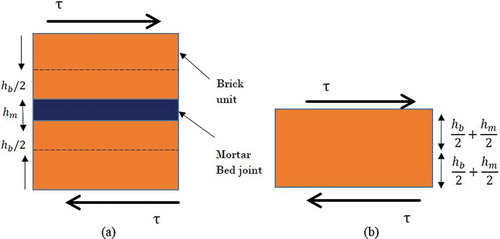
The total lateral displacement for applied shear stress, τ for the unit cell consisting of brick and interface layer of unit thickness is computed as (Figure ))
Total lateral displacement
Equating Equations (5) and (6), we get
Similarly, the normal stiffness can be derived as
where = shear modulus of mortar joint,
= shear modulus of brick,
= shear modulus of brick mortar interface,
= elastic modulus of mortar joint,
= elastic modulus of brick,
= elastic modulus of brick mortar interface,
= height of brick unit,
= height of mortar joint.
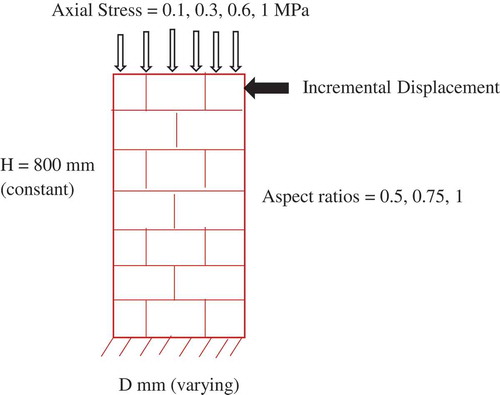
Numerical analysis was performed using FEM platform DIANA®, to obtain the monotonic load-deformation response of the masonry under a constant applied compression. A parametric study is carried out to understand the influence of the different parameters on the lateral response of load-bearing soft brick unreinforced masonry walls. The parameters evaluated are: (a) axial stress levels on walls (varying axial stress p); and (b) geometry of the walls (different Height/Length ratio). The walls with aspect ratios (Height/Length) of 0.5, 0.75 and 1 were considered. Walls had a constant height of 800 mm and different lengths in the analysis (Figure ). The thickness of all the walls was 100 mm. Four levels of axial stress corresponding to 0.1, 0.3, 0.6 and 1.0 MPa were considered. The brick and mortar strengths were 14 and 7 MPa, respectively. The brick units used in the analysis were 210 mm (length) and 50 mm (height). The mortar joint was taken equal to 10 mm. In the finite element discretisation, the brick units were modelled using continuum elements (Figure )). Each brick unit was modelled using plane stress, 8-noded continuum elements. For the joints interface (Figure )) the composite interface model is used, and for the vertical cracks in the middle of units, a mode I cracking model with exponential tensile softening and immediate drop to zero shear stress after initiation of the crack is assumed. The vertical interface between the continuum elements (Figure )) within a brick unit was represented using interface fracture elements with large normal stiffness and shear stiffness. Non-linear tension softening was assumed after the tensile strength is reached. The interface elements with the well-defined Mohr-Coulomb failure envelope with a tension cut-off and compression cap were used for the bed and head joints. The parameters of the material model used in the numerical analysis are tabulated in Table . Brick and mortar properties of the wall were obtained from experiments carried out on brick and mortar prisms by Ravula and Subramaniam (Citation2017). The shear and tension parameters of the joint interface were taken the same for the three aspect ratios to observe the influence of brick and mortar strengths. As per Lourenco and Rots (Citation1997) cracks must be modelled to avoid overestimation of collapse load and of the stiffness. For cracks, the tensile strength, was taken as 1/10th of brick strength, and high stiffnesses (
,
) were considered as suggested by Lourenco and Rots (Citation1997). For joints, the normal stiffness,
and the tangential stiffness,
, were calculated using Equation (7) and (8). The values of cohesion,
, friction angle,
and cap compressive strength were taken from Ravula and Subramaniam (Citation2017).
Table 1. Numerical Model properties (Wall—Brick 14MPa, Mortar 7MPa)
Figure 4. (a) Element CQ16M—DIANA®; (b) Interface element CL12I—DIANA®.
Figure 5. Details of wall used for numerical model.
The plane stress elements representing the masonry units located at the base of the wall were connected to interface elements and were restrained in all directions to simulate the fixed base of the masonry walls. A multi-point constraint simulating a master-slave condition for displacement in the lateral direction was applied to all the nodes on the top edge of the masonry. A compressive traction corresponding to the applied compressive load was prescribed on the top edge of the masonry. The analysis was performed in displacement control by incrementing the displacement of the master node on the top edge of the wall. A Newton-Raphson iteration procedure was adopted with an energy convergence criterion having a tolerance of 0.001 N.mm. The non-linear analysis was carried out in two stages. In the first stage, axial stress was applied to its full value, and in the second stage, the analysis was performed for incremental lateral displacement.
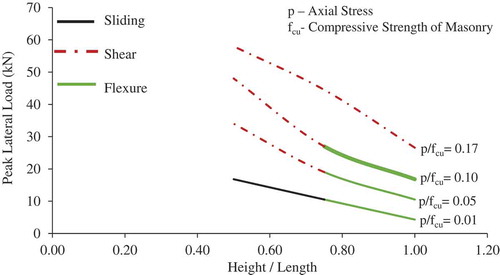
The monotonic load response curves of the wall with three aspect ratios (0.5, 0.75 and 1) are shown in Figure . The modes of failure observed in the different walls are listed in Table , and a graphical summary is presented in Figure . It is observed that the lateral load resistance of unreinforced masonry walls increases with the increase in the axial stress value for different values of aspect ratio. The effect of the increase in axial stress is pronounced in stockier walls with lower H/L ratios as compared to slender walls with H/L ratio >1. There is a distinct change in the failure mode with an increase in the level of compression. For the stocky wall with H/L equal to 0.5, sliding failure is observed when the applied compression is 5% of the masonry compressive strength and diagonal shear cracking is observed when the applied compression is increased to 10% of the compressive strength. For walls in the H/L range between 0.5 and 1, rocking is the predominant mode of failure when the applied compression is less than 5 % of the compressive strength of masonry and shear failure is observed in walls with applied compression higher than 5% of the compressive strength of masonry. Slender walls with H/L larger than 1, fail in flexural, with rocking flexure type failure for applied compression lesser than 7% of the compressive strength of masonry and for higher applied compression, the toe-crushing flexural failure mode is predicted. Slender walls show a hardening type of response compared to a softening response for stockier walls. This is because there is no decrease in sectional area resisting the lateral load. Lateral load capacity decreases with an increase in H/L (aspect ratio).
Table 2. Failure Modes (Brick Strength 14 MPa, Mortar Strength 7 MPa)
Figure 6. Monotonic load response (Load-Displacement) for the wall with Height/Length ratio (0.5, 0.75 and 1) and axial stress levels.
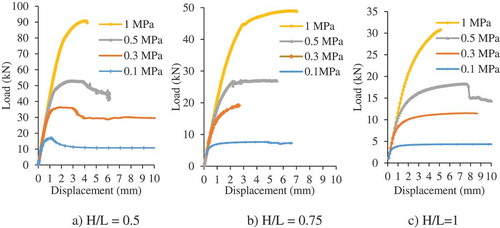
Figure 7. Failure modes of soft brick URM wall.
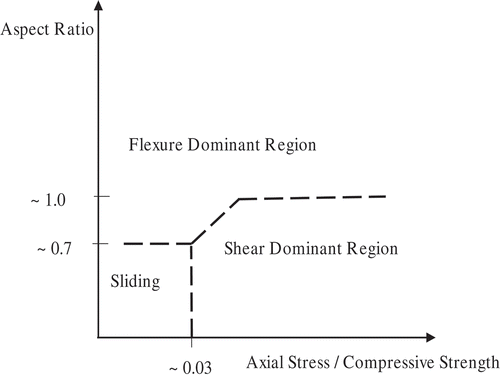
Overall, it is observed that slender walls with H/L > 1 exhibit flexural failure mode while the shear failure mode is typical for mid-range H/L (0.7 to 1.0). Sliding failure mode is typical for stocky walls with less axial stress. Figure shows the prediction of failure modes with varying applied compression and Figure shows the prediction of failure modes with varying aspect ratios.
Figure 8. Effect of axial stress on lateral load capacity of soft brick URM wall.
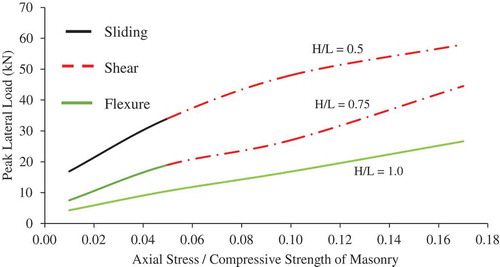
Figure 9. Effect of aspect ratio on lateral load capacity of soft brick URM wall.
4. Characteristics of different failure modes
All walls first crack in flexural tension at the base and depending upon the aspect ratio and axial stress level, the wall will ultimately fail either in shear, or in flexural compression, or in sliding, or a combination.
4.1. Shear failure
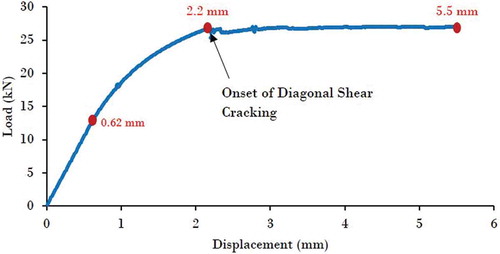
From an analysis of a wall with H/L equal to 0.75 and an applied compression equal to 0.5 MPa, a shear failure with diagonal stepped crack is produced. Diagonal cracking characterizes the shear failure mode either through the brick unit or through mortar head joints depending upon the path of least resistance. Diagonal cracking marks the ultimate or peak load carrying capacity of the wall (marked in Figure ). Figure shows the various stages observed in the diagonal shear cracking failure. After diagonal cracking, the load-deformation curve shows a softening response. Shear failure is common for walls with an aspect ratio in between 0.5 and 1.0 (Table ).
Figure 10. Load response for shear failure through head joint (Brick strength 14 MPa, Mortar strength 7 MPa, Aspect ratio 0.75, and Axial stress 0.5 MPa).
4.2. Sliding failure
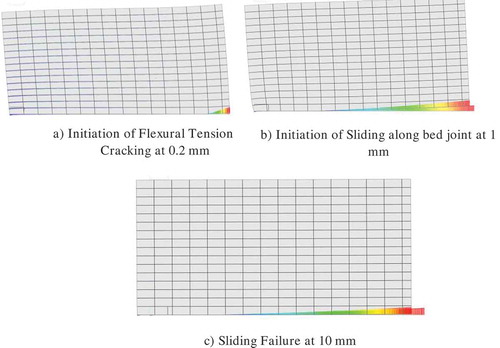
Sliding failure is characterized by the movement of the bed joint due to reduced frictional resistance. Figures and 1 demonstrate results from the analysis of a wall with H/L equal to 0.5 and an applied compression equal to 0.1 MPa. Sliding failure is common for very stocky walls with an aspect ratio less than 0.7 and very low levels of axial stress values (Table ).
Figure 11. Stages of shear diagonal stepped cracking for shear load response of Figure .
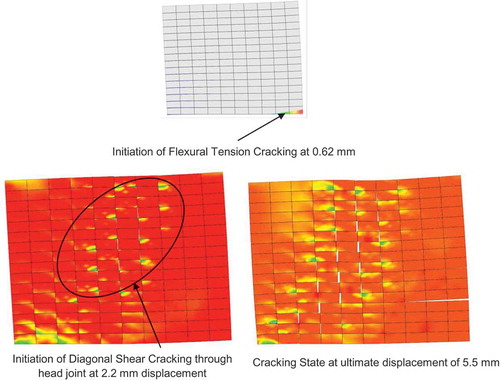
Figure 12. Load response of wall failing in sliding (Brick Strength 14 MPa, Mortar strength 7 MPa, Aspect ratio 0.5, Axial stress 0.1 MPa).
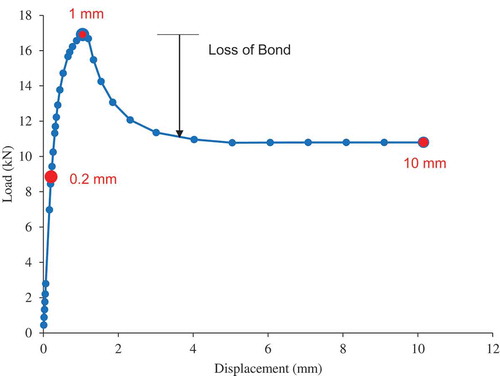
Figure 13. Stages of sliding failure mode for load response of Figure .
4.3. Flexural failure
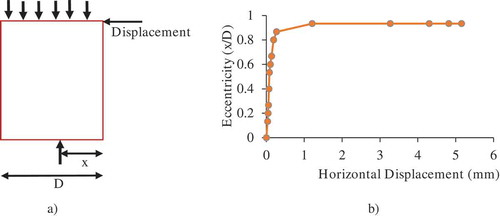
Flexural failure may be either due to tension or compression. If flexural failure is marked by compression of units in the toe region of the wall, it is called as toe crushing failure. This occurs when the load exceeds the compressive strength of the brick unit. It is typical for slender walls having an aspect ratio greater than 1.35 and high levels of axial stress values. The flexural failure caused by tensile stresses is called rocking failure which results in horizontal cracking making the wall rotate around the bottom corner. Rocking failure is common for walls with lower levels of axial stress. The load response (Figure ) has a hardening effect. The stages in rocking failure are demonstrated in Figure from an analysis of a wall with H/L equal to 1.0 and an applied compression equal to 0.3 MPa. The redistribution of vertical stresses at the base is as illustrated in Figures and 1 for the same wall. As lateral load increases, the resultant keeps shifting towards the compression toe to maintain equilibrium, as the axial stress is held constant. This shift of resultant gets arrested at a point on the base when a failure mode is reached. Sometimes, the base gets detached completely.
Figure 14. Load response of wall failing in flexure rocking (Brick strength 14 MPa, Mortar strength 7 MPa, Aspect ratio 1.0, Axial stress 0.3 MPa).
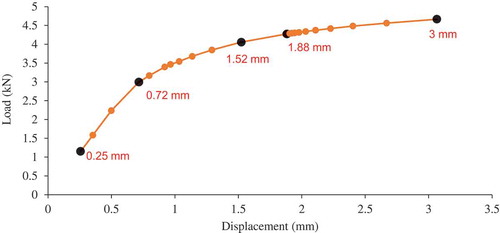
Figure 15. Compressive stress distribution for load response of Figure (Red Zone denotes Tension Region) at 0.25 mm, 0.72 mm, 1.52 mm, 1.8 mm and 3 mm, respectively.
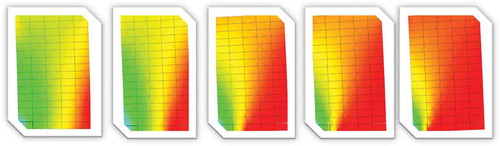
Figure 16. Distribution of compressive stresses along base of wall (for Flexural Load Response).
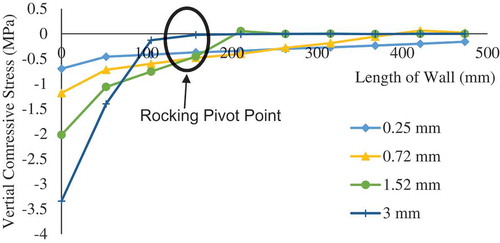
Figure 17. Shift of resultant along base of wall for flexural load response.
5. Numerical simulation of cyclic response
The flexural, shear and sliding failure modes exhibit different hysteresis behaviour under cyclic loads. The soft brick URM wall is modelled in DIANA® using simplified micro-modelling strategy, and cyclic load analyses are carried out. The model developed for monotonic loading can be used to study the effect of cyclic loading (Lourenco, Citation1996; TNO DIANA User Manual, Citation2011). The parameters used to describe the numerical model are tabulated in Table .
5.1. Wall failing in shear mode
In Figure , a wall with an aspect ratio of 0.75 and applied compression of 0.5 MPa is considered to carry out cyclic load analysis of wall representing shear failure mode. The non-linear analysis was carried out in two stages. In the first stage, axial stress was applied to its full value, and in the second stage, cyclic displacements of 6 cycles shown in Figure was applied.
Figure 18. (a) Wall details (b) Wall mesh in DIANA®.
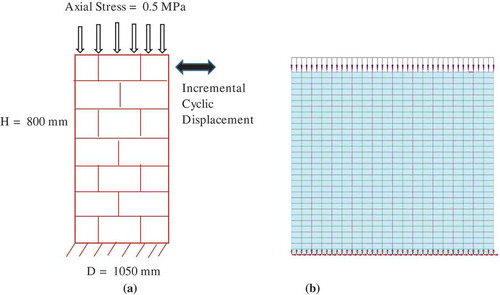
Figure 19. Cyclic load response for shear failure.
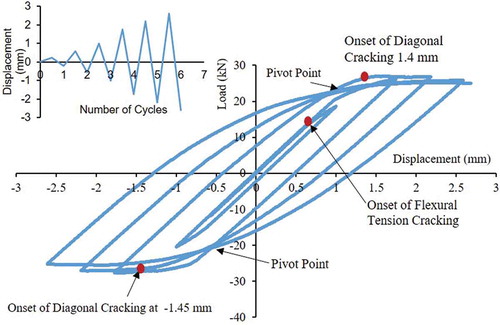
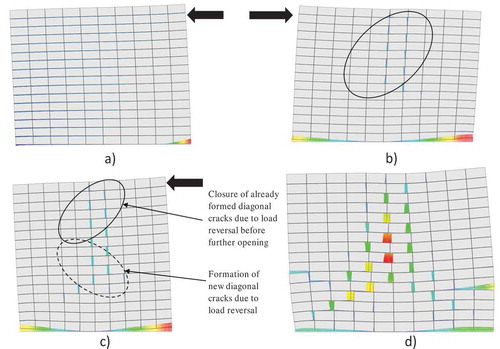
Figure shows the cyclic load response for shear failure. Table shows the measured strengths. The reverse cyclic response exhibits a symmetric response in both the loading directions. The hysteretic load response exhibits a pivot type behaviour. The predicted hysteretic behaviour agrees with the experimental hysteresis of shear failure mode given in FEMA 307–1999. As observed in Figure , there is no pinching upon load reversal. This is because previously opened cracks closed soon after the reversal of displacement because of the vertical applied compression, as is observed in Figure . On increasing loading, the closed cracks also open up in the other direction. Under cyclic loading, wall undergoes a significant amount of cracking compared to monotonic lateral loading. The progression of damage in the wall at different points of the load response is presented to relate the observed changes in the load response with the progression of damage. The wall initially cracked in flexural tension at the bottom heel region at a displacement of 0.63 mm. On reversal of load, a flexural tension crack appeared on the opposite side of the wall. With increased lateral displacement, the flexural crack grew in length and shear stress redistributed to the continuously shrinking compression toe zone. The wall continues to take load with a slight decrease in stiffness (due to a reduction in un-cracked shear area) without strength degradation, and at a displacement equal to −1.4 mm (27 kN load), a diagonal crack started to appear (Figure ). On further increase of displacement, there was slight softening in the load response due to cracking of the section. Flexural tension cracking appeared at around 30% of peak load, and diagonal cracking appeared at around 80 % of peak load displacement and 95% of peak load. This shows that the wall was capable of taking additional load after flexural tension cracking but the lateral load capacity of the wall was reached with the onset of diagonal shear cracking. The wall ultimately failed in a shear mode with diagonal stepped cracking through the head joints.
Table 3. Measured strengths
Figure 20. (a) Onset of flexure tension cracking at 0.7 mm; (b) onset of diagonal stepped cracking through joint at −1.4 mm (fourth cycle); (c) formation of new diagonal cracks due to load reversal and (d) diagonal stepped cracking through joint at 2.6 mm.
5.2. Wall failing in bed-joint sliding mode
Figure shows a soft brick URM wall with an aspect ratio of 0.5 and applied compression of 0.1 MPa modelled in DIANA® to perform cyclic load analysis of a wall representing bed-joint sliding failure mode. The non-linear analysis was carried out in two stages. In the first stage, axial stress was applied to its full value and in the second stage, cyclic displacements of 5 cycles shown in Figure , was applied.
Figure 21. (a) Wall details (b) Wall mesh in DIANA®.
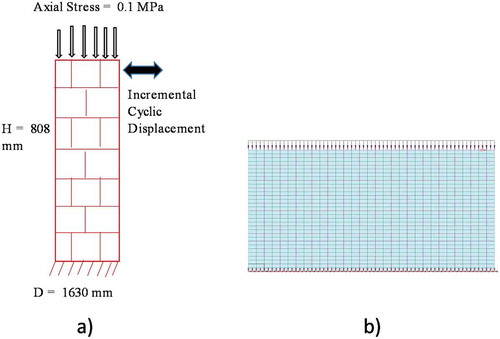
Figure 22. Output cyclic load response for bed-joint sliding failure.
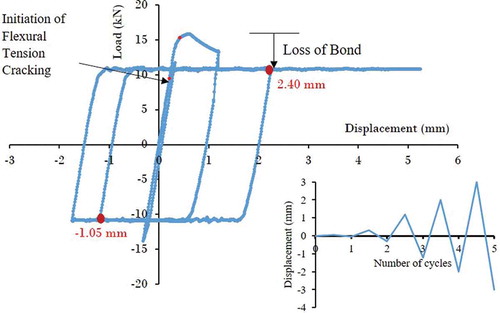
Cyclic load response is shown in Figure , and the measured strengths are shown in Table . The wall was subjected to five displacement load cycles. The response is symmetrical, and the hysteresis follows elastic-perfectly plastic type behaviour. This type of hysteretic behaviour agrees with the experimental hysteresis of bed-joint sliding failure mode given in FEMA 307. The wall initially cracked in flexural tension at the bottom heel region at a displacement of 0.2 mm of the third cycle (9.5 kN) (Figure ). On reversal of load, flexural tension crack appeared on the opposite side of the wall. It is inferred that with increased lateral displacement, the flexural crack grew in length and stress redistributed to the continuously shrinking compression toe zone. The wall continued to take a load with a slight decrease in stiffness (due to a reduction in un-cracked area) without strength degradation and at 0.45 mm displacement of the fourth cycle (15.3 kN) load, bed-joint sliding along the base triggered (Figure ). On further increase of displacement, there was softening in the load response due to a decrease in frictional resistance along the bed-joint. Flexural tension cracking appeared at around 60% of peak load, and bed-joint sliding started at around 80% of peak load displacement and 95% of peak load (Table ). This indicates that the wall was capable of taking load after flexural tension cracking, but the wall’s lateral load capacity was reached with the start of bed-joint sliding followed by softening and subsequently flattening of response was observed. The wall ultimately failed in the bed-joint sliding mode of failure.
Table 4. Measured strengths
Table 5. Measured strengths
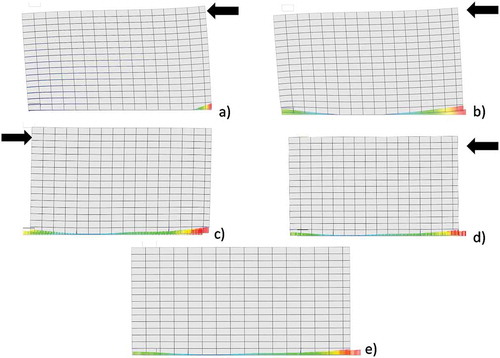
Figure 23. (a) Onset of flexure tension cracking at 0.2 mm (third cycle); (b) onset of bed-joint sliding at 0.45 mm (fourth cycle); (c) contour plot showing sliding at −1.05 mm (fourth cycle); (d) contour plot showing sliding at 2.40 mm (fifth cycle) and (e) bed-joint sliding at 5 mm (last point).
5.3. Wall failing in flexural mode
Flexure failures, as discussed earlier, are predominant in slender walls with aspect ratios (height/length) greater than 1.0. A wall with an aspect ratio of 1.5 and applied compression of 0.3 MPa is modelled in DIANA®to perform cyclic load analysis of a wall representing flexural failure mode (Figure ). The non-linear analysis was carried out in two stages. In the first stage, axial stress was applied to its full value, and in the second stage, cyclic displacements of four cycles as shown in Figure were applied.
Figure 24. (a) Wall details. (b) Wall mesh in DIANA®.
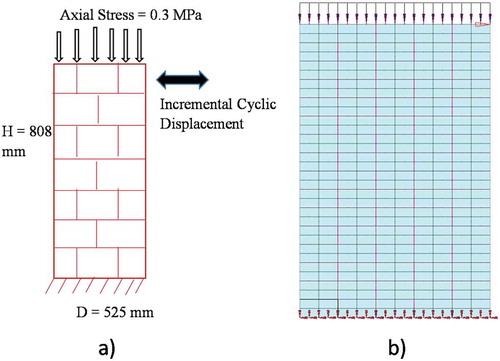
Figure 25. Output cyclic load response – flexural failure.
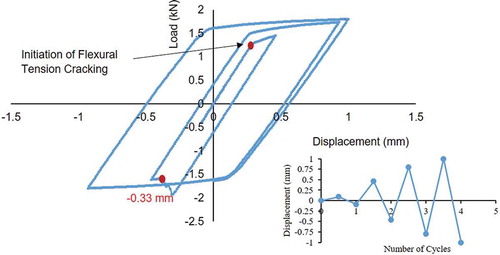
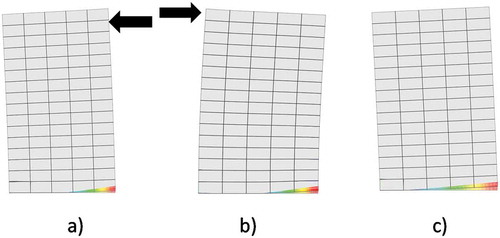
Cyclic load response output is shown in Figure and the measured strengths are shown in Table . The wall was subjected to four displacement load cycles. The response is symmetrical. The hysteresis follows elastic strain-hardening type plastic behaviour (Bauschinger type). This type of hysteretic behaviour agrees with the experimental hysteresis of flexural failure mode given in FEMA-307. Figure shows the various stages of the URM wall under cyclic load. The wall initially cracked in flexural tension at the bottom heel region at a displacement of 0.27 mm of the second cycle (1.2 kN). On reversal of load, flexural tension crack appeared on the opposite side of the wall. It is deduced that with increased lateral displacement, the flexural crack grew in length and stress redistributed to the continuously shrinking compression toe zone. The wall continued to take a load with a slight decrease in stiffness (due to a reduction in un-cracked area) without strength degradation and at 1 mm displacement of the fourth cycle (18 kN) load, the wall started to rock at a point on the base of the wall. On further increase of displacement, there was hardening in the load response since the section is un-cracked. This shows that the wall was capable of taking load after flexural tension cracking showing hardening response with a decrease in stiffness.
Figure 26. (a) Onset of flexure tension cracking at 0.27 mm (second cycle); (b) contour plot at −0.33 mm (third cycle) and (c) flexural rocking at 1 mm (fourth cycle).
6. Summary
In this paper, numerical simulation of soft brick unreinforced masonry panels subjected to lateral loads is performed. Results from the monotonic and cyclic behaviour of load-bearing unreinforced masonry walls made with soft-bricks under lateral loads are presented. Monotonic load envelope curve was generated through the pushover analysis of the finite element model. The in-plane failure modes were identified by performing a parametric study. It was observed that the failure type is mainly dependent on the level of axial compression and aspect ratio (Height/Length) of the wall. Slender walls with aspect ratio (Height/Length) greater than 1 exhibit flexural failure mode. The shear failure mode is typical for mid-range Height/Length (0.7–1.0). Sliding failure mode is typical for stocky walls with less axial stress. Cyclic load analyses are performed on the finite element model to understand the complex hysteretic behaviour of unreinforced soft-brick masonry walls. Although masonry walls made of soft-bricks exhibit similar failure modes as that of masonry walls made with stiff-bricks, the response of walls made of soft-bricks is much softer as compared to previous studies on walls made of stiff-bricks, and consequently, soft-brick walls exhibit greater displacements under lateral loads. In the absence of a complete experimental database on soft brick masonry walls, the results reported in this numerical study provide an enhanced insight on the behaviour of soft brick masonry walls under lateral loads.
Correction
This article was originally published with errors, which have now been corrected in the online version. Please see Correction (http://dx.doi.org/10.1080/23311916.2018.1563367).
Additional information
Funding
Notes on contributors
Jayaprakash Vemuri
JayaPrakash Vemuri is a Graduate Student at the Indian Institute of Technology Hyderabad. His research interests include characterisation of ground motions, generation of synthetic ground motions and nonlinear time history analyses of structures.
Syed Ehteshamuddin
Syed Ehteshamuddin is a Graduate Student at the Indian Institute of Technology Hyderabad. His research interests include structural dynamics, mechanics of masonry, seismic assessment of masonry structures and low cost construction materials.
Subramaniam Kolluru
Subramaniam Kolluru is a Professor at the Indian Institute of Technology Hyderabad. He holds a PhD from Northwestern University. His research interests include behaviour of concrete and masonry structures, structural strengthening and FRP-based repair of structures and blast analysis and mitigation.
References
- Abdulla, K. F. , Cunningham, L. S. , & Gillie, M. (2017). Simulating masonry wall behaviour using a simplified micro-model approach. Engineering Structures , 151, 349–365. doi:10.1016/j.engstruct.2017.08.021
- Abrams, D. P. (2001). Performance-based engineering concepts for unreinforced masonry building structures. Progress in Structural Engineering and Materials , 3, 48–56. doi:10.1002/(ISSN)1528-2716
- Akan, A. E. , (2008), A Comparative Study on Earthquake Resistance of Reinforced Concrete and Masonry Residential Buildings in Small-Scale Cities of Turkey , PhD Dissertation, Department of Architecture, Middle East Technical University, Turkey.
- Akhaveissy, A. H. , & Desai, C. S. (2011). Unreinforced masonry walls: Nonlinear finite element analysis with a unified constitutive model. Archives of Computational Methods in Engineering , 18, 485–502. doi:10.1007/s11831-011-9067-4
- Aldemir, A. , (2010), A Simple Seismic Performance Assessment Technique for Unreinforced Masonry Structures , MS Dissertation, Middle East Technical University, Turkey
- Arya, S. , & Hegemier, G. (1978). On non-linear response prediction of concrete masonry assemblies. In Proceedings of the North American masonry conference (pp. 19.1–19.24). Boulder, Colorado, USA: Masonry Society.
- Avossa, A. M. , & Malangone, P. (2015). Seismic performance assessment of masonry structures with a modified “concrete” model. Bulletin of Earthquake Engineering , 13(9), 2693–2718. doi:10.1007/s10518-015-9726-1
- Berto, L. , Saetta, A. , Scotta, R. , & Vitaliani, R. (2004). Shear behaviour of masonry panel: Parametric FE analyses. International Journal of Solids and Structures , 41, 4383–4405. doi:10.1016/j.ijsolstr.2004.02.046
- Bureau of Indian Standards . (1991). Handbook on masonry design and construction: SP20 . New Delhi, India: Author.
- Drysdale, R. , Hamid, A. A. , & Baker, L. R. (1994). Masonry structures: Behavior and design . Englewood Cliffs, NJ: Prentice Hall.
- Elgawady, M. A. , Lestuzzi, P. , & Badoux, M. (2006). Analytical model for in-plane shear behaviour of URM walls retrofitted with FRP. Composites Science and Technology , 66, 459–474.
- Federal Emergency Management Agency . (1999). Evaluation of earthquake damaged concrete and masonry wall buildings . Washington, DC: FEMA-307.
- Federal Emergency Management Agency . (2009). Unreinforced masonry buildings and earthquakes: Developing successful risk reduction programs . Washington, DC: FEMA P-774
- Formisano, A. (2012). Seismic damage assessment of school buildings after 2012 Emilia Romagna earthquake. Ingegneria Sismica , 29(2–3), 72–86.
- Formisano, A. (2017a). Local- and global-scale seismic analyses of historical masonry compounds in San Pio delle Camere (L’Aquila, Italy). Natural Hazards , 86(SP2), 465–487. doi:10.1007/s11069-016-2694-1
- Formisano, A. (2017b). Theoretical and numerical seismic analysis of masonry building aggregates: Case studies in San Pio Delle Camere (L’Aquila, Italy). Journal of Earthquake Engineering , 21(2), 227–245. doi:10.1080/13632469.2016.1172376
- Formisano, A. , Florio, G. , Landolfo, R. , & Mazzolani, F. M. (2011) Numerical calibration of a simplified procedure for the seismic behaviour assessment of masonry building aggregates, Proceedings of the 13th International Conference on Civil, Structural and Environmental Engineering Computing , 28 p, Stirlingshire, Scotland
- Formisano, A. , Florio, G. , Landolfo, R. , & Mazzolani, F. M. (2015). Numerical calibration of an easy method for seismic behaviour assessment on large scale of masonry building aggregates. Advances in Engineering Software , 80, 116–138. doi:10.1016/j.advengsoft.2014.09.013
- Formisano, A. , & Marzo, A. (2017). Simplified and refined methods for seismic vulnerability assessment and retrofitting of an Italian cultural heritage masonry building. Computers and Structures , 180, 13–26. doi:10.1016/j.compstruc.2016.07.005
- Giordano, A. , Mele, E. , & De Luca, A. (2002). Modelling of historical masonry structures: Comparison of different approaches through a case study. Engineering Structures , 24, 1057–1069. doi:10.1016/S0141-0296(02)00033-0
- Haach, V. G. , Vasconcelos, G. , & Lourenco, P. B. (2011). Parametrical study of masonry walls subjected to in-plane loading through numerical modelling. Engineering Structures , 33, 1377–1389. doi:10.1016/j.engstruct.2011.01.015
- Hendry, A. W. (1991). Reinforced and prestressed masonry . New York, NY: Longman Scientific & Technical.
- La Mendola, L. , Accardi, M. , Cucchiara, C. , & Licata, V. (2014). Nonlinear FE analysis of out-of-plane behaviour of masonry walls with and without CFRP reinforcement. Construction and Building Materials , 54, 190–196. doi:10.1016/j.conbuildmat.2013.12.068
- Lemos, J. V. (1995). Assessment of the ultimate load of a masonry arch using discrete elements. In J. Middleton & G. N. Pande (Eds.), Computer methods in structural masonry 3 (pp. 294–302). Swansea, U.K.: Books and Journals International.
- Lotfi, H. R. , & Shing, P. B. (1991). An appraisal of smeared crack models for masonry shear wall analysis. Computers and Structures , 120(1), 63–80.
- Lotfi, H. R. , & Shing, P. B. (1994). Interface model applied to fracture of masonry structures. Journal of Structural Engineering , 120(1), 63–80. doi:10.1061/(ASCE)0733-9445(1994)120:1(63)
- Lourenco, P. B. , Rots, J. G. , & Feenstra, P. H. (1995). A tensile ‘Rankine’ type orthotropic model for masonry. In J. Middleton & G. N. Pande (Eds.), Computer methods in structural masonry 3 (pp. 167–176). Swansea, U.K.: Books and Journals International.
- Lourenco, P. B. , & Rots, J. G. (1997). Multi-surface interface model for analysis of masonry structures. Journal of Engineering Mechanics , 123(7), 660–668. doi:10.1061/(ASCE)0733-9399(1997)123:7(660)
- Lourenco, P. J. B. B. , (1996), Computational Strategies for Masonry Structures , PhD Dissertation, Delft University of Technology, Holland
- Milani, G. (2008). 3D upper bound limit analysis of multi-leaf masonry walls. International Journal of Mechanical Sciences , 50(4), 817–836. doi:10.1016/j.ijmecsci.2007.11.003
- Milani, G. , & Venturini, G. (2011). Automatic fragility curve evaluation of masonry churches accounting for partial collapses by means of 3D FE homogenized limit analysis. Computers & Structures , 89(17–18), 1628–1648. doi:10.1016/j.compstruc.2011.04.014
- Oliveira, D. , & Lourenco, P. (2004). Implementation and validation of a constitutive model for the cyclic behaviour of interface elements. Computers and Structures , 82(17), 1451–1461. doi:10.1016/j.compstruc.2004.03.041
- Orduna, A. , (2003). Seismic Assessment of ancient masonry structures by rigid blocks limit analysis, PhD Dissertation , University of Minho, Portugal
- Page, A. (1978). Finite element model for masonry. Journal of the Structural Division, ASCE , 104(8), 1267–1285.
- Pegon, P. , & Anthoine, A. (1994) Numerical strategies for solving continuum damage problems involving softening: Application to the homogenization in masonry. Advances in Non-Linear Finite Element Methods , CIVIL-COMP Press: U.K., 143–157
- Quagliarini, E. , Maracchini, G. , & Clementi, F. (2017). Uses and limits of the equivalent frame model on existing unreinforced masonry buildings for assessing their seismic risk: A review. Journal of Building Engineering , 10, 166–182. doi:10.1016/j.jobe.2017.03.004
- Ravula, M. B. , & Subramaniam, K. (2017). Experimental investigation of compressive failure in masonry brick assemblages made with soft brick. Materials and Structures , 50, 19. doi:10.1617/s11527-016-0926-1
- Shing, P. , & Cao, L. (1997) Analysis of partially grouted masonry shear walls. US Department of Commerce, Gaithenburg, MD20899, NIST GCR, 97–710
- Shing, P. , Schuller, M. , & Hoskere, V. (1990). In-plane resistance of reinforced masonry shear walls. Journal of Structural Engineering , 116(3), 619–640. doi:10.1061/(ASCE)0733-9445(1990)116:3(619)
- Stavridis, A. , & Shing, P. B. (2010). Finite-element modeling of nonlinear behavior of masonry-infilled RC frames. Journal of Structural Engineering , 136(3), 285–296. doi:10.1061/(ASCE)ST.1943-541X.116
- TNO DIANA BV . (2011). Diana user manual. Release 9.4.4 ,TNO DIANA BV, Delft, Netherlands.
- Tomaževič, M. (2006) Earthquake-resistant design of masonry buildings . Series on Innovation in Structures and Construction — Vol. 1, Imperial College Press, London
- Vemuri, J. , Ehteshamuddin, S. , & Kolluru, S. V. 2018. Evaluation of seismic displacement demand for unreinforced masonry shear walls. Cogent Engineering , 5, 1–22. 1480189
- WHE-PAGER - World Housing Encyclopaedia - Prompt Assessment of Global Earthquakes for Response Survey (2007), California, USA, http://www.world-housing.net/related-projects/whe-pager-project/about-this-project