
 ?Mathematical formulae have been encoded as MathML and are displayed in this HTML version using MathJax in order to improve their display. Uncheck the box to turn MathJax off. This feature requires Javascript. Click on a formula to zoom.
Abstract
This work developed the optimal inventory cost framework for managing the reorder-point and order quantity policies of a petroleum products service station experiencing frequent inventory outages. The specific objectives of the study include formulating an optimal cost model for evaluating inventory performance of premium motor spirit, determining the amount of petrol emission due to evaporation and computing the optimal parameters. To realize those objectives, primary data for the study were obtained through a mix of field measurements and analytical methods. For 365 days, the stock on-hand was continuously monitored after each daily transaction by physical measurement, using a calibrated dipping stick. Also, the evaporated PMS was estimated and the equivalent cost incorporated to the holding cost function through the least square method. Based on the differentiation of the sum of holding, ordering and crashing costs functions, with respect to lead time and order quantity decision variables, the inventory cost framework was formulated. The results show that the framework yielded optimal supply at lower inventory cost and a 10% increase of service level above the current level of 80%. So, in managing the fuel stock, the monthly decision rule is to ensure that not less than 195,119.84 litres order is replenished as stock in inventory drops to 29,743.54 litres reorder level. Inclusion of least square cost method to account for the evaporated quantity is a novelty to this proposed cost structure. The developed model guarantees reliable information and can be a benchmark for management of other petroleum products.
PUBLIC INTEREST STATEMENT
Inventory constitutes a sizeable investment for either a good or service oriented firm, including gasoline service stations. Often times, firms see inventory keeping as a form of control to the flow of input and output and in that sense it serves dual purpose of regulatory and transformational functions to business organizations. There is growing concern in managing fuel cycle inventory in Nigeria because inventory cost amounts to a substantial portion of the business variable cost. Therefore, this work balances the cost of petrol station’s stock replenishment in relation to order quantity. This was achieved by undertaken actions like developing an inventory cost model and performance metrics. Total inventory cost includes ordering, holding cost and crashing costs, while metrics include lead time, cycle length, delivery delay, lead time and re-order point. This study found that cycle length slowly increases with re-order point. Understanding the effects of changes in those metrics on inventory cost and profit margins is useful in managing inventory decision making process.
1. Introduction
Managing fuel cycle inventory in Nigeria is a worrisome decision problem for the retail service stations. In this study, cycle inventory is an inventory that results from cyclic ordering of stocks in batches. An inventory is a stock of any item or resource used in an organization. It represents a sizeable investment as well as a potential source of waste by firms, if not well managed. Thus, keeping a product in inventory is both regulatory and transformational to business functions, based on its use as a form of control strategy and to balance the flow of input and output, of a firm. Previous studies have established a strong relationship of a firm’s increased productivity with keeping of inventory (Isi, Citation2016; Nwanya, Citation2015). In view of the foregoing reasons, inventory is a serious function and requires strict attention by a firm’s management. Every organization including the petroleum industry, maintains some type of inventory systems. In Nigeria, the petroleum industry is critical to the economy to warrant efficient inventory policy and it consists of two streams, the upstream and downstream sectors. The upstream sector deals with acquisition and delivery of crude oil from wells to refineries, while the latter deals with manufacturing of petroleum products and distributing them to end-user customers (Jha, Citation2016) through approved channels. According to Eke and Enibe (Citation2007), the distribution channels involve refineries, depots, tank farms and service stations. It is important to briefly describe how these channels are involved in inventory functions for the energy commodity (energy carrier).
The refinery provides the avenue for the conversion of oil into various energy products such as premium motor spirit (PMS) and diesel. A depot serves as an intermediary storage unit between the refinery and vendor, in particular, if distribution of products is by pipeline network. A tank farm is an area used for temporary storage of oil products transported through waterways en-route to a depot or other permanent storage facilities, while the service station as a storage unit dispenses products directly to end-customers. They all together guarrantee efficient delivery of fuel in-trade to end-customers. In view of this purpose, service stations act as decoupling inventory and final tier component of the downstream sector for direct retail of petroleum products to consumers. In the downstream sector, while fuel production policy is categorized under produce to stock plan, its distribution is controlled by two policies namely: reorder point and order quantity. Inappropriate reorder point most likely results in surplus or shortage of order quantity. Since the latter is the case for the studied station, this study focuses on the enhancement of premium motor spirit re-order policy at a service station level for an optimal on-time delivery to customers.
1.1. Statement of the problem
For a while now, the current reorder point system of the case study station leaves much to be desired and the consequence is frequent fuel stock outages. The problem is not peculiar to this station as petroleum products distributions in Nigeria face considerable challenge about what replenishment order quantity and reorder-point ought to be resulting in out of stock syndrome. It has been difficult with the system operators to resolve the problem in a manner that balances batch supply with demand. Ehinomen and Adeleke (Citation2012) reported some of the challenges faced by the service stations relating to cycle inventory. How are service stations dealing with these problems today? The answer to this question lies with the vendors’ and government’s outlook on the issue. The PMS stations (vendors) have tried managing these problems at high lead time crashing cost without success. From government point of view, a number of intervention schemes have been applied in the past to address the challenges. For example, government first introduced the scheme of independent marketers in order to grow involvement of indigenous entrepreneurs to complement major oil marketers in fuel distribution. In 29 September 2003, the deregulation of downstream sector was implemented to transfer product distribution and transportation functions to private entrepreneurs. Petroleum products pricing regulatory authority (PPPRA) Act 2010 was also introduced to moderate product pump price margins in response to competition. A mega station retail outlet scheme was introduced to increase competition among the marketers and ensure wider distribution of products. The argument for this measure is that it provides a larger inventory of fuels to avert unexpected sudden disruption in supply. The recent initiative is a modular refinery policy to increase local refining capacity and complement pipelines, depots, trailers and marine tankers for quick product distribution. Each of these steps has its drawbacks, but a common purpose, which is to reduce vulnerability of end-customers to disruption in supply. All these notwithstanding, the problems have persisted, demonstrating the insufficiency of the above steps so far taken. On the other hand, a school of thought has argued that the unintended consequences, despite the above mentioned intervention programmes by the vendors and government, are attributable to poor inventory management system at the end consumer level. The authors of this current article are in agreement with that school of thought and have been motivated to propose a sustainable economic solution amenable to energy supply chain fundamentals. In this paper, we focus on formulation of an optimal inventory cost framework for the PMS along with the relevant decision variables used in evaluation of the framework.
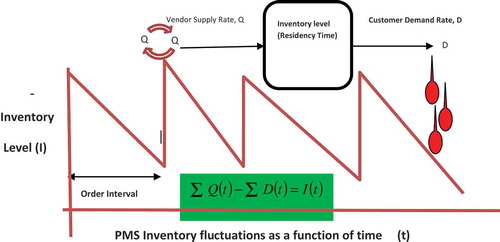
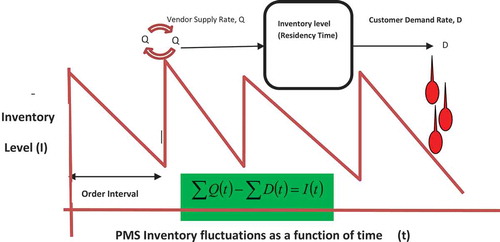
An abstraction to the fuel cycle inventory problem can be expressed in Figure . The complexity of the problem can be attributed to lack of information on predictable fuel lead time, demand and supply stock requirements. Having conceptualized the problem in Figure , it is important, before going ahead with a proposal for the solution, to have acquaintance with the content of peer-reviewed literature on inventory of energy commodity.
Figure 1. PMS Inventory fluctuations as a function of time.
The survey of literature on inventory demonstrates that various authors have recognized the benefits of keeping inventory for different production activities. The work of Ye, Zyren, and Shore (Citation2001) explained that inventories provide a measure of value for indicating whether production is either excess or shortage of demand: in particular, for a system that delivers products in batches. Rojas (Citation2017) maintains that planning for an efficient supply inventory policy reduces vulnerability of supply chain management, particularly in a continuous review (Q, r) type model, to changes in market forces. As Chiu et al. (Citation2016) point out, considerable savings in expected system costs and reduced replenishment cycle time are achievable using multi-product fabrication scheme with delayed differentiation strategy. Franciosi, Carrabs, Cerulli, and Miranda (Citation2017) propose the evolutionary approach to manage the orders of a large amount of items with the aim of using in a better way the whole warehouse space, allowing larger order quantities while satisfying the market demand. Most of the previous studies on inventory costs in the literature were focused on integrated vendor-buyer and order-size dependent trade credit with a permissible delay period for payment (Chang, Ho, Ouyang, & Su, Citation2009). Some others belong to the family of make-to-stock, make-to-order, assembly—to-order, and engineering -to-order (Rodrigues & Oliveira, Citation2010); multi echelon technique for recoverable item control (METRIC) to an integrated location- routing -inventory problem (Gholamian & Heydari, Citation2017); continuous review (Chuang, Ho, Ouyang, & Wu, Citation2013) and stochastic modelling (Uddin, Nipa, & Rume, Citation2015). Schweitzer and Seidmann (Citation1991) also, treated the effect of flexibility of manufacturing and replenishment rates on inventory.
In the literature, petroleum products inventories have received scant attention, although they provide energy to power production machines. Again, only a limited number of these articles have treated significant inventory management challenges relating to distribution of petroleum products from refineries or depots to retail stations. Among these articles, Ronen (Citation1995) has examined the practice of dispatching products in the oil industry and concludes that it faces tactical inventory routing problems. In tactical inventory problems, inventory considerations are affected by determination of shipping slate including the timing, sizing, and product composition of shipment as well as the receiving end operational facilities. He therefore proposed three models namely, set partitioning model, elastic set partitioning model and set packing model to solve the problem. Considine and Heo (Citation2000) studied the linkages between prices, inventories, and production in the petroleum refining industry. They estimated the model using Generalized Method of Moments and performed dynamic, simultaneous simulations and found that two opposing forces affect product inventory levels, namely production levels and user costs. Tarim and Ulucan (Citation2000) developed an integrated freight planning model with relevant inventory holding cost. Triki, Al-Hinai, Kaabachi, and Krichen (Citation2016) studied a periodic petroleum station replenishment problem and their work contributed to the minimization of total travelled distance by trucks. Popovic´, Vidovic´, and Radivojevic´ (Citation2012) developed a variable neighbourhood search heuristic for solving inventory routing problem in fuel delivery. Benantar, Ouafi, and Boukachour (Citation2016) proposed a multi-compactment vehicle routing problem algorithm with time windows to solve the same problem experienced during distribution of fuel. The contributions of this work in particular, maximizing quantities to be delivered (loading) and reducing vehicle travel routes prove an advance over existing studies. Further research articles dealing with same petrol station replenishment problem with time windows can be found in Cornillier, Laporte, Boctor, and Renaud (Citation2009) and Triki (Citation2013). In summary, findings from the reviewed literature indicate that inventory problem is not novel to petroleum products distribution. Also, the choice of a product inventory model depends on the on-hand inventory level or deterioration rate. However, to the best of the authors’ knowledge, no studies have been done on pattern of inventory costs structure for service stations or downstream sector that recognizes the periodicity nature of the replenishment service.
Therefore, this gap is filled up by developing an optimal inventory cost structure, a reorder-point-order quantity decision framework augmented by including least squares algorithm to capture product emission, for effective inventory management of petroleum products. The overall aim is to minimize total inventory costs. In view of this, the specific objectives of study include to: formulate an inventory cost framework for managing the products, determine the amount of product lost to evaporation, estimate the optimal ordering lead time and order quantity parameters.
Cost structure is important in developing a PMS inventory management system. It serves as a metric for daily inventory decision making which could help reduce hoarding and scarcity that exist because the optimal decision variables to be used by dealers as guidance are non-existent. The interest in PMS is because, unlike other petroleum products for industrial production, it has limited substitutes. For that reason according to Jaffe and Soligo (Citation2002), the consequences of its shortage, elevates the accumulation of inventories to a public domain beyond the energy industry.
2. Methodology
This study considered a case study strategy in providing a feasible solution to the identified inventory problem of a PMS retail station at Nsukka. To realize the objectives, both field measurement and analytical approaches were conducted on the case study PMS station. The physical measurement was carried out each operational day for one year. The measurement first starts with gauging of the underground tank for data such as the height of the product on hand, an important information on which reorder point and order quantity data can be based. By the gauging operation, using a calibrated dipping stick (CDS), the stock on-hand is monitored each day of a transaction or when a new order arrives. The CDS is graduated into litre divisions. The latter approach was applied to the supply and demand data of the chosen retail station. For this study, the rate at which PMS is replenished in the station is supply, while the rate of its depletion is demand inclusive of losses (see Figure ).
When the CDS is vertically inserted into the underground tank, the tank innage is read from the graduations on CDS. The innage refers to height of CDS covered by fuel which measures the volumecontent of the tank or the depth from fuel surface to tank bottom. When the CDS is removed from tank, then you can record the depth or innage. The approximate fuel content in litres within the recorded depth can be translated into volumecapacity using a two coordinate graph known as yardstick. The graph has a diagonal line starting from the origin of its coordinates, namely, content in litres (Y-axis) vs depth in wet meters (X-axis). Thus, the volume(fuel in inventory) is obtained, in terms of the intercept point of a vertical line that corresponds to the measured innage depth on X-axis with horizontal line drawn from Y-axis, at that diagonal line. Hence, to obtain closing stock, CDS was dipped into the underground tank and the volumeof the product left after sales for each day was read. Sometimes, an automated fuel dispenser is used for monitoring daily meter reading. The sales for the day were obtained by reading the indicator on the fuel (petrol) pump per day. The evaporated quantity was obtained by adding sales and closing stock, then subtracting it from the opening stock what is remaining is the evaporated quantity. The approach to determine the cost of evaporated quantity in the face of nonlinear relations with demand is to develop a least squares cost component and add it to the holding cost.
A quantitative analytical approach was applied in the processing of daily opening stock, sales, closing stock, supplies and evaporated quantity records as well as the formulation of cost structure into inventory information. Also, mathematical and statistical models were applied so as to produce a structure on which sound decisions can be based. Therefore, whenever there is a supply, opening stock for the next day becomes closing stock plus supply else opening stock for the next day becomes closing stock of the previous day. In summary, the cost structure is developed based on factor theory where the relationship between independent and dependent variables can be explained and analyzed using mathematical technique. For the interpretation of results, descriptive and inferential kinds of analysis were used.
2.1. The mathematical model formulation
We now consider the case of fuel inventory system with uncertain customer demand. With uncertainty of demand, it means also that lead time, re-order point and order quantity are tentative in nature. In view of this, some important parameters and decision variables that have influence on inventory performance of the system were articulated, and represented with notations such as:
L = lead time, Q = order quantity, Co = fixed ordering cost per order per cycle
Li = length of lead time component i
r = reorder point
r* = optimal reorder point
B = truck capacity
B(x) = daily delivery
D = mean demand, δ = standard deviation, k = safety factor, h = holding cost in N per unit per time; and
t = cycle length.
T = duration of period (week or month in days)
bj = maximum duration
aj = minimum duration
x = supply
jth = component
Lav = average monthly lead time (days)
δ√L = lead time standard deviation
G* = starting inventory
HC = total holding cost
D/T = demand density (litre/day)
S = safety stock
R (L) = lead time crashing costs
cj = unit crashing cost
ci = least crashing cost within an interval
tj, = crashing time between a cycle and the next
TC (Q, L) = total expected annual cost per cycle given the decision variables
TC* = optimal cost corresponding to optimal quantity & lead time
Q* = optimal order quantity
t* = optimal cycle time
v = evaporated quantity
Ii = net inventory,
Ii-1 = previous inventory
x = supply
w = delivery delay
SC = station capacity
LR = number of loading times
2.2. Model assumptions
For convenience in the formulation of the cost structure, we utilize the following assumptions: the demand for the energy carrier or fuel is inelastic; the inventory is on continuous review to keep track of quantity on-hand at each operation day; the evaporated quantity is sensitive to market demand (sales) and can be deduced by linking it to sales or demand; variable lead time and daily demands are independent; the procurement cost is the cost of purchasing the item; the holding cost is per unit per period cost, not a carrying charge; the ordering cost for any item is constant; the demand, x during lead time, L follows a normal distribution with standard deviation, δ√L.
The inventory process begins with determination of cycle length, which is the time between consecutive replenishments of inventory (interval). It is expressed as in Equation (1)
The inventory during this cycle is equal to mean inventory as expressed in Equation (2).
There is fixed ordering cost per order per cycle (Co or 1/t). Then holding cost (HC) can be expressed as below:
Therefore, safety stock (S) under lead time demand can be expressed as in Equation (3a):
In view of the inelastic demand for the product, lead time crashing costs, R (L) per cycle are incurred in order to consistently and expediently meet the cycle delivery requirements. Liao and Shyu (Citation1991) suggested that lead time can be decomposed into n mutually independent components, each of which has a different crashing cost for reduced lead time, and the crashing cost function is described by a piecewise linear function. The jth component has maximum duration bj and minimum duration aj and a crashing cost per unit time cj. The components of lead time are crashed one at a time starting with the one of least ci and so on.
Therefore, the lead time crashing cost, R (L) per cycle can be expressed in Equation (4) as:
Where bj- aj = tj, known as crashing time between a cycle and the next (and it corresponds to difference between the normal duration, bj and the minimum duration time, aj); and the associated unit crashing cost, cj as lead time components. Under this consideration, the crashing cost is computed as in Equation (4a):
This is obtained by multiplying bi-aj by its corresponding crashing cost, cj. Here, crashing cost refers to the activity cost incurred under the crashing activity time. We can consider lead time L in terms of each time interval or period (week, month or year). Let Li be the length of lead time component i crashed to its minimum duration, within a designated interval, with i = 1; 2; …; n. By subtracting annual mean lead time from each lead time, Equation (4b) is obtained.
The corresponding crashing cost is expressed in Equation (4c).
In this situation, the order quantity and lead time are the decision variables. Hence, the total expected annual cost per cycle, TC for the purchaser given the decision variables can be expressed by Equation (5):
By substituting the terms in Equations (1–3) and (4) into Equation (5), we obtain Equation (6).
Considering the evaporated quantity (v) as a part of the held inventory, thus the total cost becomes
An expression for the expected optimal quantity follows from taking derivative of TC with respect to Q and L, after equating the differential to zero as in Equations (7a) and (7b).
Alternatively,
Solving for optimal policy, the optimal quantity and cycle time are expressed in Equations (8) and (8a) as:
In this approach, to minimize TC means to substitute the value of Q* in TC. Substituting Q* in the TC, we can obtain the optimal cost.
Based on the first assumption, given a daily demand (D) of fuel the evaporated quantity (v) can be estimation. To augment other studies in the area of this topic, the least squares method was used to show a correlation of D and v. The equation of the least square line, which accounts for the v, can be summarized in (9). Then, it is integrated to TC as in Equation (10).
Suppose we let . Then
, therefore TC becomes as in Equation (10)
Collecting like terms together, we have that TC is expressed in Equation (10a)
We have to re- substitute the value of Q* in TC. Then, applying indices rule, TC can be expressed in Equation (11) as:
Therefore, the optimal cost corresponding to optimal quantity can be expressed as:
By assuming daily demands to be independent, then standard deviation of demand over lead time can be computed from the daily standard deviation. This equates to variance in Equation (12) and square root of variance in Equation (13).
The optimal reorder point, r* (litres) for monthly inventory duration can be expressed as in Equation (14)
The advantage gained by employing Equation (14) for a continuous review inventory policy is that it makes modeling demand during lead time easily possible.
Suppose there is a monthly supply B per truck, we need to know the unit crashing cost (b) and net inventory (Ii). So, the unit crashing cost (b) can be expressed in Equation (15a):
The problem can be solved numerically since the ending inventory for the months are known and they are nonnegative. With known monthly supplies and demand, the net inventory was calculated as expressed in the Equation (15b):
Where Ii = net inventory, Ii-1 = previous inventory,
Delivery delay
Another important inventory performance index is the delivery delay (w) and it is expressed as in Equation (16):
We consider the size of underground storage tank a key constraint while implementing any inventory policy for a service station. For the station manager to meet the reorder point and order quantity requirements as well as satisfy the storage capacity constraints, a fuel loading schedule is important. The number of fuel loading times is calculated as expressed in Equation (17). This formulation provides a platform to enhance the methodology of reorder rule for the station which currently experiences frequent outage due to inappropriate reorder point level.
3. Results and discussion
The study seeks to develop the optimal inventory cost framework to set guidelines for managing a premium motor spirit inventory system. The data to achieve the target have been generated through field measurements. From the preliminary analysis of data, demand for the premium motor spirit is randomized, thus confirming the need for an apt management of the inventory system. Also, from the test for coefficient of variation, it is found out that the random nature of PMS demand is also dynamic with time. In view of the above, one of the major stock out costs to a service station due to petroleum products outage is loss of goodwill. Thus, customers become dissatisfied with frequent inventory outages, but quantifying the lost goodwill is beyond the scope of our study. Also, we cannot be certain about actual fuel quantity in inventory. We resolve this difficulty by accounting for evaporated product in Section 3.1.
3.1. Estimation of evaporated quantity and formulation of an inventory cost policy for volatile products
Applying the principle that material in-flow is equal to material out-flow; it is feasible to develop the system inventory policy to account for evaporated product. Table shows the monthly evaporated quantities against monthly demand, standard deviation and ordering costs.
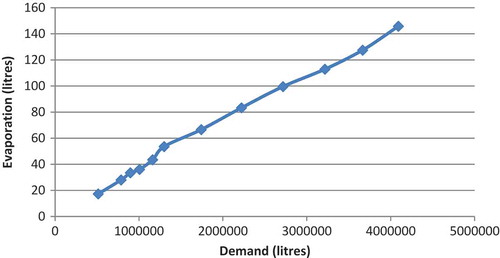
The rates of demand or sales and evaporation of PMS are both asymmetric. A proportionate relationship was expected between demand and evaporation of PMS, but level of emission was inconsistent with quantity demanded from month to month. This implies that emission rate is not normally distributed with demand (see Table ).
Table 1. Monthly gasoline emission (v), demand (D), standard deviation and ordering cost
However, a Pareto method of summation, cumulative total of the monthly emissions and demands were plotted as shown in Figure .
Figure 2. Cumulative totals of the monthly emission (evaporation) and demand.
3.1.1. Annual inventory costs
Inventory in excess of current demand frequently means that its holder must provide a place for storage when not in use. Thus, it implies that relevant costs are incurred for that purpose as have been illustrated in Section 2. For this study, the annual total cost for ordering and maintaining inventory is the sum of crashing cost, ordering cost and holding cost. Holding costs are the costs that result from maintaining the inventory for a length of time, say a day. They include storage facilities, interest on capital, insurance, taxes, depreciation, obsolescence, deterioration, spoilage, pilferage, breakage etc. Using the inventory model developed in Section 2, we can estimate the associated parameters such as demand during lead time, mean lead time (Lav), lead time standard deviation (Std. Dev), delivery delay (w), lead time-dependent cost, R (L) or crashing cost and re-order point (r) as shown in Table . In this study, the total lead time of 364 days was divided by the number of lead times which was 118; therefore the annual mean lead time was 3.085, while safety stock is 2000litres.
Table 2. Gasoline demand during lead time, delivery delay
In Table , column 2, the demand densities per unit time (DPUT) can be assessed either continuously or on a period-by-period basis. In the latter case, the cost may be a function of the maximum quantity during a period, the average amount demanded, or the quantity at the end of the period. For this study, we decide to consider the DPUT distribution as a function of the sum of monthly demand over days in a month. For this reason, in column 6 of the same table, the reorder point was calculated as in Equation (13).
3.2. Development of the optimal inventory policy
In order to evaluate performance of the cost function, the optimal parameters of the cost function should be known in terms of what constitutes decision variables, constraints and capacity.
The delivery (x) and lead time are decision variables, while constraints are ending inventory and capacity of the station. Capacity for the case study is defined by the total size (volume) of the underground tank. With the monthly demands known, holding cost per unit per month (h) charged on ending inventory is determined as the quotient of total holding cost over total quantity delivered. However, the procurement cost for each unit of product is N 94.00, while selling cost is N 97.00 as at 2012.
In Table , negative inventory indicates shortage of stock. In this study, the station experienced a shortage of fuel in some months at the level of 8.9%, 10% and 5.5%, respectively less than the expected demand. The average stock out length for the affected months is 12 days and for three months the sum is 36 days. The next section discusses how these parameters are used to develop optimal inventory policy.
Table 3. Monthly supplies, demand and ending inventory
3.3. Discussion
As Figure indicates, the graph approximates a linear relationship between evaporated product and customer demand by representing them using Pareto method of cumulative sums. It means both criteria conflict each other, since more demand for the product leads to more product emission. This phenomenon can be accounted for by some causing factors outside the scope of this study, which requires further investigation to ascertain it. A salient conclusion from the above mentioned trend is that PMS retail or distribution process has intrinsic environmental implications. Thus, high level management of the process is a necessity.
Following the description of the problem in Section 1, it was observed that the demand for PMS is inelastic. In view of the inelastic characteristic, like in most energy commodities, the order quantity at any time should be optimal since the cost of an outage on a firm could be significant, including idle personnel cost. The optimal order quantity, total cost, cycle length and reorder point were obtained in accordance with Equations (8), (11), and (14) and the results also were summarized in Table . Using the cost framework along with these performance parameters, the optimal inventory policy for managing the PMS was developed.
Table 4. Monthly optimal quantity, total cost, cycle length and reorder point
The level of performance of the developed policy in terms of total cost and reorder point in Table is sufficiently high compared with the level in Table at non optimal level. With the results, it means that the developed cost structure, if employed, can enhance the inventory policy of the studied station, in terms of reduction of stock out probability and rise in service level. In Table , percentage of stock out days in the year is about 10%. This implies 90% service level by the station. This service value is comparable to a result obtained by Ma and Qiu (Citation2012), which was classified as a lower bound of the service level. They observed that a larger value of service level yields a shorter lead time and a higher lead-time dependent cost. This phenomenon indicates that short lead time is favorable to the service level. Similarly, without a starting inventory as evident in column 4 of Table , the service level would be 80%. Since it corresponds to 20% outage level, the probability of stock out is significant enough at this condition to attract a high stock crashing cost. But, this situation can be averted with the developed structure, which has raised service level by 10 In practice, relying on the Department of Petroleum Resources’ (DPR) specification on capacity for operating a petrol station in Nigeria, the referent station has enough capacity to hold the computed re-order level by 39,094 litres per month.
Apart from adequate capacity, the policy can be monitored through delivery delay index. It is a key inventory performance measure and its value for the station is 0.93. This value (obtained) implies a high delay period in the delivery of products. This is contrary to customers’ discernment of convenience, who according to Kaminsky and Kaya (Citation2008), prefer to either immediately find what they are looking for in the firm’s finished goods inventory or to order items and receive them quickly. Reducing the lead time to an acceptable amount of time has implications on service level and inventory cost savings. Therefore, the high delay index requires that a large volumeof stock be maintained in order to ensure reasonable service level.
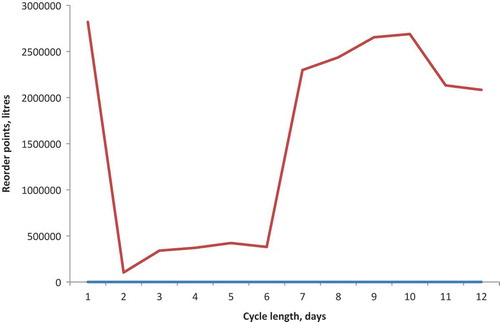
Regarding the effect of varying cycle length on reorder point, it was observed in this study that cycle length increases with re-order point, though at a slow rate as shown in Figure . In Figure , however, an insignificant change in cycle length leads to asymptotic behavior of the reorder point. Similarly in this Figure , the discontinuities occurred at the points where new orders were added the stock.
Figure 3. Relationship between cycle length and re-order point.
In Table , the effect of re-order quantity on inventory cost is similar to that observed by Uddin et al. (Citation2015), where increase in reorder quantity, increases total inventory cost. Interestingly, since this increment affected the re-order point it should be used to formulate inventory policy. Also, it was observed that a small drop in crashing cost led to a fast rise in holding cost per unit (see Figure ).
Figure 4. Holding cost per unit against crashing cost per unit.
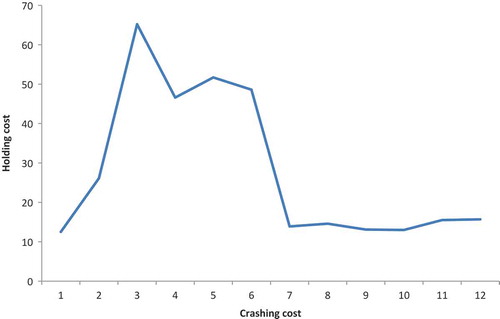
This means that a fall in crashing cost can increase the tendency to buy more stock and this influences unit holding cost. This study observed a significant difference in the effect of types of order quantities: optimal or otherwise on the optimal TC* and nominal TC, respectively. The optimal cost policy of the developed framework was tested by comparing the total expected cost under the TC* and TC and the result showed savings in cost. In view of the preceding statement, the developed inventory cost structure is effective and can be used to make a decision rule for the management of PMS inventory system. So, in managing the fuel stock for the case study station, the monthly decision rule is to ensure that not less than 195,119.84 litres order (Q*) is replenished as stock in inventory drops to 29,743.54 litres reorder (r*) level. This means that where 60,000 litres are the storage tank constraint, the above monthly inventory policy would be loaded 6 times per month (in accordance with Equation (17)) and expedite the order at a cost no more than N 3033.33. This aspect represents the main contribution of this work with respect to reducing the frequency of inventory outages. Other contributions include the estimation of fuel emissions and provision of the technique for evaluating future emissions for future planning purpose, which were reported in this work. The main drawback to the proposed framework is the static nature of the model as the variables need to be subjected to causal analysis which is beyond the scope of this work.
4. Conclusion
This paper developed a reorder point-order quantity inventory cost decision framework augmented by including least squares algorithm, which captures gasoline emissions during delivery of product to customers at the retail stations. The methodology used involved case study strategy and physical measurements at the operational PMS retail station. To facilitate cost formulation, the inventory period was divided into twelve inventory cycles (represented in months) with order quantity and lead time as major decision variables. Also, the evaporated PMS was estimated and the equivalent cost incorporated to the holding cost function through the least square method. The incorporation of the least square method in the computational analysis is novel and results in better performance of optimized variables.
The cost structure was developed based on a factor theory where the relationship between independent and dependent variables were explored for data analysis using mathematical technique. The objectives of reducing the inventory cost were achieved in this study and the developed cost framework is suitable for enhancing the service level. From the results, the framework was helpful to obtain optimal supply at lower inventory cost and a 10% increase of service level above the current level of 80%. It was also, observed that the rates of demand and evaporation of PMS are both asymmetric. The measures of performance of the current inventory system, such as delivery delays, lead time and lead time demand were used and they were able to reveal inadequacies that necessitate need for deploying the developed inventory cost function at the station as a remedy. To reduce significantly those shortcomings inherent in the current PMS distribution system, we recommend further investigation in the area of correlation of (relationship between) PMS inventory policy and supply chain management at consumer level. On basis of results obtained herein, the monthly reorder rule is to ensure that not less than average of 195119.84 litres order (Q*) is placed six times per month as items in inventory drop to 29743.54 litres (r*) level. The proposed inventory cost model if implemented, in the management of PMS inventory system will not only save time, can plausibly increase on-hand inventory. Thus, it will reduce hoarding and scarcity which exist because of inability to identify the trade-off value in having small and high on-hand stocks.
Cover image
Source:
Acknowledgements
The authors wish to express their profound appreciation to all those who assisted with primary and secondary data for this study. We also gratefully acknowledge the anonymous reviewers for their comments which have improved quality of the work.
Additional information
Funding
Notes on contributors
Stephen C. Nwanya
Dr. Stephen C. Nwanya is a senior lecturer in the Department of Mechanical Engineering of the University of Nigeria, Nsukka. He is an industrial engineer and his current work reported herein is part of the efforts to advance the society by offering solutions to industrial problems.
His research interests include industrial production systems design; production inventory management; scheduling operations; industrial energy modelling and management technology. All these research endeavors aim at the development of methods and solutions for national engineering problems. Dr. Stephen C. Nwanya has attended many national and international seminars, conferences and workshops where he presented academic papers.
Dr. Stephen C. Nwanya has supervised successfully many postgraduate students and co-authored textbooks and journal articles of high repute. He has been involved in teamwork in professional, academic and community development groups. He has gained wealth of experience in academic, community service and administration. He is a registered engineer.
Chibuike K. Isi
Chibuike K. Isi holds a Bachelor of Engineering degree in mechanical engineering. He is a postgraduate student at the Department of Mechanical Engineering of the University of Nigeria Nsukka, specializing in industrial engineering and management.
Related Research Data
References
- Benantar, A. , Ouafi, R. , & Boukachour, J. (2016). A petrol station replenishment problem: New variant and formulation. Logistics Research , 9(6), 1–18. doi:10.1007/s12159-016-0133-z
- Chang, H. C. , Ho, C. H. , Ouyang, L. Y. , & Su, C. H. (2009). The optimal pricing and ordering policy for an integrated inventory model when trade credit linked to order quantity. Applied Mathematical Modelling , 33(2009), 2978–2991. doi:10.1016/j.apm.2008.10.007
- Chiu, Y. S. P. , Kuo, J. –. S. , Chiu, S. W. , & Hsieh, Y. –. T. (2016). Effect of delayed differentiation on a multi–Product vendor–Buyer integrated inventory system with rework. Advances in Production Engineering & Management , 11(4), 333–344. doi:10.14743/apem2016.4.231
- Chuang, C. J. , Ho, C. H. , Ouyang, L. Y. , & Wu, C. W. (2013). An integrated inventory model with order-size-dependent trade credit and quality improvement. Procedia Computer Science , 17, 365–372. doi:10.1016/j.procs.2013.05.047
- Considine, T. J. , & Heo, E. (2000). Price and inventory dynamics in petroleum product markets. Energy Economics , 22, 527–547. doi:10.1016/S0140-9883(00)00056-6
- Cornillier, F. , Laporte, G. , Boctor, F. F. , & Renaud, J. (2009). The petrol station replenishment problem with time windows. Computers & Operations Research , 36(2009), 919–935. doi:10.1016/j.cor.2007.11.007
- Ehinomen, C. , & Adeleke, A. (2012). An assessment of the distribution of petroleum products in Nigeria. E3 Journal of Business Management and Economics , 3(6), 232–241.
- Eke, M. N. , & Enibe, S. O. (2007, March). Optimal scheduling of petroleum products distribution in Nigeria. Nigerian Journal of Technology , 26(1), 67-80.
- Franciosi, C. , Carrabs, F. , Cerulli, R. , & Miranda, S. (2017). An evolutionary approach for the offsetting inventory cycle problem. Cogent Engineering , 4, 1370764. doi:10.1080/23311916.2017.1370764
- Gholamian, M. R. , & Heydari, M. (2017). An inventory model with METRIC approach in location‐routing‐inventory problem. Advances in Production Engineering & Management , 12(2), 115–126. doi:10.14743/apem2017.2.244
- Isi, K. C. (2016). Cost inventory of Premium Motor Spirit(PMS) supply and distribution in Nigeria(a case study of oando plc) . University of Nigeria Nsukka.
- Jaffe, A. M. , & Soligo, R. (2002). The role of inventories in oil market stability. The Quarterly Review of Economics and Finance , 42(2002), 401–415. doi:10.1016/S1062-9769(02)00136-9
- Jha, C. K. (2016). Supply chain optimization approaches and market demand analysis of petroleum industry: A case study of ONGC. International Journal of Scientific Research and Management (IJSRM) , 4(7), 4461–4475.
- Kaminsky, P. , & Kaya, O. (2008). Inventory positioning, scheduling and lead-time quotation in supply chains. International Journal of Production Economics , 114, 276–293. doi:10.1016/j.ijpe.2008.02.006
- Liao, C. J. , & Shyu, C. H. (1991). An analytical determination of lead time with normal demand. International Journal of Operations & Production Management , 11(9), 72–78. Permanent link to this document. doi:10.1108/EUM0000000001287
- Ma, W.-M. , & Qiu, -B.-B. , (2012). Distribution-free continuous review inventory model with controllable lead time and setup cost in the presence of a service level constraint. Mathematical Problems in Engineering , 2012, Article ID 867847, 1–16. doi:10.1155/2012/867847
- Nwanya, S. C. (2015). Material inventory optimization in bakery supply chain: Implications for food security in Nigeria. International Journal of Supply and Operations Management , 2(2), 683–699.
- Popovic´, D. , Vidovic´, M. , & Radivojevic´, G. (2012). Variable neighbourhood search heuristic for the inventory routing problem in fuel delivery. Expert Systems with Applications , 39(18), 13390–13398. doi:10.1016/j.eswa.2012.05.064
- Rodrigues, P. C. C. , & Oliveira, O. J. (2010). Engineering –To-order versus make-to-stock strategy: Analysis at two printing companies. Independent Journal of Management and Production , 1(1). doi:10.14807/ijmp.v1i1.28
- Rojas, F. (2017). An application of Kernel estimation method to the demand in two-stage inventory model. Cogent Engineering , 4, 1362803. doi:10.1080/23311916.2017.1362803
- Ronen, D. (1995). Dispatching petroleum products. Operations Research , 43(3), 379–387. doi:10.1287/opre.43.3.379
- Schweitzer, P. J. , & Seidmann, A. (1991). Optimizing processing rate for flexible manufacturing systems. Management Science , 37(1991), 454–466. doi:10.1287/mnsc.37.4.454
- Tarim, A. , & Ulucan, A. (2000). A mathematical programming model for the synchorized development of dynamic inventory and distribution schedules . Beytepe-Ankar: Hacettepe University, Department of Management. Retrieved from https://pdfs.semanticscholar.org/fa51/be3bac1ce1a90c67bf60bfa6588c3385f675.pdf
- Triki, C. (2013). Solution methods for the periodic petrol station replenishment problem. TJER , 10(2), 69–77.
- Triki, C. , Al-Hinai, N. , Kaabachi, I. , & Krichen, S. (2016). An optimization framework for combining the petroleum replenishment problem with the optimal bidding in combinatorial auctions. International Journal of Supply and Operations Management , 3(2), 1318–1331.
- Uddin, K. M. S. , Nipa, N. J. , & Rume, A. R. (2015). Modeling and simulation of an inventory system - A case study of HOMES 71 LTD, Bangladesh. American Journal of Opaerational Research , 5(3), 64–73. doi:10.5923/j.ajor.20150503.03
- Ye, M. , Zyren, J. , & Shore, J. (2001, March). Forecasting crude oil spot price using OECD petroleum inventory levels . Presented at the International Atlantic Economic Conference (pp 324–334). Athens, Greece.