
 ?Mathematical formulae have been encoded as MathML and are displayed in this HTML version using MathJax in order to improve their display. Uncheck the box to turn MathJax off. This feature requires Javascript. Click on a formula to zoom.
Abstract
Highway safety on mountain passes is a major concern to most highway agencies in the Western United States. Large trucks are known to be disproportionately affected on downgrades which characterize mountain passes in comparison to other vehicle classes. However, downgrade crash risks are known to exist also for several other classes of vehicles such as buses, single-unit trucks, recreational vehicles (RVs) and passenger vehicles. The Wyoming Department of Transportation (WYDOT) in an effort to reduce the crash risks existing on Wyoming mountain passes has among other measures installed warning signs on steep grades in the state. However, concerns for out of control vehicles on downgrades persists. An empirical analysis of the safety performance of static warning signs installed two-lane road downgrades was carried out using the negative binomial (NB) modeling approach. A review of the literature indicated that there are unique contributory factors to truck and non-truck crashes. Two crash prediction models were therefore developed each for truck and other vehicles. In an attempt to approach the study holistically and to derive reliable results, traffic and geometric factors were included in the analysis. The results showed that truck escape ramp, directional and speed combination, and hill combination warning signs are effective in reducing truck crashes on downgrades. For non-truck crashes, the presence of downgrade and truck-specific warning signs within 0.5 miles of the downgrade, hill, chevron, and directional and speed combination warning signs reduce crashes to various degrees. It is hoped that this study will provide important information to traffic safety engineers and policymakers concerned with downgrade safety.
PUBLIC INTEREST STATEMENT
Crashes on steep downgrades cause extensive damage to lives and property. Highway agencies have continuously sought measures to reduce the occurrence of downgrade crashes. An important intervention has been the use of downgrade warning signs to present information to drivers about downgrades. The Wyoming Department of Transportation (WYDOT) has installed several warning signs on steep downgrades to counter the incidence of downgrade crashes. This study carried out an empirical analysis of Wyoming downgrade warning signs using the negative binomial modeling approach. Two crash prediction models were developed for truck- and non-truck crashes. It was found that truck escape ramp, directional and speed combination, and hill combination warning signs are effective in reducing truck crashes on downgrades. The general presence of downgrade and truck-specific warning signs within downgrades, hill, chevron, and directional and speed combination warning signs were effective in reducing non-truck crashes.
1. Introduction
Motor vehicle crashes result in the death of more than one million people each year around the world, and between 20 and 50 million more suffer non-fatal injuries (WHO, Citation2015). In 2016 alone, there were 34,439 fatal motor crashes in the United States, which resulted in 37,461 deaths (NHTSA, Citation2018a). Every year, motor vehicle crashes in the US result in an estimated $230 billion, representing 2% of gross domestic product (NRC, Citation2004).
Wyoming has the highest fatality (24.7 deaths per 100,000 population) and truck-related crash rates in the US (Weber & Murray, Citation2014). These high rates result from the relatively high amount of through truck traffic on the interstates and mountainous highways which characterize Wyoming (Mashhadi, Wulff, & Ksaibati, Citation2018). The steep downgrades and curves which are features of mountainous highways place additional challenges on drivers. This increases the crash risks on mountain highways compared to level, straight highways. The causes of crashes on downgrades are varied but have been mainly attributed to inexperienced downgrade driving, defective brakes and inadequate signing (Myers, Irving, & Walter, Citation1981). Other factors related to environment and highway geometry have been cited as well (Ahmed, Huang, Abdel-Aty, & Guevara, Citation2011).
Trucks are especially vulnerable on downgrades because of their large sizes and the heavy loads they carry. Large trucks may weigh as much as 20–30 times passenger vehicles and are also taller which invariably increases their odds of crashes on downgrades. Also, large trucks can run out of control on downgrades due to an inability to stop as a result of brake failure. Brake failure on downgrades is attributed to brake heating, failure to downshift, and mechanical failure (Myers et al., Citation1981)
Driver factors and attitudes no doubt play a significant role in crashes on downgrades. Speeding has generally been identified as a factor in most crashes (Abdel-Aty et al. Citation2005; Elvik, Amundsen, & Hofset, Citation2001). An analysis of the 2015 safety statistics indicates that 48,613 drivers were involved in 32,166 fatal crashes in which 35,092 people lost their lives. Of this number, 18% of drivers were found to be speeding at the time of the crash, and 27% of those killed were in a crash involving at least one speeding driver (NHTSA, Citation2018b).
A study conducted by Lill to investigate unusually severe truck crashes on downgrades identified several primary factors which appear repeatedly for downgrade crashes. Key among the finding was drivers who were inexperienced or unfamiliar with the specific area and downgrades accounted for 43% of the crashes recorded (Lill, Citation1977). Failure to downshift on the grade, and excessive speed were found in 82% of the crashes identified. Other factors identified were driver impairment, defective trucks or brakes, and inadequate signing.
Conclusions drawn from Lill’s and other studies were that warning signs can potentially be effective in preventing downgrade crashes since they mitigate the significant factors (driver unfamiliarity and speeding) identified (Johnson, Myers, DiMarco, & Allen, Citation1982; Myers et al., Citation1981).
Warning signs are used as an important tool for educating road users. They also help in enforcement by assisting in the implementation of traffic laws. Most importantly, warning signs caution drivers about the locations and dangers associated with hazardous sections of highways.
There has been a lot of research effort in evaluating the efficacies of geometric safety improvements such as lane widening, shoulder widening, lane width improvement (Al-Masaeid & Sinha, Citation1995; Labi, Citation2011) two-way left turns, vertical curve flattening (Hovey & Chowdhury, Citation2005), among many others. Other safety effectiveness studies have focused on intersections, bypasses, and cross-sectional elements (Bauer & Harwood, Citation2000; Elvik, Citation2008; Zeeger, Hummer, Herf, Reinfurt, & Hunger, Citation1987). Comparatively, relatively fewer research efforts have been undertaken with regards to the safety effectiveness of advance warning signs.
Bowman (Citation1993) found that majority of advance warning devices used by highway agencies were not evaluated by formal effectiveness studies but are simply assumed to be effective by most agencies. Veneziano and Knapp (Citation2016) noted that the impact of only a few commonly used static warning signs has been studied and documented by any state-of-the-practice approach with robust results. The study rated the most previous research on the safety effectiveness of warning signs as having low or medium reliability. Carson, Nee, and McCormack (Citation2005) researched the safety effectiveness of ice warning signs and concluded that the signs appear to have a statistically significant effect on traffic speeds, lane change, and braking activity even though drivers were oblivious to their existence. Hallmark, Hawkins, and Smadi (Citation2015) evaluated the effect dynamic speed signs on curves had on vehicle approach speeds in different states and concluded the warning signs were generally effective in decreasing speeds. Al-Kaisy (Citation2006) in studying the efficacy of static warning signs for occasional hazards conducted a survey by a questionnaire sent to all 50 state Departments of Transportations (DOTs) and 2 Canadian provinces. Results from the 28 responding DOTs suggested that most states are not assured about the effectiveness of static warning signs for occasional hazards. The survey results, however, indicated that most responding DOTs found the use of unconventional warning devices to be effective. Another study of selected warning devices for reducing truck speeds suggests signs targeted at trucks such as “truck tipping” warning signs and flashing lights mounted above and below a “truck tipping” sign reduce truck approach speeds (Middleton, Citation1994).
The above discussion is a review of some studies conducted on the safety effectiveness of warning signs. The studies agree to varying degrees that warning signs are important in reducing crashes though their effectiveness have not been quantitatively evaluated in most instances. The authors in reviewing literature for this study did not find any research work targeted specifically on downgrade warning signs, which suggests a research gap in the safety effectiveness studies. This study was motivated by the need to assess the safety effectiveness of downgrade warning signs to prevent the incidence of downgrade crashes. This was achieved by calibrating crash frequency models for trucks and other vehicles. Estimating the safety effectiveness advance warning signs installed on downgrades will help identify signs which are effective in countering crashes on downgrades. The results of this study will also serve to enhance knowledge on the installation and use of downgrade warning signs as recommended by the MUTCD.
2. Methodology
With most crash data being in the form of non-negative integers, Poisson regression is mostly a starting point for any regression model. Poisson regression modeling is a technique that overcomes the ordinary least square (OLS) requirement for constant variance and normal distribution. However, Poisson regression models restrict the mean to be equal to the variance, which may result in biased and inconsistent coefficient estimates in the presence of over-dispersed data (Lord & Mannering, Citation2010).
The negative binomial (NB) regression model, which is an extension of the Poisson regression model, is able to overcome the deficiency of possible over-dispersion in the data. An over-dispersion parameter is introduced in the NB model to account for dispersion in the data.
The NB regression model is derived from the Poisson regression model which is specified as follows:
where; is the probability of a roadway entity i having
crashes within a time period and
is the Poisson parameter for roadway entity i. Rewriting the Poisson parameter for each observation gives the NB regression model. This is written as:
where; is a gamma distributed error term with a mean of 1 and a variance
. The addition of the gamma-distributed term allows the mean to differ from the variance in the NB regression model.
The safety effectiveness of warning signs can be calculated using the elasticity of the parameter estimates obtained from regression models (Donnell, Porter, & Shankar, Citation2010; Labi, Citation2011). Elasticity is a measure of the responsiveness of one variable change to a change in another (Washington, Karlaftis, Mannering, & Fred, Citation2011). In the context of the warning signs, elasticity is interpreted as the percent change in expected crash frequency resulting from a 1% change in a continuous explanatory variable. The elasticity of the dependent variable Y with respect to an independent variable X is given by:
Elasticity for indicator variables, also known as pseudo-elasticity, refers to the percent change in expected crash frequency given a change in the value of the indicator variable from zero to unity. This is defined as:
Elasticity is a useful measure of effectiveness because it is dimensionless unlike an estimated regression parameter, which is dependent on the units of measurement (Washington et al., Citation2011).
To select between the Poisson and negative binomial regression models, model fit statistics and the significance of the dispersion parameter were analyzed. The model fit statistics analyzed for this study were the log-likelihood statistic and the Akaike Information Criterion (AIC).
Model validation was undertaken using the leave-one-out cross-validation (LOOCV) technique. The LOOCV technique was chosen due to the limited data size. This approach provides a method to estimate generalization errors and allows for comparison between models. In this technique, one observation is selected as the test set with all other observations considered as the test set. A prediction is made for the point after which the error is then computed. This procedure is repeated for all the observations and an average error is estimated to evaluate the model.
3. Data
The first step in the analysis involved the identification of hazardous downgrade sections. The Manual on Uniform Traffic Control Devices (MUTCD) specifies the combination of downgrades and lengths deemed hazardous to road users. These hazardous downgrades must meet any of the following criteria (FHWA, Citation2009):
a 5% grade that is more than 3,000 ft. (914.4 m) in length,
a 6% grade that is more than 2,000 ft. (609.6 m) in length,
a 7% grade that is more than 1,000 ft. (304.8 m) in length,
an 8% grade that is more than 750 ft. (228.6 m) in length, and
a 9% grade that is more than 500 ft. (152.4 m) in length.
The Wyoming Department of Transportation (WYDOT) maintains a database containing general roadway geometric characteristics, route numbers, mileposts (MPs), elevations, and vertical and horizontal alignment information. Grades for different sections were computed using information from the WYDOT database. The grade between two different locations was computed from their elevations and MPs from (EquationEquation 1)(1)
(1) :
The calculations allowed a graphical plot of gradient against mileposts to be generated for each route to help identify grades that met the MUTCD criteria. A typical plot on US 16 is as shown in Figure .
Figure 1. Grade profile by MP for route ML36 (US 16)
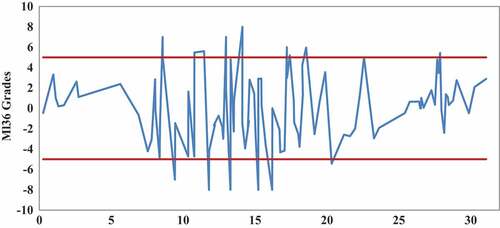
The length and grade combination of each section was then examined to assess if it met the MUTCD criteria requiring the installation of a steep grade warning sign. Online video logs from Pathway Services Inc. were used to visually check the routes selected and information on grades as well as signage at the various locations. Eleven years of crash data for each section was obtained from the Critical Analysis Reporting Environment (CARE) package. The CARE package provides information on historical accident data from crash reports and is used by many DOTs across the nation to analyze and present crash information. Information such as crash severity, date, vehicle type, location, and crash circumstances was gathered for the selected downgrade sections. Geometric characteristics were also obtained from WYDOT and aggregated to the crash data.
Other information such as number of lanes, passing lanes, MP markers, downgrade direction, start, and end of each downgrade section, posted speed limits, brake check areas, and truck escape ramps were collected. The data set compiled had horizontal and vertical characteristics, cross-sectional, and warning sign information.
3.1. Homogenous segmentation
To achieve reliable and accurate results for safety analysis using any cross-sectional method, it is recommended that homogeneous segments be used (AASHTO, Citation2010; Gross, Persaud, & Lyon, Citation2010). Homogenous segments refer to segments with similar characteristics, with each segment homogenous in respect of features such as length, traffic volume, roadway design, and traffic control features (AASHTO, Citation2010). Based on the Highway Safety Manual (HSM), a new homogenous segment begins at the center of each intersection or the following criteria:
Beginning of a horizontal curve,
Point of vertical intersection for a sag or crest vertical curve,
When there is a change in at least one of the following criteria:
• Average annual daily traffic,
• Lane width,
• Shoulder width,
To assess the impact of the warning signs and other road characteristics, the above criteria were considered based on a minimum length of 0.10 mile.
3.2. Types of advance warning signs
The types and number of installed warning signs were collected on 157 sections of the included routes in the study. All the downgrades considered fulfilled the criteria specified by the MUTCD for installing downgrade warning signs. The categories of advance warning signs collected are shown in Figure . These are:
Figure 2. Categories of warning signs (MUTCD)
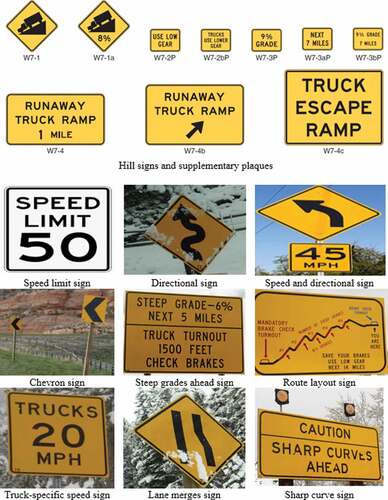
3.2.1. Hill signs/hill signs with advisory grade or distance plaques
Hill signs (W7-1, W7-1a) are usually placed in advance of downgrades to warn drivers of a steep decline. These signs are frequently used in combination with supplemental signs (W7-2bP, W7-3P, W7-3aP, and W7-3bP) (FHWA, Citation2009). Supplemental signs emphasize the use of lower gears and speed at locations where conditions justify extra caution. Hill warning signs are installed on locations where crash experience, or engineering judgment indicate a need. These warning signs were divided into the hill signs alone or the combinations of the hill signs and supplement signs.
3.2.2. Truck escape ramp signs
As can be seen from Figure , this category includes W7-4, W7-4b, and W7-4c. These signs inform drivers, especially truck drivers of the provision of truck escape ramp facilities for use of out of control vehicles. This sign in this study also was used as an indication of the presence of an escape ramp.
3.2.3. Directional warning signs
Warning signs of this type are installed on mountain passes to inform drivers of changes in horizontal alignment and route direction.
3.2.4. Directional sign/directional sign and advisory speed plaque
Most often, directional warning signs were combined with advisory speed plaques or were installed close to speed signs for emphasis on reducing speed. These two groups were combined for the analysis.
3.2.5. Chevron warning signs
These are signs installed to show the edge of the road in dangerous curves and provide an emphasis for sudden changes in horizontal curves. Chevron signs are placed at the actual location of the curve change or bend to assist in safely negotiating such sections. They are usually black arrows placed on a yellow background.
3.2.6. Miscellaneous warning signs
Several other downgrade warning signs were identified during the data collection warning drivers of approaching downgrades. Some of these signs did not have enough observations to categorize them into individual groups. These included lane merges, high wind, route layout, and rollover signs among others. Due to their assorted these signs were placed in a miscellaneous category.
3.3. Summary of warning signs and variables
The total length of downgrades considered for the study was 172 miles of mainly two-lane highways, segmented into 1416 sections. However, due to unavailability of warning sign information on some segments, the number of observations used for the analysis was 1232. Three miles of advance warning signs were collected before the start of downgrades along with warning signs within the downgrades. This meant that the total length used for frequency analysis of the advance warning signs was 3,696 miles. Since the warning signs were mostly installed in advance of the downgrade, signs within the downgrade were found to have low frequencies. Warning signs within the downgrade were therefore combined into a single category in the modeling process. A complete list of variables related to warning sign along with their frequencies and normalized information (frequency/mile) are presented in Table .
Table 1. Summary statistic warning signs
Apart from the warning signs, variables related to geometric and traffic characteristics of the segments were considered for the analysis. These variables included number of crest curves, lane width, number of sag curves within segments, curve radius and length, average daily traffic (ADT) among others. Tables and show the descriptive statistics of the significant variables.
Table 2. Summary statistics of major variables (categorical variables)
Table 3. Summary statistics of key variables (continuous variables)
4. Estimation results
In this section, the contributory factors to truck and other vehicular (non-truck) crashes will be discussed. Poisson and NB regression models were analyzed for the study. The statistical significance of the dispersion parameter is an indication that the NB models were better fits to the data. Also, AIC values were found to be lower for the NB models suggesting a better fit in comparison to the Poisson model. Comparatively, higher log-likelihood estimates for the NB models were interpreted in the same manner. For brevity, the Poisson regression models are not shown in the paper.
NB estimation results of the models predicting downgrade crash frequency for trucks and other vehicles areas are presented in Tables and . The tables include the estimated coefficient, standard error, Wald chi-square, and p-value. Most of the presented results are reasonable and intuitive. Interpreting the effect of an explanatory variable for NB models is done in terms of the exponent of the parameter estimate. For instance, a parameter estimate of 0.20 implies that for a unit increase in that independent variable, the expected number of crashes will increase by a factor of exp(0.20) = 1.22% or 22% while holding all the other variables in the model. Conversely, a parameter estimate of −0.20 indicates that for a unit increase in the independent variable of interest, the expected crash frequency is expected to decrease by 1 − exp(−0.20) = 0.18% or 18% while holding all other variables in the model constant.
Table 4. Estimated regression parameters for truck crash frequency
Table 5. Estimated regression parameters for other vehicular (non-truck) crash frequency
4.1. Negative binomial model for truck crash frequency
The first analysis was conducted by incorporating only truck crashes. It is hypothesized that because trucks are prone to crashes on downgrades due to their sizes and loads, truck drivers pay close attention to specific warning signs related to trucks and the downgrade geometry. Though other vehicle drivers consider all warning signs, they may not pay as close attention to the downgrade-specific warning signs as truck drivers do. Also, the literature recommended that the crashes be analyzed separately due to the uniqueness of the contributory factors of each crash type. The significant variables in this analysis were divided into roadway characteristics and warning signs. Table shows the estimation results of the NB model for truck crashes.
4.2. Roadway characteristics
4.2.1. Average grade
The parameter estimate for average grade was found to be significant with a positive coefficient, indicating that higher grades are associated with higher truck-related crashes. The results suggest that an increase in the vertical grade by 1% will result in an increase in truck crashes by a factor of 1.32 [exp(0.277)] given that the other variables are held constant. The result is expected because trucks are much more prone to crashes on downgrades due to brake failure. This result is consistent with findings in the existing literature (Bowman & Coleman, Citation1989; Johnson et al., Citation1982).
4.2.2. Superelevation
Table suggests that superelevation is positively associated with truck crash frequency on downgrades. A unit change in superelevation will result in an increase in truck crashes by up to a factor of 1.05 [exp(0.047)] while holding all other variables in the model constant. This result is intuitive because it is known that trucks have higher risks of over-turning or toppling on curves due to their high center of gravity and are difficult to control on curves (Khattak, Schneider, & Targa, Citation2003; Mcknight, Bahouth, Mcknight, & Bahouth, Citation2009). The results somehow confirm findings by Stimpson (Citation1977) which showed that the interaction between superelevation with other factors such as improper speed selection leads to an increase in crashes. However, a study conducted by de Milliken and de Pont (Citation2005) concluded that a 1% increase in superelevation could reduce heavy vehicle loss-of-control crash risk while cornering. It should be noted that for two-lane highways, only one superelevation is constructed along a cross-section of the road, which would result in more challenges while cornering. The adverse effects of downgrade–curve interaction and high superelevation at curves is another phenomenon which may be a major reason for this finding.
4.2.3. Deflection angle
Deflection angles occur by setting two tangents in a horizontal curve. Higher deflection angles result in a longer and smoother curve, which would consequently increase the crash risk by encouraging speeding. The positive parameter estimate for deflection angle is thus expected. The analysis suggests that a one-degree increase in deflection angle will result in about a 2.4 increase in truck crash frequency. This finding is consistent with existing literature and engineering intuition (Hauer, Citation1999).
4.2.4. Passing lane
The passing lane variable was shown to have a significant impact on the frequency of truck-related crashes. The negative sign of the coefficient suggests that the presence of a passing lane decreases the frequency of truck-related crashes by about 47% for each unit of passing lane added while holding all other variables in the model constant. A passing or overtaking lane is provided closest to the farthest left lane. As traffic level increases and the opportunities for passing become more restricted, passing lanes provide an effective means in allowing safe overtaking (Al-Kaisy & Freedman, Citation2011). Also, passing lanes provide opportunities for trucks experiencing brake failure to safely maneuver while avoiding traffic.
4.3. Traffic characteristics
4.3.1. ADTT
The positive sign of average annual daily truck traffic (ADTT) indicates that road segments with high truck traffic experience higher truck-related crashes. This is an expected result as greater numbers of trucks on downgrades increases the risk of a crash occurring due to brake failure, and an increased vehicle–vehicle interaction. However, Milton and Mannering (Citation1998) have found that an increase in the percentage of truck traffic is associated with a decrease in crashes. They argued that as the percentage of trucks increase in the traffic stream in relation to cars, the frequencies of vehicle overtaking, and lane changes decrease, reducing the risk of crashes.
4.4. Warning signs
4.4.1. Warning signs within downgrade
As discussed previously, observations for warning signs within the downgrade segments were low. This necessitated combining all the warning signs within the downgrade segments into one category. Warning signs installed within downgrades were found to be statistically significant at a 5% significance level for truck-related crashes. The positive coefficient of these warning signs indicates a positive association with higher truck crash frequencies. This does not mean these signs increase crashes, but the positive coefficient may only suggest that such warning signs are installed on blackspots; areas known to have high crashes. The positive parameter estimate of this variable may also be the result of confounding brought about by the different groupings of warning signs in this category.
4.4.2. Miscellaneous warning signs
Miscellaneous downgrade signs were found to be significant when installed in advance of downgrades. The results suggest an increase in miscellaneous downgrade signs is associated with higher truck crashes. The result is unexpected but may be an indication that such downgrade signs are installed on locations with high frequencies of crashes.
4.4.3. Hill sign combination with downgrade and distance advisory plaque
The results indicated that the hill sign combination with downgrade and distance advisory plaque (W7-1 + W7-3aP) significantly reduce truck-related crashes. A unit increase in the number of this sign will lead to an estimated decrease of truck crashes by 36% while holding all variables in the model constant. This may be due to this sign being easily recognizable and the extra information provided on these sign types.
4.4.4. Truck escape ramp signs
Truck escape ramp signs were found to be associated with a decrease in truck crash frequency on downgrades. Truck escape ramps allow vehicles, especially trucks that have run out of control due to brake problems to come to a safe stop. These ramps are predominantly installed on downgrades where the incidence of truck runaways is high (Witherford, Citation1992). The warning sign may not by itself reduce truck crashes, but the presence of truck escape ramps may have engendered this effect. This is because segments with truck escape ramps observe fewer truck crashes in comparison to locations without the ramps. The parameter estimate suggests that a unit increase of a truck escape ramp sign will reduce truck crashes by about 44% while holding all other variables in the model constant.
4.4.5. Directional and speed combination advisory sign
The directional and speed plaque advisory sign was found to be related to a decrease in truck crashes on downgrades. A unit increase in the frequency of this sign is associated with a 32% decrease in the number of truck crashes while holding all variables in the model constant. This warning sign is important on downgrades due to the winding nature of such terrain which also requires low operating speeds.
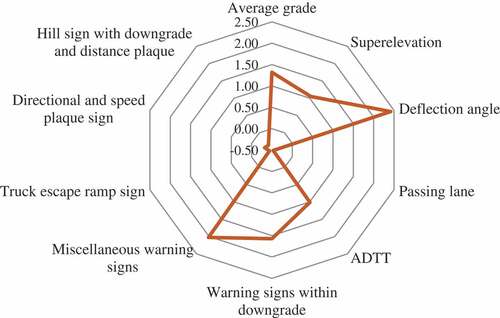
4.5. Graphical representation of variable impacts on truck crashes
To visually represent the effect impact of a unit change of the independent variable on truck crashes, a radar chart is shown in Figure . The impact is in terms of the exponent of the parameter estimate of the independent variable. That is exp(β) for positive estimates or 1-exp(β) for negative parameter estimates.
Figure 3. Impact of independent variables on truck crashes
4.6. Negative binomial model for other vehicles (non-trucks) crash frequency
The second analysis was conducted to identify the effects of variables on other vehicular crash frequency. Several variables were found to impact the frequency of other vehicular crashes including curve length and type, superelevation, tangent length, presence of passing lane, ADTT and several warning signs.
4.7. Roadway characteristics
4.7.1. Downgrade length
Downgrade length was shown to have a significant influence on non-truck crashes. As can be seen from Table , the positive sign of the parameter estimate for downgrade length indicates that increasing the downgrade length is associated with a higher occurrence of crashes. The result suggests that for every mile of downgrade length, the expected crash frequency will increase by a factor of 38.6 (using the unstandardized downgrade length) while holding all other variables in the model constant. This result is an expected outcome as an increase in downgrade length, like other exposure variables, increases the risk of crashes.
4.7.2. Curve type
The results from Table indicates that curve type is statistically significant at the 0.95 confidence level. The results show that crest curves are associated with a decrease in the frequency of non-truck crashes compared to level sections. It was found that a unit increase in slope leads to about a 15% decrease in crashes if all other variables in the model are held constant. This, in the context of improving traffic does not offer much information; it cannot be recommended that more crest curves be constructed. The results may buttress the point that downgrades dominated by sag curves have higher risks of crashes occurring on them.
4.7.3. Superelevation
Like the results obtained for truck crash frequencies, superelevation was found to be positively associated with an increase in other vehicle crashes. The results suggest a factor of 1.08 increase in the number of expected crashes for a 1% increase in superelevation on downgrades.
4.7.4. ADTT
As expected, ADTT is positively associated with an increase in the number of crashes on downgrades. The explanation of the effect of ADTT on truck crashes holds for these types of crashes. However, the effect of ADTT on non-truck crashes was found to be marginal. A unit increase of ADTT results in an expected increase of crashes by a factor of 1.002 given all other variables in the model are held constant. This factor increases with increasing truck traffic. Although ADT and ADTT were included in the preliminary analyses, only ADTT was found to be significant in the final model.
4.7.5. Passing lane
The effect of passing lane on crash frequency is similar to what was found for trucks. The results suggest that for a unit increase in the number of passing lanes, the expected crash frequency will decrease by 17% while holding all the other variables in the model constant.
4.8. Warning signs
4.8.1. Presence of downgrade warning signs
This category of warning signs refers to downgrade-specific or truck-specific warning signs (hill sign and combinations, truck escape ramp signs, truck speed signs, etc.) installed predominantly on hills. For this analysis, they were considered present if they were installed 0.5 miles or less in advance of downgrades. They exclude speed limit, directional, chevron, lane merges, and high wind warning signs. This variable was created to assess the impact of general downgrade signs on crashes. The presence of a downgrade warning sign was found to significantly reduce non-truck related crashes. This may be an indication that the downgrade warning signs specified are effective in preventing non-truck crashes even though they are targeted at larger vehicles crashes.
4.8.2. Hill sign (W7-1)
The hill sign was found to have a negative influence on the frequency of other vehicle crashes on downgrades. The results show that by adding a hill sign, the expected frequency of non-truck crashes will decrease by about 43%. This finding indicates that hill signs do not only impact truck crashes but other crashes as well. A plausible explanation for this result is that drivers become aware of possible truck traffic in the presence of the hill sign. Also, the hill sign is well known to motorists who drive on mountain passes and is an indication of an upcoming difficult terrain. These reasons may lead to cautious driving, thus resulting in a decrease in crash frequency.
4.8.3. Chevron warning sign
The negative coefficient for Chevron warning signs installed before downgrades for the non-truck crash frequency model indicates that sections with higher numbers of chevron warning signs generally experience fewer crashes. The results suggest installing a Chevron sign in advance of a downgrade will lead to about an 11% reduction in non-truck crashes while holding all other variables constant. This is expected because Chevron warning signs which alert drivers to sudden changes in horizontal alignment are associated with a decrease in travel speeds in order to safely negotiate such geometric changes. Reducing speed while traveling over mountain passes is highly recommended to decrease the probability of run-off road crashes. Other studies have confirmed this finding where Chevron signs have been found to reduce crashes by up to 50% (Lalani, Citation1992).
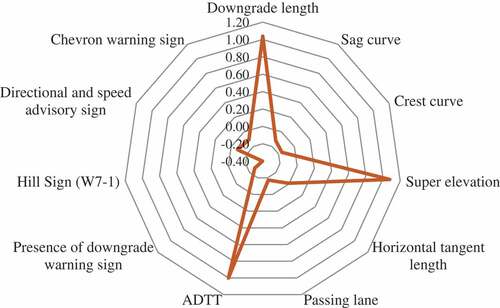
4.9. Graphical representation of variable impacts on non-truck crashes
Figure is a radar chart showing the impact of a unit change in the independent variables on non-truck crash frequency. Again, the impact is expressed in terms of the exponent of the parameter estimate of the independent variable.
Figure 4. Impact of independent variables on non-truck crashes
5. Elasticities and safety effectiveness of identified factors
After the crash prediction models, crash reduction and safety improvements were estimated by elasticity estimated from the regression parameters. The result of the elasticity analysis is shown in Table .
Table 6. Elasticity of crash prediction model for truck and other vehicle crashes truck frequency model elasticities non-truck frequency model elasticities
The results show that passing lanes are the most effective measures in preventing truck crashes on downgrades. For warning signs, directional and speed advisory combinations, truck escape ramp and the hill combination signs were found to be effective. In terms of non-truck crashes, curve type, passing lanes, general downgrade warning signs, hill signs, directional and speed advisory combination signs, and chevron signs were all effective in reducing crash frequency. The highest effect was found from hill signs, followed by directional and speed advisory combination signs.
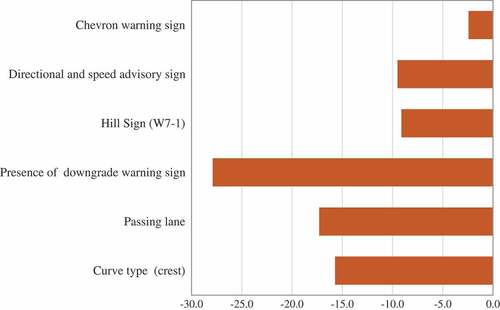
Bar charts are provided in Figures and to graphically show the elasticity of variables which were found to reduce crash frequency. The elasticities represent the percent reduction of crash frequency for a 1% change in the independent variable.
Figure 5. Bar chart for elasticities (truck crashes)
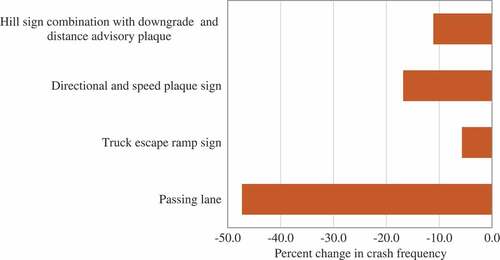
Figure 6. Bar chart for elasticities (non-truck crashes)
6. Conclusions and recommendations
The high cost of crashes, especially on downgrades to the society justifies evaluating the safety effectiveness of warning signs. This paper presented comprehensive crash prediction models incorporating warning signs, geometric and traffic variables from which safety effectiveness was analyzed. Though the study focused on warning signs, other factors identified could be useful in understanding the impacts of those variables on downgrade crash frequencies. The study found that there is empirical evidence to justify the installation of advance warning signs for downgrades. Specifically, the study found that:
Warning signs were more effective when they are installed in advance of downgrades in comparison to warning signs installed within the sections. Signs installed before downgrades were found to be effective not only in reducing truck crashes but other vehicular crashes as well.
The directional and speed plaque combination sign was found to be the most effective sign in reducing truck crashes on downgrades. Truck escape ramp signs and hill combination signs were also shown to reduce truck crash frequencies. The results of the elasticity analysis indicate that these signs can reduce truck crashes from about 6% to 17%.
For non-truck crashes, chevron, hill, directional and speed plaque combination sign, and presence of a downgrade warning sign were found to be effective in reducing crashes on downgrades. The elasticity analysis suggests that the presence of a downgrade sign (within 0.5 miles) in advance of the downgrade has the highest safety effect of about 28% on non-truck crashes. Overall, the warning signs identified were found to have a safety effectiveness of about 2% to 28% for non-truck involved crashes.
The analysis showed that the presence of a passing lane has a significant effect on reducing both truck and non-truck crash frequencies on downgrades. The findings also indicate that crest curves reduce other crashes on downgrades.
Despite the analysis showing that general installation of warning signs reduces crash frequencies, a lot of thought should go into the locations and numbers installed. Installing many warning signs than needed may result in drivers losing their respect for them and disregarding pertinent information in the process (FHWA, Citation2009).
Intelligent Transportation Systems (ITS) may be used along with the current warning sign regime on mountain passes in Wyoming. Such ITS measures include warning systems with the ability to communicate speeds and weights to large vehicles fitted with transponders, thermal imaging of heavy vehicle brakes on brake check areas, speed feedback systems to alert drivers of heavy vehicles when they exceed the safe speed at a location, and the potential use of in-vehicle telematics.
Having discussed which warning signs are effective in preventing crashes on downgrades, it is important to note that not all the important warning signs were statistically significant in this study. This may have been due to a lack of variation observed for these warning signs to be significant in the models. Equally important is that warning signs function as a system and not individually. This concept was not pursued in this study due to data limitations.
For future studies, the safety evaluation of warning signs should be linked to the importance that drivers place on them. This may need a comprehensive psychological evaluation to understand the preventative impact of the warning signs. Other studies should on completely assessing the safety impacts of warning signs based not only on crash frequency but also on crash severity.
Also, the impact of warning signs on crash severity may be analyzed in a future study. Though several studies have used count models such as the Poisson and NB models to predict crash frequencies, their use in crash severity analysis has been limited. The use of count models in crash severity analysis is complicated because the counts of crash in each severity level are not independent. This implies that the correlation among specific injury crash counts must be taken into account (Anastasopoulos & Mannering, Citation2011). Therefore, methodological approaches such as multinomial logit models, ordered logit models, mixed logit models, and ordered probit models are preferred for crash severity analysis.
Acknowledgements
The Wyoming Technology Transfer (WYT2/LTAP) Center at the University of Wyoming provided extensive resources to assist in the compilation of the data sets used. The authors would like to acknowledge that this work is part of project #RS08216 funded by the Wyoming Department of Transportation (WYDOT). All Figures, tables, and equations listed in this paper will be included in a WYDOT final report at the conclusion of this study.
Additional information
Funding
Notes on contributors
Milhan Moomen
Milhan Moomen is currently completing a PhD in civil engineering at the University of Wyoming. His research focuses on truck traffic safety on downgrades.
Mahdi Rezapour
Mahdi Rezapour (PhD), is a post-doctoral research associate at the department of civil engineering, University of Wyoming. He attended the University of North Dakota and University of Wyoming for his graduate education.
Khaled Ksaibati
Khaled Ksaibati (PhD, P.E.), is a Professor of civil engineering at University of Wyoming. He is also currently the director of the Wyoming Technology Transfer Center. He attended Wayne State University, and Purdue University for his education.
The research presented in this paper is part of a wide study of updating and implementing the Grade Severity Rating System (GSRS) for Wyoming Mountain Passes. The study aims at improving truck safety on Wyoming mountain passes by recommending safe descent speeds to drivers.
References
- AASHTO. (2010). Highway Safety Manual.
- Abdel-Aty, M., Uddin, N., & Pande, A. (2005). Split models for predicting multivehicle crashes during high-speed and low-speed. Transportation Research Record, 1908, 51–58. doi:10.1177/0361198105190800107
- Ahmed, M., Huang, H., Abdel-Aty, M., & Guevara, B. (2011). Exploring a Bayesian hierarchical approach for developing safety performance functions for a mountainous freeway. Accident Analysis & Prevention, 43, 1581–1589. doi:10.1016/j.aap.2011.03.021
- Al-Kaisy, A. (2006). Static warning signs for occasional hazards : A synthesis of research and practice. Bozeman, MT: Western Transportation Research Institute.
- Al-Kaisy, A., & Freedman, Z. (2011). Empirical examination of passing lane operational benefits on rural two-lane highways. Procedia - Social and Behavioral Sciences, 16, 340–351. doi:10.1016/j.sbspro.2011.04.455
- Al-Masaeid, H. R., & Sinha, K. C. (1995). Analysis of accident reduction potentials of pavement markings. Journal of Transportation Engineering, 120, 723–736. doi:10.1061/(ASCE)0733-947X(1994)120:5(723)
- Anastasopoulos, P. C., & Mannering, F. L. (2011). An empirical assessment of fixed and random parameter logit models using crash- and non-crash-specific injury data. Accident Analysis & Prevention, 43, 1140–1147. doi:10.1016/j.aap.2010.12.024
- Bauer, K. M., & Harwood, D. W. (2000). Statistical models of at-grade intersection accidents—addendum. Kansas City, MO: Federal Highway Administration.
- Bowman, B. L. (1993). Supplemental advance warning devices (NCHRP Synthesis of Highway Practice No. 186.). Transportation Research Board, Washington, DC.
- Bowman, B. L., & Coleman, J. A. (1989). Impact of fuel conservation measures on safe truck downgrade speeds. Journal of Transportation Engineering, 115, 351–369. doi:10.1061/(ASCE)0733-947X(1989)115:4(351)
- Carson, J. L., Nee, J., & McCormack, E. (2005). An investigation into the effectiveness of the ice warning sign placement features. Washington, DC: Washington State Department of Transportation.
- Donnell, E. T., Porter, R. J., & Shankar, V. N. (2010). A framework for estimating the safety effects of roadway lighting at intersections. Safety Science, 47, 1436–1444. doi:10.1016/j.ssci.2010.06.008
- Elvik, R. (2008). The predictive validity of empirical Bayes estimates of road safety. Accident Analysis and Prevention, 40, 1964–1969. doi:10.1016/j.aap.2008.07.007
- Elvik, R., Amundsen, F., & Hofset, F. (2001). Road safety effects of bypasses. Transportation Research Record, 1758, 13–20. doi:10.3141/1758-03
- FHWA. (2009). Manual on Uniform Traffic Control Devices for Streets and Highways.
- Gross, F., Persaud, B., & Lyon, C. (2010). A guide to developing quality crash modification factors. Washington, DC: Federal Highway Administration.
- Hallmark, L. S., Hawkins, N., & Smadi, O. 2015. Evaluation of Dynamic Speed Feedback Signs on Curves: A National Demonstration Project, p. 210.
- Hauer, E. (1999). Safety and the choice of degree of curve. Transportation Research Record, 1665, 22–27. doi:10.3141/1665-04
- Hovey, P., & Chowdhury, M. (2005). Development of crash reduction factors. FHWA/OH-2005/12. Ohio Department of Transportation.
- Johnson, W. A., Myers, T. T., DiMarco, R. J., & Allen, W. R. (1982). A downhill grade severity rating system. SOC. Automotive Engineering, 811263.
- Khattak, A. J., Schneider, R. J., & Targa, F. (2003). Risk factors in large truck rollovers and injury severity: Analysis of single-vehicle collisions. In: 82nd Annual Meeting of the Transportation Research Board, Washington, DC.
- Labi, S. (2011). Efficacies of roadway safety improvements across functional subclasses of rural two-lane highways. Journal of Safety Research, 42, 231–239. doi:10.1016/j.jsr.2011.01.008
- Lalani, N. (1992). Comprehensive study of safety program produces dramatic results. ITE Journal, 61, 31–34.
- Lill, R. A. (1977). Review of BMCS Analysis and Summary of Accident Investigations, 1973–1976 With Respect to Downgrade Runaway Type Accidents.
- Lord, D., & Mannering, F. (2010). The statistical analysis of crash frequency data: A review and assessment of methodological alternatives. Accident Analysis and Prevention, 44, 291–305.
- Mashhadi, M. M. R., Wulff, S. S., & Ksaibati, K. (2018). A comprehensive study of single and multiple truck crashes using violation and crash data. The Open Transportation Journal, 12, 43–56. doi:10.2174/1874447801812010043
- Mcknight, A. J., Bahouth, G. T., Mcknight, A. J., & Bahouth, G. T. (2009). Analysis of large truck rollover crashes analysis of large truck rollover crashes. Traffic Injury Prevention, 9588. doi:10.1080/15389580903135291
- Middleton, D. (1994). A study of selected warning devices for reducing truck speeds. College Station, TX: Texas A & M University.
- Milliken, P., & de Pont, J. (2005). The effect of cross-sectional geometry on heavy vehicle performance and safety (Research Report No. 263). Wellington, New Zealand: California Transit Association.
- Milton, J., & Mannering, F. (1998). The relationship among highway geometrics, traffic-related elements and motor-vehicle accident frequencies. Transportation, 25, 395–413. doi:10.1023/A:1005095725001
- Myers, T. T., Irving, L. A., & Walter, A. J. (1981). Feasibility of grade severity rating system. Washington, DC: Federal Highway Administration.
- NHTSA. (2018a). Fatality Analysis Reporting System (FARS) encyclopedia [WWW document] . FARS traffic saf. facts. Retrieved from https://www-fars.nhtsa.dot.gov/Main/index.aspx
- NHTSA. (2018b). Critical reasons for crashes investigated in the national motor vehicle crash causation study. Washington, DC: U.S. Department of Transportation.
- NRC. (2004). Measuring Personal Travel and Goods Movement: A Review of the Bureau of Transportation Statistics Surveys.
- Stimpson, W. A. (1977). Field evaluation of selected delineation treatments on two-lane rural highways. Washington, DC: Federal Highway Administration.
- Veneziano, D., & Knapp, K. (2016). Sign effectiveness guide. Ames, IA: Iowa State University Institute for Transportation.
- Washington, S. P., Karlaftis, M., Mannering, G., & Fred, L. (2011). Statistical and econometric methods for transportation data analysis (Second ed.). Washington, DC: CRC Press.
- Weber, A., & Murray, D. C. (2014). Evaluating the impact of commercial motor vehicle enforcement disparities on carrier safety performance. Minneapolis, MN: American Transportation Research Institute.
- WHO. (2015). Global status report on road safety. France: World Health Organization.
- Witherford, D. K. (1992). Truck escape ramps; A synthesis of practice (NCHRP Synthesis 178). Washington, DC: Transportation Research Board.
- Zeeger, C. V., Hummer, J., Herf, L., Reinfurt, D., & Hunger, W. (1987). Safety cost-effectiveness of incremental changes in cross-sectional design-informational guide. Washington, DC: Federal Highway Administration.