
Abstract
Conduction of geotechnical survey prior construction is a non-negotiable requirement before the erection of any engineering structure so as to avoid building collapse which has been rampant in our country of late. An easier, faster and relatively cheaper approach to conducting a comprehensive geotechnical investigation for site characterization without compromise to standards was the focus of this study. Seismic refraction method; a quick, non-destructive and non-intrusive method of obtaining key subsoil geotechnical properties necessary for foundation design for proposed engineering facilities was suggested. This approach was used to generate some seismic parameters, which are very relevant to geotechnical investigation. The seismic wave velocities generated from near surface refraction method was used to determine the allowable bearing capacity, the ultimate bearing pressure, and the liquefaction potential so as to delineate the most competent layer. The seismic refraction method delineated two layers, with the result of the allowable bearing capacity ranging between 0.092 and 0.593 MPa, the ultimate bearing capacity varied from 0.369 to 2.298 MPa while the result of the liquefaction potential varied between 0.533 and 1.237. In all, it was observed that the second layer is more competent than the first layer. Furthermore, regression equations were derived for both geotechnical parameters in order to directly derive the geotechnical parameters from the compressional wave velocities. The results obtained correlated with the results of standard geotechnical investigations carried out, which implies that the competence of any site having the same geological formation could be determined using the same approach.
PUBLIC INTEREST STATEMENT
The recent cases of building collapse have become a concern to both the Government and the stakeholders in the building industry. This is because of the number of lives that are lost and the resources that are wastes in the process. One factor that often prevents building contractors from carrying out geotechnical surveys before embarking on building construction is the cost. This study has made effort to use seismic refraction method to characterize the area of study. The result obtained was correlated with borehole data, which presented the depth to the most competent layer in the study area to be at the depth between 7 and 15.4 m into the subsurface. This approach is much faster, cheaper, environmental friendly and provided wider coverage of site investigation than the conventional geotechnical method. The results obtained was used to develop models that could relate p-wave velocities with some interested geotechnical parameters.
1. Introduction
The difficulty, delay and high expenses, involved in conducting a geotechnical investigation are few of the factors that discourage many building developers from carrying out site characterization. These have made many private developers carry out various construction projects without undertaking proper site investigation (Abudeif, Raef, Abdel Maneim, Mohammed, & Farrag, Citation2017; Adewoyin, Joshua, Akinwumi, Omeje, & Joel, Citation2017). One of the consequences of this is its significant contribution to the incessant building collapse experienced in many developing countries. An attempt to simplify, reduce the cost and reliably estimate the geotechnical parameters needed for proper foundation design will be a major contribution to the field of geotechnical engineering. Using geophysical techniques to predict the required geotechnical parameters has the potential to make this contribution. Typically, the results of geotechnical tests are for point measurements but geophysical investigation techniques can give volumetric measurement and produce an image of the subsurface without physically disturbing the subsoil (Mohd, Rosli, Fauziah, Devapriya, & Mohamed, Citation2012).
Geophysical technique such as seismic refraction method has the potential to provide a quick test, to characterize and model a site and recommend regions recommended for detailed geotechnical investigation when employed (Atat, Akpabio, & George, Citation2013; Lucas, Frankhauser, & Springman, Citation2017). Many geo-mechanical parameters of the subsurface soils can be adequately characterized by the propagation of elastic waves in soil deposits. Many soil properties may be obtained by the use of seismic wave method; such properties include elastic properties and shear strength (Bery & Saad, Citation2012; Fitzallen, Citation2012).
Studies have shown that both P- and S-waves are affected differently by changes in saturation, porosity, or elastic moduli (Nastaran, Citation2012; Pegah & Liu, Citation2016; Sayeed, Adel, & Abd El-Aal, Citation2007; Tezcan, Ozdemir, & Keceli, Citation2009). Salem (Citation2000) deployed both P-wave and S-wave velocities to estimate the Poisson’s ratio of unsaturated natural soil deposits. Hunter et al. (Citation2002) relied on seismic wave velocities to understand the ground motion response of thick soil sites. Michael and Rucker (Citation2006) revealed that seismic wave methods could provide effective shallow subsurface characterization for geotechnical engineering applications. Ozener (Citation2012) estimated the residual shear strength of liquefied soil deposits based on the shear wave velocities. Altindag (Citation2012) studied the relationship between p-wave velocity and mechanical properties of sedimentary rocks. He used an already acquired data and simple regression analysis. All the data were later subjected to multi-regression analysis. He also derived some empirical equations with high correlation coefficients which would be useful for rock engineers (Soupios, Papazachos, Vargemezis, & Fikos, Citation2005). The compressional wave is the only wave that is paramount in this study. In order to determine the zones of structural weakness in the basement and analyze the stability of the subsurface and obtain the mechanical properties of rocks, there will be need to evaluate seismic velocities, Vp and Vs obtained during the field survey (Uyanik, Citation2010). In this study, near-surface seismic refraction method was used to generate mathematical equations that could be used to determine the geotechnical parameters of a site prior construction.
1.1. Geology and location of the study area
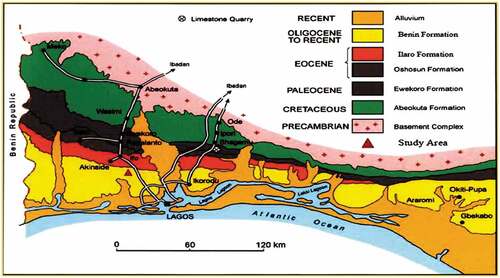
The area under investigation lies within a part of the geologically termed alluvium deposits of Southwestern Nigeria Basin, which is an integral part of the Dahomey embayment (Figure ). The superficial materials of the general area under investigation are silts, sands and clays with fibrous peat at the surface in some places. The vegetation at the study area has given way to fens and other water-loving shrubs and herbs (Adegbola & Badmus, Citation2014). The study area lies between latitude 060 26ʹ N and 060 32ʹ N and longitude 030 35ʹ E and 030 45ʹ E in Lagos Island area of Lagos State. The choice of Lagos Island as the study area is based on the fact that most part of this area is reclaimed from water using sand. The Nigeria coastal zone is within the tropical climate area which has two seasons: the rainy season and the dry season. The rainy season is between April and November, while the dry season is between December and March. The amount of annual rainfall varies between 2030 and 2540 mm (Obasi & Ikubuwaje, Citation2012).
Figure 1. Geological map of Nigeria, showing the Nigerian part of the Dahomey basin (Aizebeokhai and Oyeyemi, Citation2014)
2. Methodology
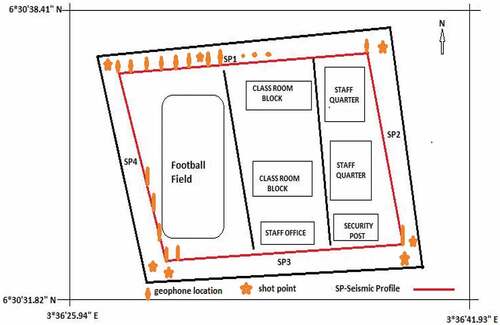
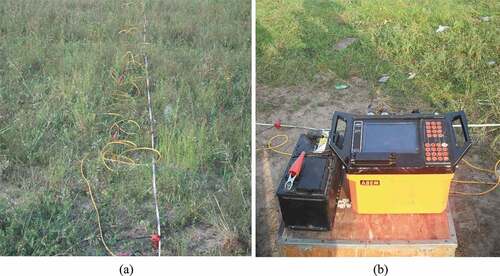
Seismic refraction method was carried out, using a 24-Channel ABEM Terraloc Mark 6 seismogram (ABEM Instrument, Citation1996). This method requires the following for its functionality; 12V-DC Battery, a roll of trigger cable, 2 seismic cable reels, a 15 kg sledge hammer, a metal base plate, 24 geophones of 14 Hertz frequency, a log book and measuring tapes. Four traverses were marked forming a square shape (Figure ). The geophones were planted at 2 m interval to each other and then connected to the equipment. Along a single traverse that ranged between 100 and 150 m in length, due to accessibility, the geophones were planted on every 50 m length on each profile and later transferred to the remaining portion of the profile. This implies that measurements were taken in multiples of 50 m. The length of the traverses ranged between 100 m and 150 m. The geometry used for the data acquisition consisted of five shots taken at different positions between the geophones and at 2 m off each end of the spread. The first shot was taken at a position 2 m from the 1st geophone, between the 6th and the 7th geophones, also between the 12th and 13th geophones, similarly in the midst of the 18th and 19th geophones and finally 2 m after the 24th geophone. The same procedure was repeated across the length of the profile until the desired length is covered.
Figure 2. Base map of the study area
Plates 1: Image of the (a) array of geophones and (b) seismogram with a power source
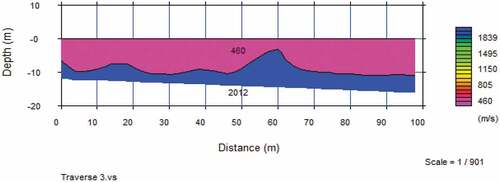
The p-wave energy source was a 15 kg sledge hammer (Adewoyin et al., Citation2017). SeisImager software was used to produce the 2D seismic image of the data collected (Figure ). Each traverse showed two geological layers with the topmost layer being characterized with low p-wave velocities which may be as a result of the loose and soft nature of the soil. The second layer, on the other hand, showed materials of relatively higher velocities which may be due to saturation and compression of the material in the subsurface. The significant change noticed in the elastic properties of the two layers may be due to change in the composition of the subsurface, uneven saturation and changes in the unit weight of the soil.
Figure 3. 2D seismic refraction image of the study area, indicating the number of layers, p-wave velocity of each layer and depth of investigation
3. Results and discussion
The results obtained are presented as follows. Two geologic layers were delineated by the SeisImager software (Abudeif et al., Citation2017; SeisImager, Citation2009). The depth of investigation varied from the topsoil to a depth of about 15 m in the subsurface. The limitation in the depth of coverage could be as a result of the energy source that was used or the length of profile deployed. Some theoretical models were used to determine some of the geotechnical parameters, such as the bulk density, ultimate bearing and allowable bearing capacities, considered in this study (Tezcan et al., Citation2009; Fitzallen, Citation2012; Atat et al., Citation2013). The first geologic layer has the lower seismic wave velocity while the second geologic layer has the higher seismic wave velocity. The bulk density of the first layer ranged between 1708.8 and 1745.7
while the bulk density of the second layer varied between 1752.7
and 2043.3
. This result showed that the second layer is more compressed than the first layer. This may be as a result of the geologic composition of the soil, it could also be as a result of the level of saturation and level of cementation of this geologic formation. It was also observed that the density of the subsurface increased in direct proportion with the seismic wave velocity and these two parameters were noted to increase with depth.
The ultimate bearing capacity and the allowable bearing pressure were estimated alongside the results provided by the elastic moduli. The ultimate bearing capacity for the study area was noted to vary between 0.3674 and 0.5575
while it ranged between 0.5941
and 2.3699
in the second layer. This showed that the second layer could have more bearing capacity than the first layer. Also, the allowable bearing pressure ranged between 0.0919
and 0.1394
in the first layer while it ranged between 0.1485
and 0.5925
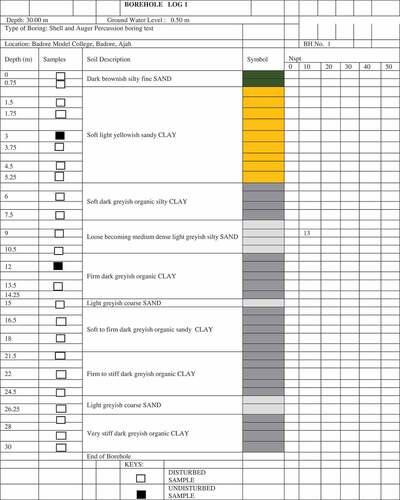
in the second layer. The result also showed that the second layer is more competent than the first layer. Furthermore, the result of the liquefaction potentials of the study area was discovered to vary between 0.533 and 0.649 in the first layer while it ranged between 0.669 and 1.237 in the second layer. This result revealed that the first layer has higher liquefaction potential than the second layer, although, there are some parts of the second layer that are also prone to liquefaction, which could be as a result of the variation in the thickness/depth of the first layer as shown in Figure . The result of the seismic refraction method correlated with that of the borehole dug in the study area (Figure ). From the two data, it could be inferred that the depth to the most competent layer ranged between 7 m and 15.7 m. This result is in agreement with the results obtained from the borehole log and the cone penetrometer tests earlier conducted in the study area.
Figure 4. Result of the Borehole log obtained in the area of study
This study went further to obtain model equations from the correlations of the primary wave velocities and the different geotechnical parameters studied (Atat et al., Citation2013; Tezcan et al., Citation2009). This is to obtain direct relationships between the p-wave velocity and the geotechnical parameters. These equations could be used for speedy evaluation and inexpensive estimation of the various geotechnical parameters. The graphs of the geotechnical parameters were plotted against the primary wave velocity. The regression equations and their coefficient of determinations were obtained. Also, the graph of ultimate bearing capacity was plotted against the primary wave velocity (Figure ) and the correlation equation is given as
Figure 5. The graph of ultimate bearing capacity (MPa) against primary wave velocity (m/s)
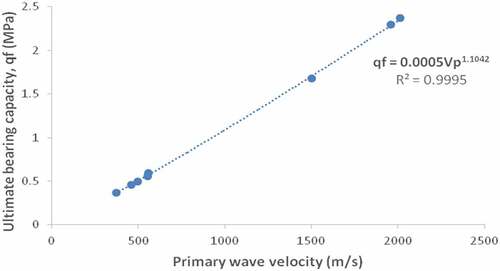
The correlation coefficient obtained for this relation is 0.9995.
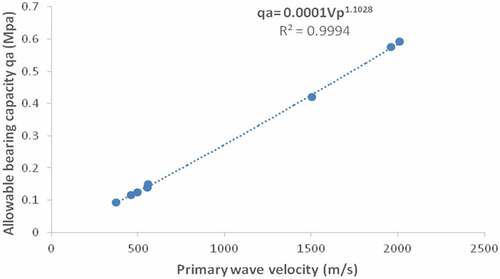
The correlation equation derived from the graph of allowable bearing capacity versus the primary wave velocity (Figure ) is, with a correlation coefficient of 0.9994.
Figure 6. The graph of allowable bearing pressure (MPa) against primary wave velocity (m/s)
In a similar vein, the graph of liquefaction potentiality was plotted against the primary wave velocity as presented in Figure . The correlation equation derived was found to be
Figure 7. The graph of liquefaction potentiality against primary wave velocity
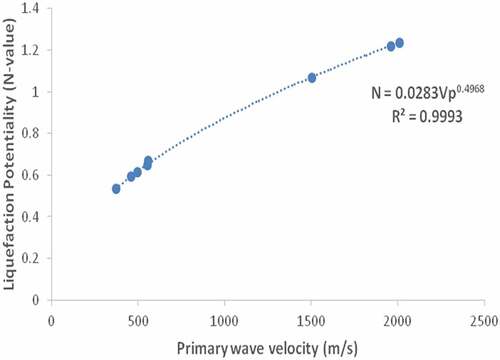
The estimated correlation coefficient, in this case, was found to be 0.9993.
4. Conclusion
Geophysical survey was carried out using seismic refraction method, the results obtained were correlated with the results from other geotechnical methods. The results of the seismic refraction method revealed two geologic layers with the values of bulk density, ultimate bearing capacity and allowable bearing potential greater in the second layer than in the first layer making the second layer more competent. The results of the geotechnical method also confirmed the result obtained from the seismic refraction method. There was a correlation between the depths of competence delineated by the seismic refraction method and the borehole data obtained in the study area. Also, equation models that related both the p-wave velocities with other geotechnical parameters in the area of study were developed. This approach could ease the process of site characterization of the subsurface condition of the study area. Furthermore, the empirical equations obtained can be used to evaluate and predict the geotechnical parameters of a site, when information on the p-wave velocity is available. This study presents an approach that has the potential to reduce the cost of geotechnical investigations and also protect our environments from the destruction caused by the invasive nature of geotechnical equipment.
Cover Image
Source: Author.
Acknowledgements
The authors wish to appreciate the management of Covenant University for providing financial support for this research work.
Additional information
Funding
Notes on contributors
Adewoyin Olusegun Oladotun
Adewoyin Olusegun Oladotun The authors are a group of young and dynamic researchers with common interest in conducting researches on subjects that directly affect man. They have published articles in different areas that are related to human safety and environment. The authors conducted this research in order to proffer solution to the untold hardship and risk people are exposed to as a result of building collapse in Nigeria. Other than geotechnical studies carried out in this article, the authors have also conducted researches in various areas of human concern such as, water contamination and remedy, heavy metal content in commonly consumed food items and the radionuclide contents in building tiles. The authors will always be committed to a safe environment and a quality life for all.
References
- ABEM Instrument AB. (1996). Equipment Manual for TERRALOC MK6 Software Version 2.21. Bromma, Sweden.
- Abudeif, A. M., Raef, A. E., Abdel Maneim, A. A., Mohammed, M. A., & Farrag, A. F. (2017). Dynamic geotechnical properties Evaluation of a candidate nuclear power plant site (NPP): P-and S-waves seismic refraction technique, North Western Coast, Egypt. Soil Dynamics and Earthquake Engineering, 99, 124–10. doi:10.1016/j.soildyn.2017.05.006
- Adegbola, R. B., & Badmus, O. G. (2014). Estimation of shear wave velocity for near-surface characterization: Case study Ifako/Gbagada area of Lagos State, S.W. Nigeria. British Journal of Applied Science and Technology, 4(5), 831–840. doi:10.9734/BJAST/2014/6841
- Adewoyin, O. O., Joshua, E. O., Akinwumi, I. I., Omeje, M., & Joel, E. S. (2017). Evaluation of geotechnical parameters using geophysical data. Journal of Engineering Technology Science, 49(1), 95–113. doi:10.5614/j.eng.technol.sci.
- Aizebeokhai, A. P., & Oyeyemi, K. D. (2014). Application of Geoelectrical Resistivity Imaging and VLF-EM for Subsurface Characterization in a Sedimentary Terrain, Southwestern Nigeria. Arabian Journal of Geosciences.
- Altindag, R. (2012). Correlation between P-wave velocity and some mechanical properties for sedimentary rocks. The Journal of the Southern African Institute of Mining and Mettalurgy, 112, 229–237.
- Atat, J. G., Akpabio, I. O., & George, N. J. (2013). Allowable bearing capacity for shallow foundation in Eket Local Government area, Akwa Ibom State, Southern Nigeria. International Journal of Geosciences, 4, 1491–1500. doi:10.4236/ijg.2013.410146
- Bery, A. A., & Saad, R. (2012). Correlation of seismic p-wave velocities with engineering parameters (N value and rock quality) for tropical environmental study. International Journal of Geosciences, 3, 749–757. doi:10.4236/ijg.2012.34075
- Fitzallen, A. (2012). An improved approach to site characterization combining geophysical and geotechnical data. Australian Geomechanics, 45(1), 77–88.
- Hunter, J. A., Benjumea, B., Harris, J. B., Miller, R. D., Pullan, S. E., Burns, R. A., & Good, R. L. (2002). Surface and downhole shear wave seismic methods for thick soil site investigations. Soil Dynamics and Earthquake Engineering, 22, 931–941. doi:10.1016/S0267-7261(02)00117-3
- Lucas, D. R., Frankhauser, K., & Springman, S. M. (2017). Application of geotechnical and geophysical field measurements in an active alpine environment. Engineering Geology, 219, 32–51. doi:10.1016/j.enggeo.2016.11.018
- Michael, L., & Rucker, P. E. (2006). Integration seismic refraction and surface wave data collection and interpretation for geotechnical site char acterization. In Geophysics 2006: Conference on applied geophysics. Missouri, USA.
- Mohd, H. Z. A., Rosli, S., Fauziah, A., Devapriya, C. W., & Mohamed, F. T. B. (2012). Seismic refraction investigation in near surface landslides at the Kindasang area in Sabah, Malaysia Sciverse Science Direct. Procedia Engineering, 50, 516–531.
- Nastaran, S. (2012). Correlation between geotechnical and geophysical properties of soil. A thesis submitted in partial fulfilment of the requirement of Birmingham University for the degree of Master of Philosophy. Stoke-on-trent: University of Birmingham.
- Obasi, R. A., & Ikubuwaje, C. O. (2012). Analytical study of rainfall and temperature trend in catchment States and stations of the Benin-Owena River basin, Nigeria. Journal of Environment and Earth Science, 2(3), 9–21.
- Ozener, P. (2012). Estimation of residual shear strength ratios of liquefied soil deposits from shearwavevelocity. Earthquake Engineering and Engineering Vibration, 11(4), 461–484. doi:10.1007/s11803-012-0134-0
- Pegah, E., & Liu, H. (2016). Application of near-surface seismic refraction tomography and multichannel analysis of surface waves for geotechnical site characterizations: A case study. Engineering Geology, 208, 100–113. doi:10.1016/j.enggeo.2016.04.021
- Salem, H. S. (2000). Poisson’s ratio and the porosity of surface soils and shallow sediments, determined from seismic compressional and shear wave velocities. Geotechnique, 50(4), 461–463. doi:10.1680/geot.2000.50.4.461
- Sayeed, S. R. M., Adel, M. E. M., & Abd El-Aal, A. K. (2007). Applicability of near surface seismic refraction technique to site characterization of south Marsa Matrouh and Sedi Abd El-Rahman, Western desert, Egypt. Journal of Applied Geophysics, 6(2), 77–85.
- SeisImager. (2009). SeisImager/2DTM Manual Version 3.3
- Soupios, P. M., Papazachos, C. B., Vargemezis, G., & Fikos, I. (2005). Application of seismic methods for geotechnical site characterization. In International workshop in geoenvironment and geotechnics (pp. 1–7).
- Tezcan, S. S., Ozdemir, Z., & Keceli, A. (2009). Seismic technique to determine the allowable bearing pressure for shallow foundations in soils and rocks. Acta Geophysica, 57(2), 1–14. doi:10.2478/s11600-008-0077-z
- Uyanik, O. (2010). Compressional and shear wave velocity measurements in unconsolidated top-soil and comparison of the results. International Journal of the Physical Sciences, 5(7), 1034–1039.