
Abstract
Communication triggered for cell survival/apoptosis is achieved by three different input proteins. In this paper, we have considered the heat map image that shows 11 different proteins for the HT carcinoma cells which helps in cell survival/apoptosis. Based on the introduction and integration of an algorithm in the classification model, feature selection was divided into three main categories namely: filtering method (FM), wrapper method (WM), and Embedded Method (EM). After applying the feature selection (FS) algorithm, we obtained 7 different marker proteins but out of these proteins, this paper concentrates on only one of them, the AkT which is used for classification using k-nearest neighbour (kNN) classifier and support vector machine (SVM) classifier for calculating predicted mean, standard deviation ratio, and correlation. For kNN, we have used different distance approaches (Euclidean, city block), while for SVM, linear, polynomial, RBF and sigmoid kernels are used for Tier 1 and Tier 2. Results with linear Tier 1 using SVM and Euclidean distance outperform other methods. An accuracy of 76.9% and 84.6% was obtained using the kNN and SVM classifiers respectively with GLDS features. The results obtained gave a better performance when compared with the result of other research papers.
PUBLIC INTEREST STATEMENT
Communication triggered for cell survival/apoptosis is achieved by three different input proteins. Apoptosis is a process in which an organ, tissue or organism which is made up of many cells intentionally decides to die while a necrosis is a process in which a cell dies due to deprivation or trauma. This paper presents the study of different feature selection algorithms, namely: filter method, wrapper method and embedded method. We have applied feature selection on HT carcinoma cells. Out of 11 proteins, 7 proteins were selected using wrapper method while we only considered the AkT protein. Furthermore, we classified AkT using SVM (linear, polynomial, RBF and sigmoid functions for Tier 1 and Tier 2) and kNN. Using the Euclidean distance approach for kNN and linear Tier 1 approach for SVM, the classification performance for GLDS features was calculated giving an accuracy of 76.9% and 84.6% respectively.
1. Introduction
The process of programmed cell death or apoptosis is generally characterized by distinct morphological characteristics and energy-dependent biochemical mechanisms. Apoptosis is a process in which an organ, tissue or organism which is made up of many cells intentionally decides to die while a necrosis is a process in which a cell dies due to deprivation or trauma. For the induction of apoptosis, there are two main mechanisms: leakage of cytochrome c and parallel apoptotic cascade. Leakage of cytochrome c is due to the perturbation of mitochondria that leads to activation of apoptosis while parallel apoptotic cascade is due to the activation of family of death receptors. Pro-apoptotic agents induce their effects through the mitochondrial pathway. Ced-3, Ced-4, and Ced-9 are the three proteins which occur at the core of the mitochondrial pathway.
Inappropriate apoptosis (either too little or too much) is a factor in many human conditions including ischaemic damage, neurodegenerative diseases, autoimmune disorders and many types of cancer.
Cancer progression results from complex and still riddling myriad of pathological and physiological events. Among them, the ability to matrix barriers, break tissues and establish growing masses within normal tissues represent the most fundamental characteristics of dissemination. Such a spread causes the vast majority of mortality and morbidity from cancer/tumours. There are different types of tumours which can occur in different parts of the body. Breast cancer, lung cancer, brain cancer are some common types. The study of cancer gives multidimensional data.
Multidimensional data consist of various features, where several features in the dataset may not be useful for classification in Machine Learning (Daelemans, Hoste, De Meulder, & Naudts, Citation2003; Dey, Citation2016; Guyon & Elisseeff, Citation2003). The technique which helps in reducing a large set of features by selecting effective features and discarding the redundant features from the original dataset is called Feature selection (FS)/Feature subset selection (FSS) (Blum & Langley, Citation1997; Nixon, Citation2008). The final output or classification performance is dependent on the selected feature(s). This is the reason FS is mostly used as a pre-processing technique for classification. FSS plays a lead role in the area of data mining and machine learning (ML). An FSS algorithm considers feature interaction and efficiently removes redundant and irrelevant features. This approach leads to an improvement in the performance of a learner by interpretability of the learning model and enhancing the generalized capacity. It can also lead to an understanding of the data. Efficient FSS algorithms help to increase accuracy rate and reduce the cost and run time while searching for multidimensional data (Salau, Yesufu, & Ogundare, Citation2019). FS and feature engineering are the main steps in ML (Ayodele, Citation2010; Bonaccors, Citation2017). Data which are correlated do not provide much information. It is important to understand the dataset so as to know the algorithm which can be used to minimize features so as to get the best.
In conventional programming (CP), the user is unable to improve the data continuously, thus making it very difficult to perform any task. In CP, data and the program are the inputs to the computer which produce an output. Industrial technology (IT) revolution has changed our lives in so many ways. A machine is considered useful and will be continuously improved if its users can easily understand what tasks it can complete with less effort or complete automatically. This is exemplified by the concept of machine programming (MP). In MP, we know the input and output, and based on this we will obtain a program with the help of different algorithms using a computer. For CP and MP, there are two types of system, namely, non-adaptive system and adaptive system. In the generic representation of non-adaptive systems, input values are received and processed to produce an output as shown in Figure (Bonaccors, Citation2017). On the other hand, the adaptive system is not based on static or permanent structures (model parameters and architectures) but rather on a continuous ability to adapt its behaviour to external signals (datasets or real-time inputs) like human being, to predict the future using uncertain and fragmentary pieces of information as shown in Figure (Bonaccors, Citation2017).
Figure 1. Non-adaptive system
Figure 2. Adaptive system
Cell survival/apoptosis are the two possible outputs which are obtained from the cell by capturing the information of the processed input signal. This paper, examines the signalling model which controls the survival/apoptosis decisions with the combination of pro-survival proteins epidermal growth factor (EGF) and insulin (Jain, Citation2012, Citation2018a, Citation2018b) and pro-apoptotic proteins, tumour necrosis factor-α (TNF) (Jain, Citation2012, Citation2016). There are 10 different combinations of TNF, EGF and insulin whose values are expressed in ng/ml. Firstly, the best proteins were selected by feature selection techniques. Later, we have discussed different classifier techniques, namely, the kNN (using different distance approaches like Euclidean, city block and chebyshev) and SVM (linear, polynomial, RBF and sigmoid functions for Tier 1 and Tier 2) for best-selected protein AkT. AkT promotes cell survival and glycogen synthesis. AkT can lead to cell survival when different proteins consisting of FKHR, Bad and caspase 9 are absent while it can also lead to cell survival when different proteins consisting of Bad, NFκB and CREB are present (Jain & Chauhan, Citation2015).
Section 2 gives a review of the different FS algorithms. Section 3 explains our proposed approach in detail and therein we discuss the results obtained from the analysis of AkT protein using SVM and kNN classifier and in Section 4, we conclude the paper.
Table presents a review of related works.
Table 1. Review of literatures
2. Feature selection algorithms
For eliminating variables in an image, we have mainly two different methods, namely: the filter method (FM) and wrapper method (WM) (Kohavi & John, Citation1997). FM is basically a pre-processing technique which is used to get the best attributes. In this approach, highly ranked attributes are preferred and used as predictors while in WM, predictors are wrapped into a search algorithm that chooses a subset which assigns the highest predictor attainable (Jantawan & Tsai, Citation2014; Kumari & Swarnkar, Citation2011; López et al., Citation2009). Exhaustive search methods find it difficult to locate data from large datasets; that is why evolutionary algorithms like genetic algorithm (GA) and particle swarm optimization (PSO) or sequential search algorithms have been proposed which give good results and are easy to implement. In Bryll, Osuna, and Queka (Citation2003), WM is classified into Heuristic search algorithms and sequential selection algorithms. Based on the integration of algorithms in the classification model, FSS is divided into three main parts: FM, WM and Embedded Method (EM) (Murcia, 2017).
2.1. Filtering methods (FM)
FM is positioned for the calculation of an attribute appositeness score (AS) of the data. This process is done before any intercommunication with the classification model shown in Figure (Murcia, 2017). The AS is used for sorting the various features, out of which some features whose scores are low are rejected. There are two types of techniques/approaches for AS which can be used: the Univariate (UV) and Multivariate (MV). For UV approach, AS is evaluated individually for each feature while in MV approach, communication between different features is being developed, although they are gradual and less adaptable than the aforementioned techniques. UV methods encompass-Test, χ2, Fisher’s Discriminant Ratio (FDR) (different Hypothesis testing), Mutual Information, Euclidean Distance, Correlation, etc., while MV methods comprise correlation-based approaches or Analysis of Variance (ANOVA).
Figure 3. Filtering method
2.2. Wrappers method (WM)
WM particular score is deputed to every feature shown in Figure (Murcia, 2017). This score helps in choosing the most useful and powerful feature, but the score is usually an estimation of the features in the chosen predictive model (PM). PM are those which predict the outcomes. There are different types of PM which include SVM, random Forest, Boosted trees, CART, MARS, Neural Network, AVAS, OLS, GLM, and Logistic Regression.
Figure 4. Wrapper method
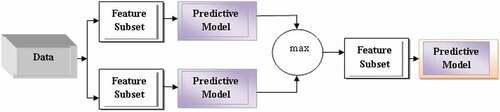
There are different steps used for WM which consists: Search Algorithm (SA), Ensemble Learning Algorithm (ELA) and Evaluation as shown in Figure .
Search Algorithm (SA): There are different SA which are listed as follows (Wang et al., Citation2013):
Sequential forward search (SFS)/Forward selection (FoS): This sequentially adds the features in the empty set so as to result in the best function of an actual feature set.
Sequential backward search (SBS)/Backward elimination (BE): This sequentially eliminates the features from the full set. The result is the smallest value of the function from the actual feature set.
Bi-direction search (BiS): This is the parallel implementation of SBS and SFS. It explores the attributes in the said directions (forward or backward).
Linear search (LS): This is an extended version of the best first search algorithm space for FS. It can be searched with the help of greed hill climbing augmented with backtracking facility.
Genetic search (GS): This is a randomized search approach used for the genetic algorithm (GA). The GA finds the features subset so as to maximize the output function using Natural Evolution Techniques.
Rank search (RS): For ranking the features, feature evaluator is used. As the features are ranked, FS is used to get the ranking list.
Scatter search (SS): This search starts for diverse and significant features and stops when the score/criteria is more than a given threshold value.
Interactive search (IS): This search considers the interaction between the features so as to maximize the target function.
Stepwise search (SWS): This search is a modification of SFS. As the name suggests, this approach is applied at each step of search in which features can be deleted without affecting the output function.
Tabu search (TS): This search is used for optimization problems. It is a responsive exploration approach which uses an adaptive memory by linking a local search process with an anti-cycling memory-based rule to avert trapping in locally optimal solutions.
Ranker: In this search, features are evaluated separately and later each feature is ranked on the basis of evaluation parameters.
FCBF search: In this search, features are evaluated with redundancy and relevant analysis. The result of this analysis helps in choosing the features.
Out of these numerous search algorithms, the most commonly used algorithms are SFS, SBS, and Evolutionary Algorithm (EA). Apart from SFS and SBS, other widely known WM include GA, and the expectation-maximization algorithm (EMA).
Ensemble Learning Algorithm (ELA): Multiple Learning Algorithms (LAs) are used in machine learning ensemble technique and statistics ensemble technique to get remarkable results in comparison with the use of individual learning algorithms. Ensemble methods are techniques which are made up of multiple models and later combine all of them to get better results. An ensemble is also a supervised learning algorithm because we can train and use for making predictions. There are different types of LAs which we have summarized in (a)–(g).
Bayes optimal classifier (BOC)
Bootstrap aggregating (bagging): Every model in the ensemble are assigned with the same weight. This approach is also known as Bagging. Every model in the ensemble is trained by bagging using an arbitrarily drawn subset of the training, so as to promote model variance. Random forest algorithm couples random decision tree with bagging so as to attain high accuracy.
Boosting: In boosting, the ensemble is built incrementally by training each new model which emphasize the training instance that previous models are classified. In general, one of the commonly used boosting algorithms is AdaBoost. Boosting algorithms show better accuracy than bagging algorithms, but also leads to an overfitting of the training data.
Bayesian parameter averaging (BPA): BPA is a technique which approximates the BOC by sampling and combining it using Baye’s law. This technique can also be implemented practically. Unlike the BOC, Bayesian model averaging (BMA) can be practically implemented.
Bayesian model combination (BMC): This is a corrected version of BPA. BMC samples the data from the space of possible ensembles instead of sampling each model individually. This change affects the habit of BMA to assemble, giving all the weight to a single model. This technique is more expensive than BMA. Better results are obtained using this technique than in comparison with BMA and bagging.
Bucket of models (BOM): In this technique, the model selection algorithm (cross-validation) is used to get a better model for every problem. When used with different problems, BOM produces better results but does not produce a better result than the best model in the set when only one problem is tested.
Stacking stacked generalization: This involves training of LA so as to combine the predictions of other LAs. In this technique, other algorithms are trained using the available data. Later a combining algorithm is trained to get a final forecast using all indicators of the alternative algorithm.
Evaluation: Based on different measures different learning algorithms are taken into consideration during evaluation:
Inductive/Supervised learning—Training data includes desired outputs. In inductive learning, training includes the desired output. Mainly this type of learning deals with classification. Common supervised learning applications include:
Predictive analysis based on regression or categorical classification
Spam detection
Pattern detection
Natural Language Processing
Sentiment analysis
Automatic image classification
Automatic sequence processing (for example, music or speech)
Unsupervised learning—This technique is used as clustering and feature extraction. Other important techniques involve the use of both labelled and unlabeled data. Commons unsupervised applications include:
Object segmentation (for example, users, products, movies, songs, and so on)
Similarity detection
Automatic labelling
Semi-supervised learning—In this learning approach training data includes only a few desired outputs. The semi-supervised technique can be adopted when it is necessary to categorize a large amount of data with a few complete (labelled) examples or when there is the need to impose some constraints to a clustering algorithm.
Reinforcement learning—This learning is based on feedback provided by the external sources. In this learning, information is more qualitative. Reinforcement learning is efficient when the environment is not completely deterministic, impossible to have a precise error measure and very dynamic.
Figure 5. Flowchart showing the wrapper method
In several papers, Naive Bayes and Decision tree approach are frequently used for evaluation. Various sub-techniques/algorithms for SA, LA and evaluation for WM are listed in Table .
Table 2. Algorithms used for wrapper method
2.3. Embedded method (EM)
EM combines the advantages of both FM and WM. In EM, attributes are removed or added from the feature subset during the building and interpolation of the model. EM performs feature selection when the predictive model is built, while wrappers use the space of all the attribute subset (Figure ) (Murcia, 2017). Due to this reason, data is used more efficiently in EM. It also allows the model to get a faster optimal subset. Random forest, decision trees and SVM are some of the main embedded methods. Table explains the pros and cons of the different feature selection algorithms.
Table 3. Explains the pros and cons of the three techniques
Figure 6. Embedded method
3. Proposed methodology
This section, examines and presents a signal network approach for the control of cell survival/apoptosis decisions by capturing information from the cell environment by processing input signals. Signalling networks consist of three proteins, namely: TNF, EGF and insulin. There are 10 different combinations of TNF, EGF and insulin whose values are considered in ng/ml. The processing steps which were followed in this paper are shown in Figure . The steps include: the study of a Heat map which was proposed by Gaudet et al. (Citation2005) using experimentations on HT carcinoma cells, extraction of region of interest (ROIs) (number of combination for TNF, EGF and insulin (10) × for every combination number of iterations (13)), feature selection using the wrapper technique and classification using classifiers such as kNN and SVM.
Figure 7. Block diagram showing the proposed methodology
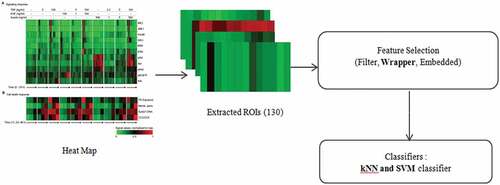
With the help of experimentation on HT carcinoma cells, heat map was obtained. The heat map shows 11 different input proteins, namely, MK2, JNK, FKHR, MEK, ERK, IRS, AkT, IKK, pAkT, ptAkT, EGFR and four outputs. To get an output, the average of all outputs were taken and normalized to maximum. Using wrapper method, we find the best 7 proteins out of which AkT was used for computations. There are different types of classifier techniques out of which we considered the kNN (Euclidean, city block and chebyshev distance approach) and SVM (linear, polynomial, RBF and sigmoid functions for Tier 1 and Tier 2) due to wide range of applications found in literatures (Jain, Citation2017, Citation2018c) for one of the selected proteins (AkT). All the simulations were carried out in Statictica 11 software in Intel core processor, 1 GHz Microsoft system.
3.1. K nearest neighbour (kNN)
The k-NN is a non-parametric method which can be used for regression, distance metric, classification, cross-validation, distance weighing, and k-NN predictions. The value of k can be adjusted which is known as cross-validation. If the value of k is low, then we can overfit the curve while if the value of k is too high, then we can underfit the curve. The main methods for measuring the distance are Chebyshev distance, Euclidean distance, Minkowski distance function and City block/Manhattan distance.
We have calculated predicted mean (PM), standard deviation ratio (SDR), and correlation (COR) (Kohavi & John, Citation1997; Kumari & Swarnkar, Citation2011) for different distance function using k-NN algorithm tabulated in Table . After analysis, we come to know that the Euclidean distance gives the best result. After getting the distance we have calculated the Gray Level Difference Statistics (GLDS) features (contrast, homogeneity, entropy, energy and mean). In total, we have 130 images which were partitioned in training and testing dataset which was followed by applying classification. The confusion matrix is shown in Table which gives an accuracy of 76.9%.
Table 4. k-NN classifier using different functions for AkT
Table 5. Classification performance of the GLDS features using k-NN classifier
3.2. Support vector machine (SVM)
SVM is a supervised learning technique which helps for regression analysis, recognizing patterns, analysing data, and classification. SVM has a number of advantages, i.e. it has different types of kernel functions which are used as decision functions, high dimensional spaces and are versatile. In addition, they can be used where a number of dimensions are larger than the number of samples. The various kernel functions used in this paper are linear, RBF, polynomial and sigmoid. Training an SVM with linear kernel is faster than other kernels because with linear kernel only C- regression parameter optimization is done while with others, γ parameter optimization was used. We have calculated predicted mean (PM), standard deviation ratio (SDR), correlation (COR), for AkT protein for all kernel functions mentioned using SVM algorithm which is shown in Figure .
Figure 8. Anderson values v/s predicted mean, standard deviation ratio and correlation of AkT
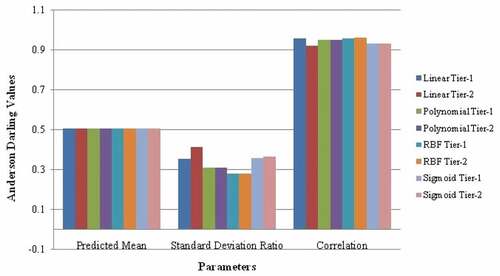
Results with linear Tier 1 show the significant values in terms of correlation, so this approach is used for further analysis. GLDS features were evaluated which were used for classification. Classification performance for GLDS features using SVM classifier yields 84.6% accuracy as tabulated in Table . Table shows the comparison of our work with the existing paper which shows that SVM classifier gave the best result.
Table 6. Confusion matrix for the GLDS features using SVM classifier
Table 7. Comparison of research paper with proposed techniques
An accuracy of 76.9% and 84.6% using kNN and SVM classifier using GLDS features. Our proposed approach gave better results when compared with other research papers as shown in Tables and .
4. Conclusion
This paper presents the study of different feature selection algorithms, namely, filter method, wrapper method and embedded method. We have applied feature selection on HT carcinoma cells. Out of 11 proteins, 7 proteins were selected using wrapper method while we only considered the AkT protein. Furthermore, we classified AkT using SVM (linear, polynomial, RBF and sigmoid functions for Tier 1 and Tier 2) and kNN. Using the Euclidean distance approach for kNN and linear Tier 1 approach for SVM, classification performance for GLDS features were calculated which gave 76.9% and 84.6% accuracy, respectively. In future, we will work towards obtaining the rest 4 proteins.
Cover image
Source: Author.

Additional information
Funding
Notes on contributors
Shruti Jain
Shruti Jain She received a PhD degree in Electronics Engineering from Jaypee University of Information Technology, Waknaghat, Solan, India. She has specialization in Biomedical Signal Processing and Computer-Aided design of FPGA and VLSI circuits, combinatorial optimization, trust and security in VLSI chips and computer systems. She is a member of various professional bodies like IEEE, IAENG. She is a reviewer and member of editorial board of many reputable journals.
Ayodeji Olalekan Salau
Ayodeji Olalekan Salau He received a PhD degree in Electronic and Electrical Engineering from Obafemi Awolowo University, Ile-Ife, Nigeria. His areas of specialization include Computer Vision, Image Processing, Digital Signal Processing, Electric Power Transmission and Distribution Systems and Nuclear Engineering. He is a member of various professional bodies such as IEEE, IAENG and COREN. He has a number of scholarly publications in reputable international journals. He is presently a reviewer for IEEE Transactions on Vehicular Technology and many other reputable journals.
Related Research Data
References
- Ayodele, T. O. 2010. Types of machine learning algorithms. In Y. Zhang Ed. New advances in machine learning. UK: University of Portsmouth. ISBN: 978-953-307-034-6.
- Blum, L. A., & Langley, P. (1997). Selection of relevant features and examples in machine learning. Artificial Intelligence, 97(1), 245–14. doi:10.1016/S0004-3702(97)00063-5
- Bonaccors, G. (2017). Machine learning algorithms. Birmingham, Mumbai: Packt Publishing.
- Bryll, R., Osuna, R. G., & Queka, F. (2003). Attribute bagging: Improving accuracy of classifier ensembles by using random feature subsets. The Journal of Pattern Recognition Society, 36, 1291–1302. doi:10.1016/S0031-3203(02)00121-8
- Chandrashekar, G., & Sahin, F. (2014). A survey on feature selection methods. Computer and Electrical Engineering, 40, 16–28. doi:10.1016/j.compeleceng.2013.11.024
- Daelemans, W., Hoste, V., De Meulder, F., & Naudts, B. (2003). Combined optimization of feature selection and algorithm parameters in machine learning of language. In N. Lavrač, D. Gamberger, H. Blockeel, & L. Todorovski (Eds.), Machine learning: ECML 2003. Lecture notes in computer science (pp. 2837, 84–95). Berlin, Heidelberg: Springer.
- Dey. (2016). Machine learning algorithms: A review. International Journal of Computer Science and Information Technologies, 7(3), 1174–1179.
- Gaudet, S., Kevin, J. A., John, A. G., Emily, P. A., Douglas, L. A., & Peter, S. K. (2005). A compendium of signals and responses triggered by pro-death and pro-survival cytokines. Molecular & Cellular Proteomics, 4(10), 1569–1590. doi:10.1074/mcp.M500158-MCP200
- Guana, D., Yuana, W., Leea, Y. K., Najeebullaha, K., & Rasela, M. K. (2014). A review of ensemble learning based feature selection. IETE Technical Review, 31(3), 190–198. doi:10.1080/02564602.2014.906859
- Guyon, I., & Elisseeff, A. (2003). An introduction to variable and feature selection. Journal of Machine Learning Research, 3, 1157–1182.
- Jain, S. (2012). Communication of signals and responses leading to cell survival/cell death using Engineered Regulatory Networks. ( PhD Dissertation). Jaypee University of Information Technology, Solan, Himachal Pradesh, India.
- Jain, S. (2016). Compedium model using frequency/cumulative distribution function for receptors of survival proteins: Epidermal growth factor and insulin. Network Biology, 6(4), 101–110.
- Jain, S. (2017). Parametric and non-parametric distribution analysis of AkT for cell survival/death. International Journal of Artificial Intelligence and Soft Computing, 6(1), 43–55. doi:10.1504/IJAISC.2017.084232
- Jain, S. (2018a). System modeling of AkT using linear and robust regression analysis. Current Trends in Biotechnology and Pharmacy, 12(2), 177–186.
- Jain, S. (2018b). Classification of protein kinase b using discrete wavelet transform. International Journal of Information Technology, 10(2), 211–216. doi:10.1007/s41870-018-0090-7
- Jain, S. (2018c). Detection of Arrhythmia using automatic differentiation method. International Research Journal of Natural and Applied Science, 5(7), 9–24.
- Jain, S., & Chauhan, D. S. (2015). Mathematical analysis of receptors for survival proteins. International Journal of Pharma and Bio Sciences, 6(3), 164–176.
- Jantawan, B., & Tsai, C. F. (2014). A comparison of filter and wrapper approaches with data mining techniques for categorical variables selection. International Journal of Innovative Research in Computer and Communication Engineering, 2(6), 4501–4508.
- Kohavi, R., & John, G. (1997). Wrappers for feature subset selection. Artificial Intelligence, 97(12), 273–324. doi:10.1016/S0004-3702(97)00043-X
- Kumari, B., & Swarnkar, T. (2011). Filter versus wrapper feature subset selection in large dimensionality micro array: A review. International Journal of Computer Science and Information Technologies, 2(3), 1048–1053.
- Lee, S., Schowe, B., & Sivakumar, V. (2011). Feature selection for high-dimensional data with rapid miner (Technical Report). Dortmund, Germany: TU Dortmund University.
- López, M. M., Ramírez, J., Górriz, J. M., Álvarez, I., Salas-González, D., Segovia, F., & Chaves, R. (2009). SVM-based CAD system for early detection of the Alzheimer’s disease using kernel PCA and LDA. Neuroscience Letters, 464, 233–238. doi:10.1016/j.neulet.2009.08.061
- Nixon, M. (2008). Feature extraction and image processing. Orlando, FL: Academic Press.
- Osuna, R. G. (2002). Pattern analysis for machine olfaction: A review. IEEE Sensors Journal, 2, 189–202. doi:10.1109/JSEN.2002.800688
- Ozcift, A., & Gulten, A. (2012). A robust multi-class feature selection strategy based on rotation forest ensemble algorithm for diagnosis. Journal of Medical Systems, 36, 941–949. doi:10.1007/s10916-010-9558-0
- Panthong, R., & Srivihok, A. (2015). Wrapper feature subset selection for dimension reduction based on ensemble learning algorithm. Procedia Computer Science, 72, 162–169. doi:10.1016/j.procs.2015.12.117
- Saeys, Y., Abeel, T., & Peer, Y. V. (2008). Robust feature selection using ensemble feature selection techniques. In W. Daelemans, B. Goethals, K. Morik (Eds.), Machine learning and knowledge discovery in databases, Part II. LNCS (LNAI) (vol. 5212, pp. 313–325). Heidelberg: Springer.
- Salau, A. O., Yesufu, T. K., & Ogundare, B. S. (2019). Vehicle plate number localization using a modified grabcut algorithm. Journal of King Saud University – Computer and Information Sciences, Elsevier. doi:10.1016/j.jksuci.2019.01.011
- Sanchez-Marono, N., Alonso-Betanzos, A., & Calvo-Estevez, R. M. (2009). A wrapper method for feature selection in multiple class datasets. In IWANN Proceedings of the 10th International Work-Conference on Artificial Neural Networks: Part I: Bio-Inspired Systems: Computational and Ambient Intelligence (pp. 456–463). doi:10.1007/978-3-642-02478-8_57
- Wang, G., Song, Q., Sun, H., Zhang, X., Xu, B., & Zhou, Y. (2013). A feature subset selection algorithm automatic recommendation method. Journal of Artificial Intelligence Research, 47, 1–34. doi:10.1613/jair.3831