
 ?Mathematical formulae have been encoded as MathML and are displayed in this HTML version using MathJax in order to improve their display. Uncheck the box to turn MathJax off. This feature requires Javascript. Click on a formula to zoom.
Abstract
Photovoltaic (PV) systems are one of the most popular technologies to produce electricity from renewable energy, which can efficiently accommodate electricity demand. However, there are some issues occurring at high PV penetration levels in the distribution system. In order to increase the PV penetration level, battery energy storage system (BESS) has been widely integrated with PV systems because it could overcome issues during high PV penetration level and greatly provide optimal energy management. Then, this paper aims to increase the PV penetration level in low voltage (LV) distribution system by installation of BESS. The 41-bus practical radial LV distribution system located in Ratchaburi province, Thailand was focused. The net present value (NPV) was used as an economic indicator indicating the profitability of installing BESS. The optimal sitting, sizing, and operation of BESS yielding the maximum total NPV were determined. Then, the maximum PV penetration level was predicted for 10 case studies. In addition, the method for flattening load profile was appropriately adapted to be used in the LV distribution system. The genetic algorithm (GA) was performed to solve the optimization problem. The results showed that total NPV was increased with increasing the PV penetration level. The PV penetration level of 130% was found to be a suitable value for this particular system, which could provide significant improvement in NPV compared to the conventional system. The optimal BESS sizing and siting including the optimal BESS operation were also demonstrated.
PUBLIC INTEREST STATEMENT
Photovoltaic (PV) systems are one of the most popular renewable energy sources widely used to generate electricity. However, there are some issues occurring when the PV systems are installed beyond the limitation. In order to increase the capacity of PV in the distribution system, the battery energy storage system (BESS) has been widely implemented because it could overcome those issues and provide optimal energy usage. Therefore, this paper aims to increase the number of PV systems in low voltage (LV) distribution system by using an installation of BESS. The optimal sitting, sizing, and operation of BESS yielding the maximum total net present value (NPV) were determined for 10 case studies with different capacities of the PV system. The genetic algorithm (GA) was performed to solve the optimization problem. The results show additional capacity of PV systems, and optimal sitting, sizing and operation of BESS which provides a maximum total NPV.
1. Introduction
Average global electricity demand is obviously increased over the past several decades, and it tends to continually be increased in the future due to economic and population growth (Bortolini, Gamberi, & Graziani, Citation2014; Chaudhary & Rizwan, Citation2018). Currently, the main fuel source used for electrical generation is fossil energy; however, the use of this energy source should be reduced due to climate changes (Höök & Tang, Citation2013). Therefore, renewable energy sources (RESs) are widely utilized to accommodate electricity demand. In 2040, it is predicted that the ratio of electricity produced by RESs will be equivalent to coal and natural gas (The U.S. Energy Information Administration [EIA], Citation2017).
Solar resource is one of the RESs vastly used to generate electricity by PV systems. Nowadays, the installed cost of PV systems has dropped over the last years and they can be installed on land or on the roof as well as floating in the water. Consequently, the PV systems have been increasingly utilized to generate electricity over the past ten years (International Renewable Energy Agency[IRENA], Citation2017). However, the major concern of PV systems is that the PV output could be uncertain since it highly depends on the sunlight. In addition, the PV output is produced only during the daytime. These characteristics of PV systems can cause poor impact on the performance of distribution network, power quality as well as the grid components, such as power fluctuation (Wang, Ciobotaru, & Agelidis, Citation2014), overloading of the grid component (Pezeshki, Wolfs, & Ledwich, Citation2014) and overvoltage (Petinrin & Shaabanb, Citation2016) etc. Especially, these unwanted affectations could indicate a more influential impact on system performance when PV penetration level becomes higher. Therefore, several methods have been proposed to solve those issues when high PV penetration level integrating into the distribution system. For instance, active power curtailment (Tonkoski, Member, Lopes, Member, & El-fouly, Citation2011) and reactive power control (Demirok et al., Citation2011) is proposed to address the overvoltage problem. The ESSs are applied to time-shift the excess energy generated by PV systems to use when high load demand (Yang et al., Citation2014). Furthermore, the automatic generation control (AGC) using ESSs was also proposed to alleviate the frequency and power fluctuation for distribution system with the presence of RESs (Arya, Citation2019a, Citation2019b; Arya & Kumar, Citation2016).
During the past few decades, many methods have been proposed to accommodate the integration of PV systems into the distribution system. In recent years, the ESSs have been intensively studied by many authors to integrate into distribution system with PV systems. This is because many applications of ESSs can enhance the use of RESs in distribution system such as load following and frequency control, loss reduction, smoothing and time-shift, etc. Nonetheless, the ESSs implemented in the distribution networks should meet some specific requirements with the advancement of the high power and high energy density, high efficiency, environmentally friendly and grid-scale batteries (Saboori, Hemmati, Mohammad, Ghiasi, & Dehghan, Citation2017). Thus, the battery energy storage system (BESS) is one type of ESSs to reach those specific requirements. In addition, the useful characteristics of BESS, such as fast response, controllability and geographical independent bring massive attention to BESS over the past years (Yang, Bremner, Menictas, & Kay, Citation2018). However, the major concern of BESS is its high investment cost. Therefore, optimal installation and operation of BESS are required to obtain maximum benefits and minimize the investment cost.
The optimal planning strategies for the implementation of BESS have been widely proposed in several studies. The optimal installation and operation of BESS are frequently determined as well as many applications are applied to obtain maximum the benefits over the planning horizon. The meta-heuristic methods have been extensively known as the effective method for solving the optimal installation and operation of BESS or solving the other planning problem of power system such as genetic algorithm (GA), particle swarm optimization (PSO), artificial bee colony (ABC), Adaptive Shuffled Frogs Leaping Algorithm (ASFLA) etc. (Jamian, Mustafa, Mokhlis, & Baharudin, Citation2014; Lalitha, Reddy, & Usha, Citation2010; Onlam et al., Citation2019; Sardi, Mithulananthan, Gallagher, & Quoc, Citation2017; Zheng et al., Citation2014). In 2016, a bi-level optimization model was proposed to solve optimal siting and sizing of BESS to accommodate the integration of distribution generator (DG) (Xiao, Bai, Zhang, & Liang, Citation2016). Minimizing the total NPV of the distribution network in the project life cycle was an objective function of this paper. The benefits considered in this paper were network losses reduction and profit from load shifting, whereas the costs were salvage value, investment cost, replacement cost, and operation and maintenance cost. The GA was applied to solve this optimization model. In 2017, the intelligent single particle optimizer (IPSO) was adopted to optimize the site, capacity, and strategy of BESS, subject to cost-benefit analysis considering the reliability improvement (Liu, Niu, & Xu, Citation2017). The maximum economic benefit of BESS was determined with optimal planning model. The considered benefits were a reduction of power purchased from upper gird, deferring grid upgrade, environmental benefit and reducing outage loss. The costs were one-time investment cost and operation and maintenance cost. Sardi et al. (Citation2017) considered all possible benefits and costs of implementation of Community Energy Storage (CES) in the distribution system with PV systems. The benefits included energy arbitrage, peak load shaving, energy loss reduction, system upgrade deferral, emission reduction, and VAR support, while the costs included the replacement, investment, and operation and maintenance cost. The optimal siting, sizing, and operation of CES were determined to obtain maximum total NPV. GA was applied to solve this optimization problem. In 2018, GA with linear programming method was proposed to solve optimal siting, sizing and daily charge/discharge of BESS to mitigate the disadvantage of high PV penetration level in the distribution network (Rasol, Sedighi, Savaghebi, & Guerrero, Citation2018). The benefits included energy price arbitrage, environmental emission reduction, energy loss reduction, and transmission access fee. The costs were capital and operation and maintenance cost.
It is obviously seen that optimization of installation and operation of BESS are required for maximizing benefit from the BESS with the integration of PV systems into the distribution system. Many benefits and costs regarding the implementation of BESS have been analyzed in the literature. However, the benefit of construction deferral of a coal-fired power plant and funding to support the customers’ investment of PV systems installation has not been considered yet. Therefore, this benefit will be considered in this paper because it is the basis of the use of BESS providing the energy produced from PV systems is used efficiently and has the same stability as the power plant. Hence, the benefit obtained from this advantage of BESS has to be analyzed. Meanwhile, the funding to support the customers is also analyzed to aid investment and promote the installation of PV systems, which is beneficial to both utility and customers. Furthermore, the strategy for charge and discharge of BESS in this study was proposedly modified to be used in low voltage level based on an iterative method for determining charge and discharge threshold (Sardi et al., Citation2017).
In this paper, the aim is to increase PV penetration level in the LV distribution system by using an implementation of the BESS. To obtain the possible benefits from implementation of BESS, the benefits are considered in this paper including reduction of power purchased from upper gird, system upgrade deferral, reduction in CO2, reactive power support and construction deferral of a coal-fired power plant, whereas the considered costs are capital cost, operation, and maintenance cost, and support fund that is the fund supports the cost of PV systems installation. These benefits and costs that occur in each period are calculated to the same point by inflation and discount rate to identify total NPV. The 41-bus practical radial LV distribution system located in Ratchaburi province, Thailand is focused. Ten case studies with different PV penetration levels are investigated for this study. The optimal installation and operation of BESS are determined for each case aiming at maximum total NPV and then the case provides maximum total NPV is selected as a suitable case. In addition, the GA is applied to solve the optimization problem.
2. Methodology
2.1. Operation strategy of BESS
The strategy for charge and discharge BESS in this work is based on an iterative method which can determine the charge and discharge thresholds of BESS (Sardi et al., Citation2017). The objective of the operation strategy of BESS in this work is to flatten the load profile of the distribution system when the PV systems are installed. For example, during the situation when PV systems produce high output power, the load factor will be decreased because the transformer load is reduced. In order to increase the load factor, the load profile needs to be flattened by charged and discharged energy of BESS. In this paper, the load factor after implementation of BESS is assumed to be greater than 0.65. In addition, the rated and size of BESS must be sufficient to store the energy reversed to grid from PV output.
For determining the charge and discharge thresholds, the iterative method proposed by Sardi et al. (Citation2017) is adapted to the focused LV distribution system. The proposed procedure for achieving a suitable operational strategy of BESS for LV distribution system is described as follows:
Calculate total time (hour) for charging and discharging the energy of BESS.
Calculate total charged and discharged energy of BESS.
If the total charged energy exceeds the capacity of BESS, calculate excess charged energy from a difference between total charged energy and capacity of BESS.
Calculate the average excess charged energy from the excess charged energy divided by charging time.
If the active power dispatched by BESS at time t,
, is less than 0, set
If total discharged energy exceeds charged energy, calculate excess discharged energy from a difference between total discharged energy and charged energy.
Calculate average excess discharged energy from excess discharged energy divided by discharging time.
If
In this paper, in accordance with the standard of Provincial Electricity Authority of Thailand (PEA), the usage of transformer between 20% and 80% of its capacity is strictly allowed of Thailand (https://www.pea.co.th/). In addition, an inverter of BESS is used to absorb or inject the reactive power for voltage regulation, it is assumed that an inverter is operated at 0.95 power factor leading/lagging (“Provincial Electricity Authority’s Regulation on the Power Network System Interconnection Code Contents,” Citation2016). The analytical method for dispatching the reactive power is adopted from the literature (Sardi et al., Citation2017) and the inverter can operate in all four quadrants (Crossland, Jones, & Wade, Citation2014).
2.2. BESS model
In this study, it is assumed that the BESS is owned by the utility as centralized storage, the capacity of BESS is categorized as community-scale between tens to hundreds of kWh (Parra et al., Citation2017). In this work, the vanadium redox flow battery (VRB) type is particularly used in BESS because of its advantages such as high-performance, long lifetime and high cycle lifetime. The technical parameters of VRB are summarized in Table (Rasol et al., Citation2018).
Table 1. Technical and economical parameters of VRB
where are the maximum depth of discharge, the round-trip efficiency, the self-discharge rate, the cycle life of BESS, capital power conversion system and balance plant, the battery cost, the fixed and varied variable of operation and maintenance cost, respectively. The detailed calculation of cost, rated, capacity and lifetime of BESS is given in following sub-sections.
2.2.1. Capital and maintenance cost
The BESS capital cost, , includes battery price, power electronic system price and replacement cost, which can be written as EquationEquation (1)
(1)
(1) (Sardi et al., Citation2017):
where is the replacement cost of BESS,
is the maximum power of BESS (kVA) and
is the maximum capacity of BESS (kWh). In this paper, the replacement cost is particularly ignored due to the long lifetime and highest cycle-life properties of VRB.
The operation and maintenance cost, , of BESS includes fixed cost and variable cost. However, the variable cost is ignored due to its very small value. The
can be written as EquationEquation (2)
(2)
(2) (Sardi et al., Citation2017):
where is the rated active power of BESS (kW).
The ,
and
can be calculated according to the technical characteristics of each BESS technology, as shown in EquationEquation (3)
(3)
(3) to EquationEquation (5)
(5)
(5) (Sardi et al., Citation2017):
where are the pre-assigned size of BESS (kWh), the active power of BESS at time t (kW) and the reactive of BESS at time t (kvar), respectively.
2.2.2. Battery cycle life
The cycle life per day of battery, , is calculated by EquationEquation (6)
(6)
(6) (Jayasekara et al., Citation2016):
where is energy capacity of BESS (kWh) at time
and
is a number of time step. Then, the operating lifetime of BESS in a year during the planning horizon,
, can be calculated by EquationEquation (7)
(7)
(7) (Jayasekara et al., Citation2016):
where is a number of day in 1 year and
is cycle life of BESS.
2.3. Support fund for PV installation
In this paper, it is assumed that the cost of the PV installation is paid by both of the utility and the customer, where the customer owns PV systems. Also, the support fund paid by utility could provide a payback period of 15 years for the customer, based on the condition that the excess PV output from the customers’ demand will be injected to the distribution system. Therefore, the profit for utility is a reduction in purchased electricity from the grid. The PV's lifetime is assumed to be 25 years (Tantisattayakul & Kanchanapiya, Citation2017). Then, the customers can get the profit during the rest 10 years after the payback period. The support fund can be calculated from the installation cost after deduction of profit from a reduction in demand of customers from PV installation over 15 years. The profit from reduction demand is calculated using EquationEquation (8)(8)
(8) :
where is the profit from reduction demand (USD),
is the reduction of demand at all buses that PV systems are installed (kWh) within first 15 years and module degradation rate is 0.5% per year (Tantisattayakul & Kanchanapiya, Citation2017) and
is the average electricity of grid which is 0.1149 USD/kWh. And then, the support fund,
, can be calculated from installation cost after deduction of
, written as EquationEquation (9)
(9)
(9) :
where is the average installation price of PV rooftop system in Thailand which is 1667.70 USD/kW.
2.4. Cost-benefit analysis
In this paper, the BESS is implemented to achieve higher PV penetration level in the LV distribution system. However, the investment cost of BESS is normally high. Consequently, the NPV should be considered to analyze the feasibility of the project over a particular period. The optimal installation and operation of BESS are determined to maximize total NPV, and then the most suitable PV penetration level will be determined based on the maximum total NPV. The benefits are calculated based on the cost function including reduction of power purchased from upper gird, system upgrade deferral, reduction in , reactive power support and construction deferral of a coal-fired power plant. The costs of BESS include capital cost and operation and maintenance costs. The detail of the benefits will be presented in the next section. All benefits and operation and maintenance costs are multiplied by
to calculate NPV except the capital cost and support fund where
and
are inflation rate and discount rate, respectively. The inflation rate will depend on the economic conditions of each country. In part of the discount rate will depend on the expected return that government or private organization’s assumption for the return on investment.
is number of years that the profits and costs take place. In addition, the planning horizon depends on the period (year) that the system upgrade is deferred. When the LV distribution system is upgraded, the benefits will be changed because of an alternation of the power flow due to the change of transformer location. In case with no expansion or upgrade necessity, the improvement of the profits depends on the period of planning horizon that is defined.
2.5. Problem formulation
In order to maximize the benefits of BESS utilization, the maximum total NPV is considered as the objective function. The total NPV is calculated by benefits and costs which occur during the planning horizon, the benefits are considered including reduction of power purchased from upper gird , system upgrade deferral
, reduction in CO2
, reactive power support
and construction deferral of a coal-fired power plant
, whereas the considered costs are capital cost
, operation, and maintenance cost
and support fund
. All benefits and operation and maintenance cost will be changed in the future value into the same point by inflation and discount rate, while one-time costs are capital cost and support fund. Therefore, the total NPV can be written in EquationEquation (10)
(10)
(10) :
where and
are total NPV and planning horizon, respectively. The detail of parameters is listed in Table . In addition, the detail of all benefits and costs are explained in the following section.
Table 2. Economical parameters
Each sub-objective function is explained as follows:
2.5.1. Benefit of purchased power reduction
This benefit is a reduction of power purchased from upper gird, which can be computed as below (Liu et al., Citation2017):
where and
are the active power purchased from the upper grid at time
without BESS, the active power purchasing from the upper grid at time
with BESS and the electricity price purchasing from the upper grid, the price during peak and off-peak period is shown in Table . (“Wholesell tariff”, Citation2015)
Table 3. Electricity price
2.5.2. Benefit of system upgrade deferral
The implementation of the BESS can supply electricity during peak period. Therefore, the load on the transformer during peak period is reduced. This can defer system upgrade when the capacity limitation of transformer is reached. The benefit of system upgrade deferral can be computed as below (Sardi et al., Citation2017):
where is the average investment cost to upgrade the LV distribution system of Thailand and
is the fixed charge rate of converting cost to annuitized costs.
2.5.3. Benefit of CO2 emission reduction
Since the installation of BESS can reduce the operation of the coal-fired power plants, this can also reduce the emission of CO2 (Sardi et al., Citation2017). The benefit of saving a CO2 emission, , can be expressed in EquationEquation (13)
(13)
(13) :
where and
are the total energy discharged and charged by BESS in kWh, respectively,
and
are the standard coal consumption rate of power supply of the generation plants for peak shaving and routine period, respectively. Then, the profit of CO2 emission reduction,
, can be calculated as:
where is the cost of reduced emission of CO2.
2.5.4. Benefit of reactive power support
Since the inverter of BESS can absorb or inject the reactive power in order to regulate the voltage with 0.95 power factor leading/lagging, the benefit from this support can be expressed in EquationEquation (15)(15)
(15) :
where and
are reactive power dispatched by BESS at time
and reactive power payment, respectively.
2.5.5. Benefit of deferral construction of a coal-fired power plant
The effective operation of BESS normally results in a worthy use of electrical energy produced by PV systems. Since the energy produced by the BESS can stably supply electricity to the system, construction of a coal-fired power plant can be deferred (Wibulpolprasert, Citation2018). The benefit of deferral construction of coal-fired power plants, , can be calculated as the cost from EquationEquation (16)
(16)
(16) :
where is the cost saving of construction deferral of a coal-fired power plant for BESS 1 kWh in 1 year and
is the pre-assigned size of BESS in kWh.
2.6. BESS sitting and sizing technique
In this paper, the BESS sitting and sizing in the LV distribution system can be determined by solving the optimization problem. GA is performed to solve the optimization problem. The decision variables are an optimal location and size of BESS. The parameters of GA used in this study include string length of 10, population size of 50, iteration of 100, crossover rate of 0.7 and mutation rate of 0.05. The upper and lower bound of the location of the bus and pre-assigned sized of the BESS generated by GA are 2–41 and 10–750 kWh, respectively. The GA is solved by 5 runs for each case, and then the best result is reported. The procedure for finding optimal siting and sizing of BESS can be summarized as the following steps:
Read the input data for the planning problem, initialize a number of populations and number of iterations.
GA generates the initial population including the location and the pre-assigned size of BESS.
Determine the active power dispatched by BESS using the modified iterative method of each individual.
Inject obtained active power into the system, then run the power flow analysis of each individual.
Determine reactive power using an analytical method for improving voltage magnitude of each individual.
Inject active and reactive power into the system, then run the power flow analysis of each individual.
Calculate the rated power, rated inverter size and maximum size of BESS of each individual.
Find planning horizon depending on a year that system upgrade is deferred of each individual.
Calculate the total NPV of each individual.
Evaluate the objective function.
Check the terminating condition. If iteration less than the maximum number of iterations, go to step 2 with the new population. The new population is produced by the process of GA as follows:
(11.1) The crossover process where two individuals are randomly selected from population, and then randomly select the one-cut point in individuals to generate off-spring by exchanging the bit at the same section of cut point of the two individuals.
(11.2) The mutation of GA by randomly choosing the bit of each individual to mutate by changing 0 to 1 or 1 to 0 when the condition is met.
(11.3) The selection of GA where the individual with greater fitting values will have a higher chance to choose as the next population. On the other hand, the individual with lower fitting values does not have a chance to survive as the next population.
Repeat step 2–11 until a maximum number of iteration is reached. Then, the process is ended and the optimal solution is obtained.
2.7. Technical constraints
The technical constraints regarding the objective function in this work include voltage constraint, line overload constraint and power flow balance, given as follows:
where is the voltage at bus j and time t,
and
are the minimum and maximum limit of voltage, respectively,
is the current magnitude of branch
,
is the maximum limit of current magnitude of branch
,
is the active power of DG,
is the active power dispatched by BESS,
is the active power of line loss,
is the active power demand in bus,
is the active power load of transformer;
is the reactive power of DG,
is the reactive dispatched by BESS,
the is reactive power of line loss,
is the reactive power demand in bus and
is the reactive power load of transformer.
3. Case study
In this paper, the practical LV distribution system located in Ratchaburi province, Thailand is focused. This system is a radial system containing 41 buses connected to medium voltage system through the 100 kVA, 3 phase, 22 kV/0.4kV transformer. The peak load is 69.43 kW and 30.26 kvar, where the load and bus data are listed in Table A.1 of Appendix A. The power factor of the transformer is assumed to be 0.9. The bus number 1 is chosen to be the slack bus with initial conditions including the voltage magnitude of 1.01 p.u. and angle of 0. According to PEA standard, the upper and lower voltage limitation in LV distribution system are 1.05 p.u. and 0.95 p.u., respectively (“Provincial Electricity Authority’s Regulation on the Power Network System Interconnection Code Contents,“ Citation2016).
The Load model is assumed to follow the load research of PEA (“Load Research of PEA,” Citationn.d.). The normalized residential load of overall electricity usage of residential houses for 12 months (May 2017–April 2018) is used to generate this load model. The load model is calculated by an average of load demand throughout 12 months.
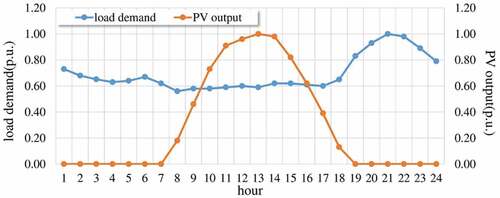
When the PV systems are installed, the normalized PV output power is obtained from practical data of Ratchaburi Province, Thailand, as shown in Figure (blue line). The load demand of this particular system is also demonstrated in Figure (orange line) in which the load growth is assumed to be increased in similar amounts. It is assumed that all loads and PV systems connected to the distribution system are 3 phase balanced. The power flow is calculated using MATPOWER in MATLAB. The PV output injected into the system is only the excess energy from above the demand of each bus. The maximum PV output of 5 kW with a power factor of 1 is assumed. To simplify the calculation, the number of days for 1 year is 360 days including 22 workdays and 8 holidays for each month.
Figure 1. Daily PV output and load demand (p.u.)
The total NPV of the distribution system is calculated at different penetration levels. The definition of penetration level in this study is a ratio of PV output (kW) to transformer capacity (kVA). While increasing the penetration level, it is assumed that the PV system is randomly installed to each bus. There are 10 cases of investigation including the base case without PV systems installation and the other cases including the effects of installing PV systems where the PV penetration level is 15% increased for each case. The PV Penetration level of 130% is limited due to the constraint that the transformer loading has to be above 20% after the dispatched power of BESS is injected into the system.
4. Results and discussion
Table indicates the total NPV of 10 case studies. The total NPV of case 1 (base case) is 0 since the profit in this work is obtained only from the implementation of BESS. The NPV of cases 2 to 7 is negative, while it becomes a positive value for cases 8 to 10. For cases 2 to 7, the negative NPV indicates that implementation of BESS on this particular system is not profitable for PV penetration level of 15% to 90%. On the other hand, after PV penetration level of 105% or above, cases 8 to 10 can provide the profit. The highest profit occurs at the PV penetration level of 130% in case 10, which indicates as the best case in this work. The profit obtained from the best case is 35,590 USD above the base case.
Table 4. Result of BESS planning for ten case study with different PV penetration level
From cases 1 to 10, it is seen that when the PV penetration level is increased, the larger rated and size of BESS are increasingly required to prevent a constraint violation, as well as to increase the charged/discharged energy for flattening the load profile.
For cases 2 to 7, although most of the benefits are increased due to the larger rated and size of BESS, however, the total NPV is still negative because the profit provided by BESS is dominated by the installation cost and support fund. On the other hand, for cases 8 to 10, an installation of BESS can provide more profitable than the investment cost, which results in the positive total NPV.
Among all benefits, it was found that the majority of the profit depends on the of 47.86% and
of 45.25%. The
is varied according to the size of the BESS. Meanwhile, the
is varied according to the PV penetration level. When higher PV penetration level is integrated into the system, the
will be increased because the purchased power from the upper grid is increasingly reduced due to higher PV output.
In addition, the period of planning horizon (year) in each case depends on the number of years that system upgrade is deferred. As can be seen in Table , the larger rated and size of BESS can cause a longer period to defer the system upgrade, which further causes a longer time delay for the planning horizon. As the planning horizon increases, most of the benefits are also increased. In this work, it is particularly noted that in the case which the lifetime of BESS is longer than the period of the planning horizon, a replacement of BESS during planning horizon is not required until system upgrade is desired.
By considering the load factor before and after implementation of BESS, written as and
, respectively, it is seen that the
is increasingly reduced at higher PV penetration levels. Also, the PV output could excess the system demand at higher PV penetration levels, which results in an existing of excess energy reversed to the upper grid. Therefore, BESS is implemented to improve the load factor and provide efficient energy usage. It can be seen from Table that the
of all cases are improved from the initial.
Figure shows an example of the load on the transformer for case 3. It is seen that the load on the transformer with the implementation of BESS is more flatten than without implementation of BESS. Therefore, an implementation of BESS can result in a more flatten load on the transformer as well as an improvement of the load factor.
Figure 2. The load on the transformer for case 3
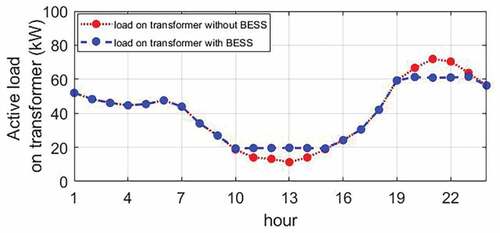
Figure ) shows an example of the load on the transformer for case 8. It is noticed that a large amount of excess energy reversed to the upper grid occurs during the period that PV output exceeds the system demand, indicated as minus sign of active load on the transformer. When the BESS is implemented, the excess energy during high PV output is stored by BESS. This stored energy will be injected into the system on another specified period. It can be seen in Figure ) that the excess energy is stored by BESS during high PV output at 09.00–17.00 hr. and then the stored energy is discharged during 01.00–07.00 and 18.00–24.00 hr. In addition, the load on the transformer for this case is also increasingly flattened after implementation of BESS, as shown in Figure ). Therefore, in case that the excess energy exists, the BESS can optimally utilize the excess energy to reduce the purchased power from the upper grid, which yields an increase of .
Figure 3. (a) The active load on transformer without BESS (b) the charged/discharged active power of BESS and (c) the active load on the transformer with BESS for case 8
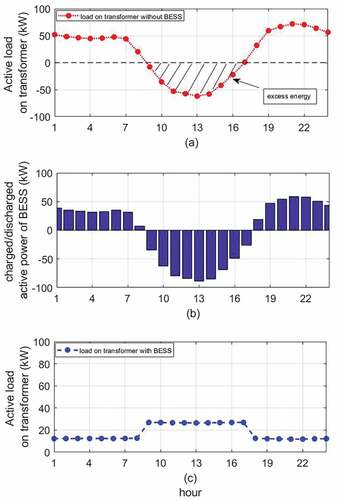
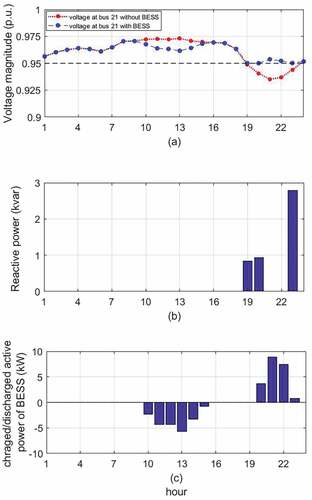
Figure ) shows an example voltage magnitude before/after implementation of the BESS at bus 21 of case 2. The reactive power dispatched by BESS’s inverter and the active power from BESS of case 2 is also demonstrated in Figure ), respectively. From Figure ), it is indicated that the voltage magnitude without the implementation of BESS is below the voltage limitation of 0.95 p.u. at some period. After the implementation of BESS, the voltage magnitude at all periods becomes within the limitation. From Figure ), it is shown that reactive power is highly dispatched by the inverter of BESS during the period that the voltage below the limitation. Figure ) also indicates that active power from BESS is also injected into the system during voltage below-limitation period.
Figure 4. (a) The voltage magnitude (b) reactive power dispatched by BESS’s inverter and (c) active power dispatched by BESS’s inverter for case 2
From overall results, although the integration of PV systems in the distribution system can reduce the energy purchased from the upper grid, the energy produced from PV systems only exists during the day. The energy produced by the PV system can also cause the reversed energy to the upper grid in the case that the PV output exceeds the system demand. Therefore, optimal planning and operation of BESS are implemented to provide efficient energy usage and maximum benefits when installing the PV systems with different penetration levels. In this particular distribution system, an integration of PV penetration level of 130% with BESS capacity of 794.57 kWh at bus 24 can provide the maximum total NPV. This optimal penetration level can produce the NPV more than the base case about 35,590 USD. The results of this study can be utilized in the practical system to provide the profits for the utilities. Moreover, the installation of PV system essentially supports the use of renewable energy to accommodate the electricity demand.
5. Conclusion
This paper aims to increase the PV penetration level in practical LV distribution system located in Ratchaburi of Thailand by the implementation of BESS. There are 10 cases of PV penetration level were investigated. The optimal siting, sizing, and operation of BESS were also determined to aim at maximizing total NPV for each case. The focused benefits included a reduction of power purchased from upper gird, system upgrade deferral, a decrease of CO2 emission, reactive power support and deferral construction of a coal-fired power plant. The considered costs were the capital cost, operation and maintenance cost, and support fund. The method for flattening load profile in the LV distribution system was also proposed. The GA was performed to solve the optimization problem. The simulation results showed that the suitable PV penetration level of this particular system is 130%. The maximum total NPV provided by the best case was 35,590 USD above the base case. The optimal BESS sizing and siting were 794.57 kWh and bus 24, respectively. In addition, it was also found that the proposed optimal operation of BESS can totally flatten the load profile. The findings can be utilized for increasing PV penetration level in the LV distribution system.
Acknowledgements
Authors would like to acknowledge financial support and information of the distribution system from the Provincial Electricity Authority of Thailand (PEA).
Additional information
Funding
Notes on contributors
Nathphol Khaboot
Nathphol Khaboot is studying master’s degree in Electrical Engineering, Khon Kaen University, Thailand. His research interests include integration of photovoltaic systems and battery energy storage in distribution system.
Rongrit Chatthaworn
Rongrit Chatthaworn is currently a lecturer at Electrical Engineering Department, Faculty of Engineering, Khon Kaen University. His research interests include power system planning and power system reliability.
Apirat Siritaratiwat
Apirat Siritaratiwat is currently a lecturer at Department of Electrical Engineering, Faculty of Engineering, Khon Kaen University. His research interests include a development in hard disk drive technology.
Chayada Surawanitkun
Chayada Surawanitkun is currently a lecturer at Faculty of Applied Science and Engineering, Khon Kaen University, Nong Khai Campus, Thailand. Her research interests include magnetic random access memory and electrostatic discharge.
Pirat Khunkitti
Pirat Khunkitti is currently a lecturer at Electrical Engineering Department, Faculty of Engineering, Khon Kaen University. His research interests include power systems, electrical generators, magnetic recording heads, spintronic and electromagnetic interference.
Related Research Data
References
- Arya, Y. (2019a). AGC of PV-thermal and hydro-thermal power systems using CES and a new multi-stage FPIDF- (1 + PI) controller. Renewable Energy, 134, 796–19. doi:10.1016/j.renene.2018.11.071
- Arya, Y. (2019b). AGC of restructured multi-area multi-source hydrothermal power systems incorporating energy storage units via optimal fractional-order fuzzy PID controller. Neural Computing and Applications, 31(3), 851–872. doi:10.1007/s00521-017-3114-5
- Arya, Y., & Kumar, N. (2016). Fuzzy gain scheduling controllers for automatic generation control of two-area interconnected electrical power systems. Electric Power Components and Systems, 44(7), 737–751. doi:10.1080/15325008.2015.1131765
- Bortolini, M., Gamberi, M., & Graziani, A. (2014). Technical and economic design of photovoltaic and battery energy storage system. Energy Conversion and Management, 86, 81–92. doi:10.1016/j.enconman.2014.04.089
- Chaudhary, P., & Rizwan, M. (2018). Voltage regulation mitigation techniques in distribution system with high PV penetration: A review. Renewable and Sustainable Energy Reviews, 82(October2017), 3279–3287. doi:10.1016/j.rser.2017.10.017
- Crossland, A. F., Jones, D., & Wade, N. S. (2014). Electrical power and energy systems planning the location and rating of distributed energy storage in LV networks using a genetic algorithm with simulated annealing. International Journal of Electrical Power & Energy Systems, 59, 103–110. doi:10.1016/j.ijepes.2014.02.001
- Demirok, E., González, P. C., Frederiksen, K. H. B., Sera, D., Rodriguez, P., & Teodorescu, R. (2011). Local reactive power control methods for overvoltage prevention of distributed solar inverters in low-voltage grids. IEEE Journal of Photovoltaics, 1(2), 174–182. doi:10.1109/JPHOTOV.2011.2174821
- Electricity statistic. (n.d.). Retrieved from http://www.eppo.go.th/index.php/en/en-energystatistics/electricity-statistic?orders[publishUp]=publishUp&issearch=1
- Höök, M., & Tang, X. (2013). Depletion of fossil fuels and anthropogenic climate change-A review. Energy Policy, 52, 797–809. doi:10.1016/j.enpol.2012.10.046
- International Energy Outlook 2017. (2017). Retrieved from https://www.eia.gov/outlooks/ieo/
- Jamian, J. J., Mustafa, M. W., Mokhlis, H., & Baharudin, M. A. (2014). Electrical power and energy systems simulation study on optimal placement and sizing of battery switching station units using artificial bee colony algorithm. International Journal of Electrical Power and Energy Systems, 55, 592–601. doi:10.1016/j.ijepes.2013.10.009
- Jayasekara, N., Member, S., Masoum, M. A. S., Member, S., Wolfs, P. J., & Member, S. (2016). Optimal operation of distributed energy storage systems to improve distribution network load and generation hosting capability. IEEE Transactions on Sustainable Energy, 7(1), 250–261. doi:10.1109/TSTE.2015.2487360
- Lalitha, M. P., Reddy, V. C. V., & Usha, V. (2010). Optimal DG placement for minimum real power loss in radial distribution systems using PSO. Journal of Theoretical and Applied Information Technology, 13(2), 107–116.
- Liu, W., Niu, S., & Xu, H. (2017). Optimal planning of battery energy storage considering reliability benefit and operation strategy in active distribution system. Journal of Modern Power Systems and Clean Energy, 5(2), 177–186. doi:10.1007/s40565-016-0197-4
- Load Research of Provincial Electricity Authority (PEA). (n.d.). Retrieved from http://peaoc.pea.co.th/loadprofile/
- Onlam, A., Yodphet, D., Chatthaworn, R., Surawanitkun, C., Siritaratiwat, A., & Khunkitti, P. (2019). Power loss minimization and voltage stability improvement in electrical distribution system via network reconfiguration and distributed generation placement using novel adaptive shuffled frogs leaping algorithm. Energies, 12(3), 553. doi:10.3390/en12030553
- Parra, D., Swierczynski, M., Stroe, D. I., Norman, S. A., Abdon, A., Worlitschek, J., … Patel, M. K. (2017). An interdisciplinary review of energy storage for communities : Challenges and perspectives. Renewable and Sustainable Energy Reviews, 79(May2016), 730–749. doi:10.1016/j.rser.2017.05.003
- Petinrin, J. O., & Shaabanb, M. (2016). Impact of renewable generation on voltage control in distribution systems. Renewable and Sustainable Energy Reviews, 65, 770–783. doi:10.1016/j.rser.2016.06.073
- Pezeshki, H., Wolfs, P. J., & Ledwich, G. (2014). Impact of high PV penetration on distribution transformer insulation life. IEEE Transactions on Power Delivery, 29(3), 1212–1220. doi:10.1109/TPWRD.2013.2287002
- Provincial Electricity Authority’s Regulation on the Power Network System Interconnection Code Contents. (2016). 2559. Retrieved from https://www.pea.co.th/Portals/0/Document/vspp/PEAInterconnectionCode2016.pdf
- Rasol, M., Sedighi, A., Savaghebi, M., & Guerrero, J. M. (2018). Optimal placement, sizing, and daily charge/discharge of battery energy storage in low voltage distribution network with high photovoltaic penetration. Applied Energy, 226(March), 957–966. doi:10.1016/j.apenergy.2018.06.036
- Renewable capacity statistics 2017. (2017). Retrieved from https://www.irena.org/Publications
- Saboori, H., Hemmati, R., Mohammad, S., Ghiasi, S., & Dehghan, S. (2017). Energy storage planning in electric power distribution networks – A state- of-the-art review. Renewable and Sustainable Energy Reviews, 79(April), 1108–1121. doi:10.1016/j.rser.2017.05.171
- Sardi, J., Mithulananthan, N., Gallagher, M., & Quoc, D. (2017). Multiple community energy storage planning in distribution networks using a cost-benefit analysis. Applied Energy, 190, 453–463. doi:10.1016/j.apenergy.2016.12.144
- Tantisattayakul, T., & Kanchanapiya, P. (2017). Financial measures for promoting residential rooftop photovoltaics under a feed-in tari ff framework in Thailand. Energy Policy, 109(July), 260–269. doi:10.1016/j.enpol.2017.06.061
- Tonkoski, R., Member, S., Lopes, L. A. C., Member, S., & El-fouly, T. H. M. (2011). Coordinated active power curtailment of grid connected PV inverters for overvoltage prevention. IEEE Transactions on Sustainable Energy, 2(2), 139–147. doi:10.1109/TSTE.2010.2098483
- Wang, G., Ciobotaru, M., & Agelidis, V. G. (2014). Power smoothing of large solar PV plant using. IEEE Transactions on Sustainable Energy, 5(3), 834–842. doi:10.1109/TSTE.2014.2305433
- Wholesell tariff. (2015). Retrieved from http://www.egat.co.th/index.php?option=com_content&view=article&id=174&Itemid=222
- Wibulpolprasert, W. (2018, Apirl 3). เทคโนโลยีกักเก็บพลังงาน [Energy storage technology]. Retrieved from https://tdri.or.th/2018/04/ess-battery/
- Xiao, J., Bai, L., Zhang, Z., & Liang, H. (2016). Determination of the optimal installation site and capacity of battery energy storage system in distribution network integrated with distributed generation. IET Generation, Transmission & Distribution, 10(3), 601–607. doi:10.1049/iet-gtd.2015.0130
- Yang, Y., Bremner, S., Menictas, C., & Kay, M. (2018). Battery energy storage system size determination in renewable energy systems : A review. Renewable and Sustainable Energy Reviews, 91(June2017), 109–125. doi:10.1016/j.rser.2018.03.047
- Yang, Y., Member, S., Li, H., Member, S., Aichhorn, A., & Member, S. (2014). Sizing strategy of distributed battery storage system with high penetration of photovoltaic for voltage regulation and peak load shaving. IEEE Transactions on Smart Grid, 5(2), 982–991. doi:10.1109/TSG.2013.2282504
- Zheng, Y., Dong, Z. Y., Luo, F. J., Meng, K., Qiu, J., & Wong, K. P. (2014). Optimal allocation of energy storage system for risk mitigation of discos with high renewable penetrations. IEEE Transactions on Power Systems, 29(1), 212–220. doi:10.1109/TPWRS.2013.2278850
Appendix A
Table A1. Bus and load data for the 41-bus test system in Ratchaburi, Thailand