
 ?Mathematical formulae have been encoded as MathML and are displayed in this HTML version using MathJax in order to improve their display. Uncheck the box to turn MathJax off. This feature requires Javascript. Click on a formula to zoom.
Abstract
The manual seeding of system of rice intensification (SRI) seedling tray is time and labor intensive. Hence, there is need to mechanize the seeding process. In this study, a vacuum-based seeding manifold was proposed for automatic seeding of SRI seedling tray. Pressure maldistribution is believed to be the cause of low performance in many pneumatic systems. The manifold design was optimized using computational fluid dynamics (CFD) software to achieve high pressure uniformity. Two manifold designs with cylindrical and rectangular vacuum chamber types, each with 924 seeding nozzles (equal to the seedling cavities on SRI seedling tray) were compared for better vacuum distribution. Manifold with rectangular vacuum chamber was found to have a better pressure uniformity than manifold with cylindrical vacuum chamber and was adopted for development of the seeding manifold.
Public Interest Statement
Estimation of the size of vacuum pump required to meet predefined pressure or vacuum specifications and the understanding of pressure distribution are critical in the development of pneumatic systems. Conventionally, the selection of vacuum pump is carried out through a series of trial and error by experienced personalities. Optimization of design of engineering components using computer-aided design (CAD) software is a way of reducing cost of design process by reducing the number of physical components and experimental set ups. Through the use of design software, many variables and configurations could be look at numerically. In this study, computational fluid dynamic software (CFD) was used to investigate pressure distribution in seedling tray seeding manifold and to estimate the size of vacuum pump that is sufficient for a pneumatic system.
1. Introduction
In efficient nursery management systems, seedling trays are widely used for both commercial and small scale farming (Durner, Poling, & Maas, Citation2002). Depending on crop type and cropping system, there are various seedling tray designs. Usually, small holding farmers insert seeds manually into the tray, while for commercial farmers, there are mechanical devices that are used, either semi or fully automatic (Liu, Wang, & Wang, Citation2015; Nunomura, Kozai, Shinozaki, & Oshio, Citation2016). Common to other challenges in agriculture, adapting tray-seeding concept to fit various crops is non-trivial. The application of seedling tray for rice nursery has been established (Yamauchi, Aguilar, Vaughan, & Seshu, Citation1993). However, these are based on broadcasting where seed-to-seed spacing was not made a priority, resulting in dense seedling population with interwoven root system, which makes mechanical single seedling transplant impossible. Single seedling transplant is a basic requirement in the system of rice intensification (SRI). Single-seedling tray is required to mechanize single seedling transplant of rice seedling. A single-seedling tray was developed for SRI by Bashar et al., (Citation2015) to address this problem. The seedling tray was efficient in raising single vigor rice seedling suitable for SRI. However, there is need to mechanize the tray seeding process, to reduce the high labor experienced in manual seeding of the tray.
Considering the size and shape of rice seeds, one of the possible methods to mechanize the single seeding of rice to seedling tray is through vacuum powered nozzles, where individual seeds can be picked and placed precisely to the seedling cavities. If the nozzles are arranged in an array, variation in vacuum pressure could exist within the positions. The magnitude of vacuum pressures at the nozzle tips has to be optimized in order to ensure that at the minimal zone, the supplied pressure is sufficient for seed picking. Study of the distribution of this pressure is critical in the design of seeding manifold, to minimize miss and multiple seeding. In manifolds with 924 seeding nozzles, experimental study of pressure distribution across the manifold could be an expensive approach. Therefore, this research is interested in using CFD to understand the behavior of vacuum pressure in relation to airflow rate and seeding manifold configuration, for the purpose of mechanizing SRI seedling tray seeding process.
The study of fluid dynamics in large and complex aerodynamic systems is practically complex (Buccolieri, Santiago, Rivas, and Saanchez, Citation2018; Lihong, Christopher, and Yi, Citation2015) and economically expensive. The use of computational fluid dynamic simulation could replace physical experiments in fluid dynamic studies (Badar, Buchholz, Lou, and Ziegler, Citation2012; Blocken, Citation2015; Fu et al., Citation2016; Hsu, Akkerman, and Bazilevs, Citation2014; Wu, Huang, Wang, and Gao, Citation2015). In pressure-related studies, computational fluid dynamic (CFD) software has been used in the estimation of pressure distribution in the manifold of proton exchange membrane (PEM) fuel cell (Chen, Jung, and Yen, Citation2007; Wilberforce et al., Citation2017). In heat exchanger CFD was used to study pressure drop (Mahmood et al. (Citation2012); Pal, Kumar, Joshi, and Maheshwari (Citation2016); Shahril, Quadir, Amin, and Anjum (Citation2017). CFD was used by Badar et al. (Citation2012) to determine pressure loss in the tee junction of a solar collector manifold. Dong, Xu, and Xu (Citation2017) studied the effects of channel length and airflow rate on the pressure uniformity and drop in a multistage channel fuel cell using CFD. In a research aimed at modeling a predefined flow distribution among parallel mini channels Wei, Boutin, Fan, and Luo (Citation2016) studied the relationship between simulated flow distribution using CFD and experimental flow distribution using PIV technique. The results of this study showed a strong agreement between the two methods.
The configuration of flow components affects uniformity of fluids flow (Jafar, Thamer, Wahid, and Wissam, Citation2015). The effect of structural configuration on pressure drop of PEM was studied by Saco, Karuppa, and Karthikeyan (Citation2016) using CFD. Study of flow distribution uniformity in fuel channels with multiple bifurcations using CFD conducted by Badar et al. (Citation2012) have shown that the structural configuration of flow surface have significant effect on the flow uniformity. Among three structural configurations: a sharp cornered 90 degree turnings; round cornered 90 degree turnings; and circular 90 degree turnings considered in the study, spherical curvature has better uniformity in comparison to sharp and round curvatures. Round curvature also have a better uniformity than a sharp curvature. The lower uniformity observed in the sharp curvature design is due to the turbulent flow caused by sharp edges. In the design of the proposed SRI tray seeding manifold, round and spherical curvatures will be considered and compared for a better flow uniformity and vacuum pressure distribution.
In the design and optimization of performance of seeding devices CFD has been used by several researchers. Zuo, Ma, Qi, and Liao (Citation2011) used CFD in the design of cylindrical type seeding manifold for seedling tray seeding to check air pressure and velocity in the vacuum chamber. This type of seeding manifold feed single row of seedlings per placement circle, hence, the need to develop a manifold with higher seeding capability, to fill the whole seedling cavities on a tray per placement circle. Xiaolian, Xiaorong, Wei, and Xiaoqiong (Citation2016) used CFD in the design of vacuum seeder metering device to determine air velocity and pressure at different sections of the seeder. The relationship between nozzle diameter and seed absorption rate was also investigated in the study. Badar et al. (Citation2012) used CFD to study the effects of vacuum and positive pressure on the performance of pneumatic precision seeder. Fluid model of the seed metering chamber was simulated in CFD software to study the pressure and air velocity at the nozzles. The effect of positive and negative pressure on the performance of precision vacuum seeder was investigated by Jiajia, Yitao, Jinling, Song, and Qingxi (Citation2014) using CFD, where a relationship between pressure at the manifold outlet and pressure at the nozzle tip was established using stepwise linear regression. In the conventional design of plug tray seeding machine a uniform vacuum distribution is usually assumed among the nozzles (Gaikwad & Sirohi, Citation2008). This assumption could lead to poor machine performance, as in reality pressure variation do occurs along the manifold. The magnitude of the variation could be significant when it results in high multiple or miss seeding rate. The use of CFD as an analysis tool could aid in avoiding such a low performance.
2. Materials and methods
2.1. Vacuum manifold
The seedling tray seeding manifold was designed with the capability to pick 924 paddy seeds at a go and place them individually into 924 seedling cavities of a specialized system of rice intensification (SRI) seedling tray. It consists of a vacuum chamber that distributes suction among seeding nozzles. The nozzles are formed on one of the manifold surfaces and connected to the vacuum chamber via the seed-hole. In operation, a vacuum pump would be connected to the vacuum chamber using a pneumatic hose via the suction-hole. This creates a negative pressure at the nozzles tip. The pressure enables the nozzle to pick individual seeds, depending on the magnitude of the suction generated and weight of the seed to be picked. The 924 seeding nozzles were formed in an array of 22 by 42. Each of the nozzles has a seed-hole of 1 mm diameter. The 1 mm seed-hole diameter was obtained from a previous study aimed at determining the critical parameters in the pneumatic handling of paddy seeds.
With the aim of attaining the highest level of vacuum uniformity among the nozzles, two manifold designs were considered and compared numerically using CFD. These are manifold with single rectangular vacuum chamber and manifold with a series of 42 cylindrical vacuum chambers, each bearing 22 nozzles. Both the cylindrical and rectangular type manifolds have the same array of nozzles at the manifold surface.
2.1.1. Manifold with rectangular vacuum chamber
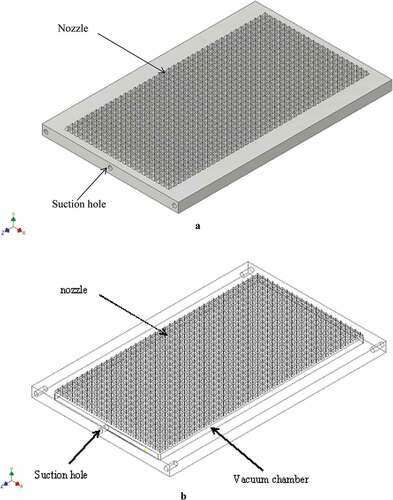
The CAD model of the seeding manifold with rectangular vacuum chamber type is shown in Figure (a). The internal architecture of the manifold is shown in Figure (b). The manifold has the principal dimensions 650 mm by 350 mm by 45 mm. The manifold has 924 pyramids like nozzles of 10 mm height and width, formed on one of the 650 mm by 350 mm faces of the manifold, arranged in an array of 22 by 42, with a center to center distance of 15 mm. The manifold is made of three layers, two solid layers of 15 mm thickness each and a hollow layer of 15 mm referred to as vacuum chamber in between them. The vacuum chamber is bounded by 10 mm thickness of solid layer sideways. A 10 mm diameter suction-hole was made on one of the 45 mm by 350 mm surfaces and at the center of it through the vacuum chamber. The four-hole at the four edges are for support.
Figure 1. Rectangular vacuum chamber manifold
2.1.2. Manifold with cylindrical vacuum chamber
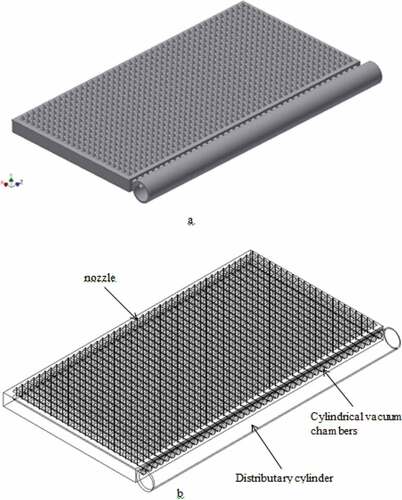
The second design shown in Figure is the manifold with cylindrical vacuum chambers. Shown in Figure (a) is the solid manifold, while Figure (b) shows the internal architecture of the manifold. The manifold has an external volume and dimensions similar to that of manifold with rectangular vacuum chamber in the nozzles bearing part. The principle difference between the two is the vacuum chamber type. Here, 22 cylindrical vacuum chambers of 10 mm diameter, with center to center distance of 15 mm were drilled from one of the 45 mm by 650 mm surfaces of the manifold to a depth of 340 mm. Another cylinder (distributary cylinder) of 650 mm length, 40 mm inner diameter and 50 mm outer diameter with 42 holes of 12 mm diameter formed on the cylinder surface along the cylinder length were drilled from the cylinder surface to the inner chamber of the cylinder. The distributary cylinder has one open end for connection to vacuum pump. Forty-two connectors of 50 mm length, 12 mm outer diameter, and 10 mm inner diameter were used to couple and connect the distributary cylinder to the main manifold.
Figure 2. Cylindrical vacuum chamber type manifold
2.2. Vacuum distribution in seeding manifold
The pressure distribution in the different manifold designs was simulated in this part of the study. Prior to simulation of pressure distribution in the two manifold designs with 924 nozzles, an attempt was made to check the vacuum distribution in smaller sizes manifolds with fewer number of nozzles and the data was used to develop a regression model that relates number of nozzles, air flow rate, and pressure in the nozzle. The manifolds considered at this stage were 3 by 3, 6 by 6, and 9 by 9 nozzle manifolds, consisting of 9, 36, and 81 nozzles, respectively. All the three manifolds are of the rectangular single vacuum chamber type. The target vacuum pressure at the nozzle tips in each of the three manifolds was 30 mbar. The 30 mbar vacuum pressure is the amount of vacuum that is sufficient for single seeding of MR219 paddy seeds determined using models developed by Karayel, Barut, and Özmerzi (Citation2004).
2.2.1. Simulation of pressure distribution in 3 by 3, 6 by 6, and 9 by 9 nozzles manifolds
For the purpose of the study of pressure distribution in the 3 by 3, 6 by 6, and 9 by 9 nozzle manifolds, and variability of the distribution among the three manifold sizes, three CAD models of manifolds with 3 by 3, 6 by 6, and 9 by 9 arrays of nozzles were developed in Autodesk Inventor. Similar with other CFD model settings that involve pressure distribution analysis, capping was made to each of the nozzle seed-hole and the manifold suction-hole, for the purpose of proper boundary condition assignment. The capped model was imported to the CFD software. At material assignment stage, PVC was assigned to the solid manifold and air was assigned to the vacuum chamber and the capped parts, respectively. Boundary conditions of flow rate and pressure were assigned to the 10 mm suction-hole cap tip and each tip of the capped surface of the1 mm nozzle seed-hole, respectively. A pressure value of zero was assigned to each of the tip of the seed-hole cap. An arbitrary flow rate was assigned to the tip of the10 mm suction-hole cap. The model was meshed and simulated at 200 iterations, set in auto convergence. After convergence was achieved, the pressure at each nozzle tip was examined and recorded. This procedure was repeated for different flow rate values until an average vacuum pressure close to30 mbar was achieved at the nozzle tip. The simulation was conducted for the 3 by 3, 6 by 6, and 9 by 9 nozzles manifolds.
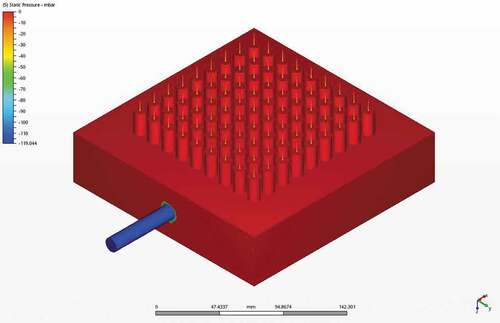
The simulated pressure distribution in the 3 by 3, 6 by 6, and 9 by 9 nozzles manifold models are shown in Figures –, respectively. The red portion with zero pressure as shown in the legend is the solid part of the manifold, which is at zero state of pressure. The blue portion found in the imaginary air added to the model through a capping process has the highest pressure in the model under the prescribed boundary conditions. The yellow portion is the region around the nozzle tip, which is the region of interest in this simulation. The pressure values recorded from each nozzle was taken at this point.
Figure 3. Simulated pressure distribution in 3 by 3 nozzle manifold
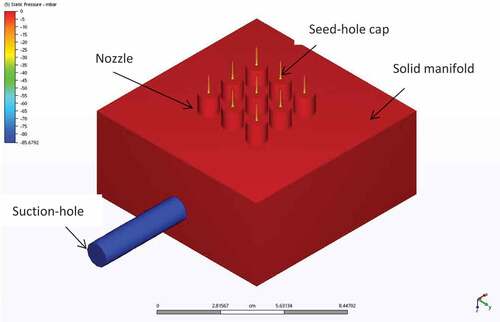
Figure 4. Simulated pressure distribution in 6 by 6 nozzle manifold
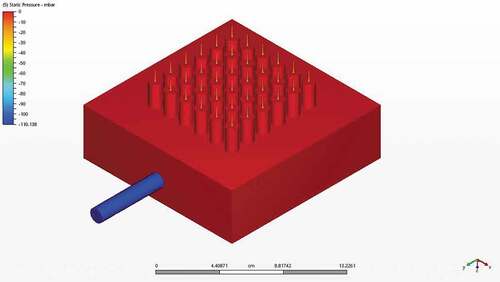
Figure 5. Simulated pressure distribution in 9 by 9 nozzle manifold
2.2.2. Pressure distribution in different suction outlet configurations
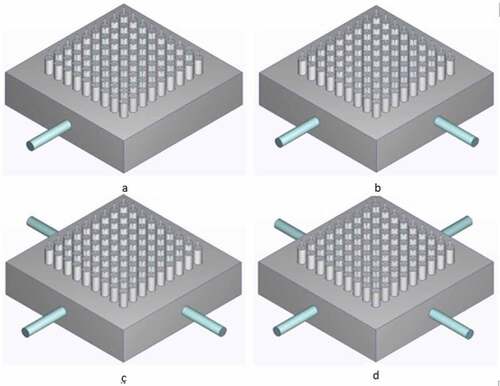
The effect of different suction-hole configurations on pressure distribution was studied. The 3 by 3, 6 by 6, and 9 by 9 nozzle manifolds were simulated using single, two, three, and four suction-holes, respectively. For each of the three manifold sizes, the same amount of flow rate was used for the four different suction-hole configurations. The four configurations of these suction-holes on 3 by 3 nozzles manifold is shown in Figure (a–d), respectively. The four configurations of the suction-holes on 6 by 6 nozzles manifold is shown in Figure (a–d), for one outlet, two outlets, three outlets, and four outlets, respectively. The four configurations of the suction-holes on 9 by 9 nozzles manifold is shown in Figure (a–d), for manifolds with one outlet, two outlets, three outlets, and four outlets, respectively.
Figure 6. Four configurations of suction-outlet in 3 by 3 nozzle manifold
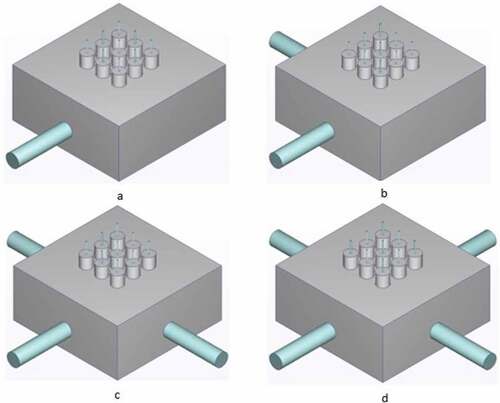
Figure 7. Four configurations of suction-outlet in 6 by 6 nozzles manifold
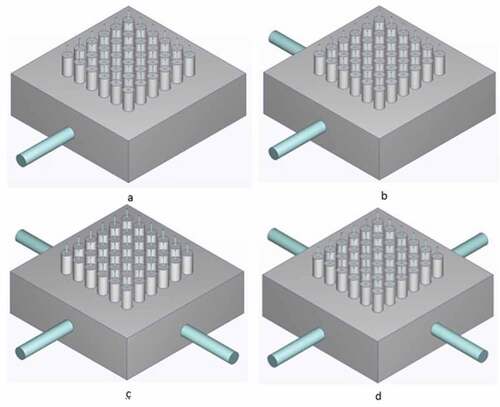
Figure 8. Four configurations of suction-outlet in 9 by 9 nozzles manifold
2.2.3. Pressure distribution in cylindrical and rectangular manifolds with 924 nozzles
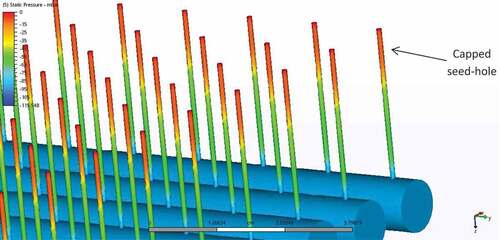
The pressure distribution in manifold with cylindrical vacuum chamber type and 924 nozzles was simulated. The simulated model showing different pressure regions is shown in Figure . Prior to the simulation, the model was capped at the 924 nozzle inlets and the single suction outlet. PVC was assigned as material for the solid parts, and air for the capped portions and hollow chambers. At the boundary condition assignment, a negative flow rate was assigned at the tip of the distributary cylinder cap, while a zero pressure was assigned to the tip of each of the 924 nozzles caps. The air part of the model was meshed, while the solid part was suppressed to reduce elemental count. In the simulated model, only the air portion of the model was shown. The 42 cylinders, each with 22 nozzles could be seen in the simulated model. From the bigger cylinder (distributary cylinder), the vacuum is higher at the cylinder outlet where the vacuum pump would be connected, and the vacuum drops as we go further towards the dead end. It is a similar situation with the lateral vacuum cylinders. High vacuum toward the outlet of the distributary and vacuum cylinders was observed, and the vacuum drops toward the dead end of the cylinders. The vacuum distribution pattern has two degrees of variation, that is variation across the cylindrical vacuum chambers and variation along each cylindrical vacuum chamber. A zoomed picture of the capped seed-hole and cylindrical vacuum chambers is shown in Figure .
The same procedure used in simulation of pressure distribution on the cylindrical type vacuum chamber manifold with 924 seeding nozzles was replicated on the rectangular type vacuum chamber manifold.
Figure 9. Simulated pressure distribution in manifold with cylindrical vacuum chamber and 924 nozzles
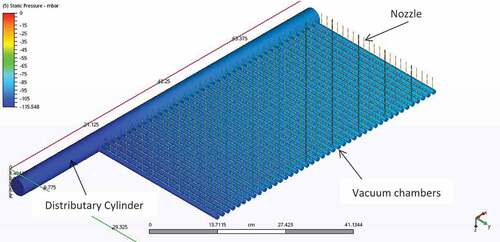
Figure 10. Zoomed manifold part showing vital features
2.3. Validation of vacuum pressure distribution simulation
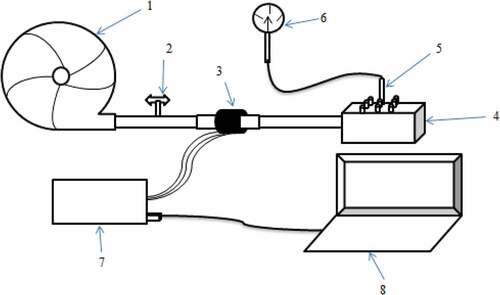
The simulation of vacuum pressure distribution in a seeding manifold was validated experimentally. The schematic diagram of the experimental validation setup is shown in Figure . The setup consists of a vacuum pump (1), air flow regulator valve (2), AWM5000 airflow sensor (3), nozzle manifold (4), seeding nozzle (5), vacuum gauge (6), micro controller (7), and a PC (8). The nozzle manifold consists of nine detachable single seeding nozzles. In the first round of the experiment, only one nozzle was left on the manifold. The remaining eight nozzles were removed and the nozzle-manifold connection hole was closed using threaded bolts. The micro controller was programmed to read the airflow into the seeding manifold through the airflow sensor connected to it. The air flow regulator valve was adjusted until a flow rate reading of 0.8 cfm was observed on the computer monitor connected to the microcontroller. Vacuum gauge was connected to the seed-hole of the nozzle attached to the manifold. The vacuum pressure observed was recorded. One bolt blocking the nozzle-manifold connection hole was then removed and a nozzle attached to it. Two vacuum gauges were then used to read the vacuum pressure at the tip of the two nozzles simultaneously. Another bolt was then removed, and a nozzle was attached to the nozzle-manifold connection hole. Three vacuum gauges were used to read the vacuum pressure at the tip of each nozzle simultaneously.
Figure 11. Experimental validation of simulated vacuum pressure distribution
Vacuum pressure distribution in a CAD model of a seeding manifold similar to that used in the experimental study was simulated using an air flow rate of 0.8 cfm directed out of the model. The simulation was carried out using one, two, and three nozzles, respectively. The vacuum pressure at the seed-hole in each of the three simulations was recorded and compared with the experimented results.
3. Results and discussion
3.1. Pressure distribution and flow rate-vacuum relationship in 3 by 3 nozzles manifold
The pressure variability parameters among the nine nozzles were summarized in Table . Little variation was observed among the nine nozzles, where a mean vacuum pressure of 30.06 mbar was observed using 3.2 cfm air flow rate assigned to the manifold suction-hole. From among the nine nozzles, a maximum of 30.83 mbar and a minimum of 29.79 mbar vacuum pressures were observed, and a vacuum range of 1.42 mbar recorded. Variation in vacuum pressure among the nozzles was small, with a standard deviation of 0.538.
Table 1. Variability parameters of pressure distribution in 3 by 3 nozzle manifold
3.2. Pressure distribution and flow rate-vacuum relationship in 6 by 6 nozzles manifold
The pressure variability parameters among the 36 nozzles in this manifold were summarized in Table . A mean vacuum of 30.99 mbar was observed. A standard deviation of 0.613 was observed with a range of 1.96 mbar between the lowest and highest vacuum pressure of 30.16 and 32.12 mbar, respectively. Though there was little variation in vacuum suction among the 36 nozzles as evident by the mentioned standard deviation, the distribution could be considered uniform and acceptable based on the low range of 1.96 mbar observed between the maximum and minimum vacuum, and the fact that the minimum vacuum of 30.16 mbar is still above the target vacuum of 30 mbar.
Table 2. Variability parameters of pressure distribution in 6 by 6 nozzles manifold
3.3. Pressure distribution and flow rate-vacuum relationship in 9 by 9 nozzles manifold
The variability parameters of pressure distribution among the 81 nozzles were summarized in Table . A minimum and maximum vacuum of 28.62 and 31.41 mbar were observed, respectively. A range of 2.79 mbar and standard deviation of 0.667 were observed. Based on the statistical parameters reported variation in vacuum suction exist between the 81 nozzles, though the variation is not significant to result in multiple seeding.
Table 3. Variability parameters of pressure distribution on nozzles of 9 by 9 nozzles manifold
3.4. Comparison of pressure distribution in the 3 by 3, 6 by 6, and 9 by 9 nozzles manifolds
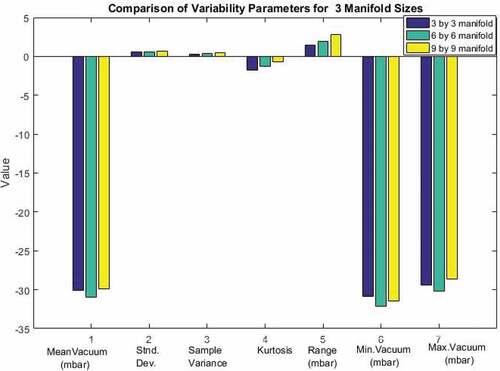
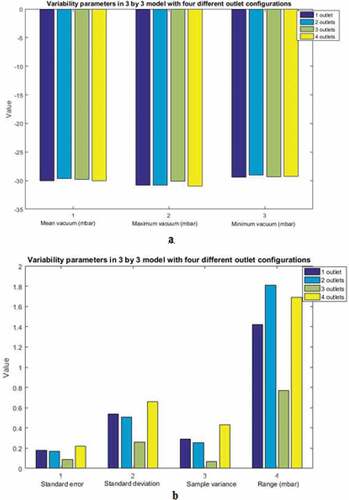
The pressure distributions in the three individual manifolds have been studied. The variability parameters of the three manifolds are compared graphically as shown in Figure . Although the mean vacuum suction in the three nozzles: 30.05; 30.99; and 29.88 mbar for 3 by 3, 6 by 6, and 9 by 9 manifolds, respectively, are not equal, but the difference between the three means is not significant. The standard deviations for the three models are in the order 0.538, 0.613, and 0.667 for 3 by 3, 6 by 6, and 9 by 9 nozzle manifolds, respectively. The standard deviation is higher for bigger models and lower for smaller models. The ranges of the three models were found to be 1.42, 1.96, and 2.79 mbar for 3 by 3, 6 by 6, and 9 by 9 nozzle manifolds, respectively. It was also observed that bigger manifold have higher range values and smaller manifolds have smaller range values. The sample variances were 0.289, 0.375, and 0.445 for 3 by 3, 6 by 6, and 9 by 9 nozzles manifolds, respectively. All the variability parameters have shown the same pattern of variation. This means the variation in vacuum distribution in a nozzle manifold increased with an increase in manifold size or number of nozzles for a particular nozzle manifold type and same seed-hole diameter. The bigger the manifold is, the higher the variation in vacuum distribution will be.
Figure 12. Comparison of pressure distribution between the three sizes of manifold
3.5. Effect of number of manifold suction outlets on pressure distribution uniformity
3.5.1. 3 by 3 nozzle manifold
The effects of four different suction-hole configurations on vacuum pressure distribution uniformity in 3 by 3 nozzle manifold were compared in Figure . In terms of mean vacuum pressure, maximum vacuum pressure, and minimum vacuum pressure (Figure ), the four configurations have negligible difference. In terms of standard deviation, vacuum range and sample variance (Figure ), the difference is also small. Hence, there is no justification for more than one suction hole which has added complexity to the manifold architecture.
Figure 13. Comparison of pressure distribution of four outlet configurations in 3 by 3 nozzles manifold
3.5.2. 6 by 6 nozzles manifold
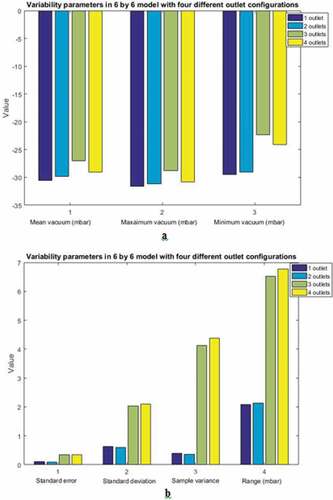
The effects of number of suction-holes on the vacuum pressure distribution uniformity in 6 by 6 nozzle manifold were compared in Figure1. In Figure (a), in terms of mean vacuum pressure the one suction-hole configuration has a higher value than the multiple suction-hole configurations. Even in terms of maximum and minimum vacuum one suction-hole configuration has a better result. The one suction-hole configuration has a better standard error, standard deviation, sample variance and vacuum range values (Figure (b)). Hence, 6 by 6 nozzle manifold with one suction-hole has a better vacuum pressure distribution than manifolds with multiple suction-holes.
Figure 14. Comparison of pressure distribution of four outlet configurations in 6 by 6 nozzles manifold
3.5.3. 9 by 9 nozzles manifold
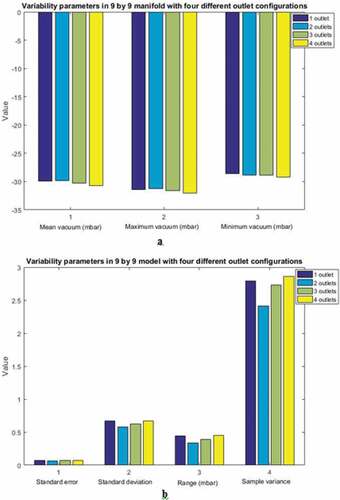
The effects of different suction-hole configurations on the pressure distribution uniformity in 9 by 9 manifolds were compared in Figure . In terms of mean vacuum pressure, maximum vacuum pressure and minimum vacuum pressure (Figure (a)), manifold with single suction-hole produced a better result than manifolds with multiple suction-holes. In terms of standard error, standard deviation, sample variance and vacuum range (Figure (b)), single and double suction-holes produced similar results, which is better than the results of manifolds with three and four suction-holes. Hence, single suction-hole should be used.
Figure 15. Graphical comparison of variability parameters in 9 by 9 nozzle manifold with four outlet configurations
Based on the study conducted on pressure distribution in different number of suction-holes configuration, multiple suction-holes do not have significant advantage over single suction-hole. Hence, there is no justification for multiple suction holes in a seeding manifold with rectangular vacuum chamber.
3.6. Pressure distribution in cylindrical vacuum chamber manifold with 924 nozzles
The pressure distribution among the 924 nozzles in the manifold with cylindrical vacuum chamber type is shown graphically in Figure . The graph showed that vacuum is highest at the nozzles in the left, which is toward the vacuum suction outlet of the distributary cylinder, and the vacuum drops towards the dead end of the distributary cylinder. The variation observed has a clear consistent gradient. From the graph it was observed that each cylinder has a unique variation pattern in vacuum suction among the nozzles attached to it. The findings of this study corresponds to the findings of Hassan, Abdulwahhab, and Kamil (Citation2008) where flow parameters: velocity; pressure; flow rate and wall friction were studied in a flow through a cylindrical manifold with perpendicular laterals of different configurations. Though in that study compression was used instead. The variability parameters for the pressure distribution among the 924 nozzles are presented in Table . A mean vacuum suction and standard deviation of 34.73 and 1.763 mbar were observed, respectively.
Figure 16. Pressure distribution in 924 nozzles of manifold with cylindrical vacuum chamber
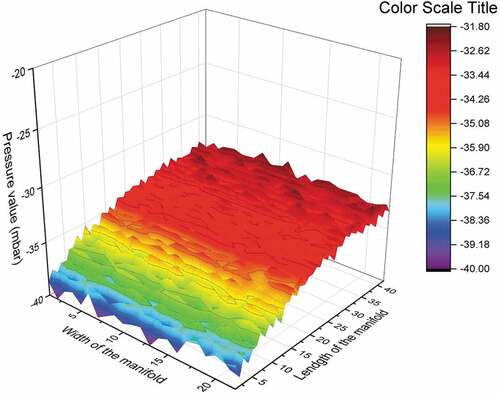
Table 4. Variability parameters among the 924 nozzles of cylindrical chamber manifold
3.7. Pressure distribution in rectangular vacuum chamber manifold with 924 nozzles
The pressure distribution among the 924 nozzles of seeding manifold with the rectangular vacuum chamber type is shown graphically in Figure . Though a little variation was observed between individual nozzles, some level of uniformity was achieved. There was no constant pressure gradient from one end of the manifold to the other end. The vacuum pressure at the nozzles in the center of the manifold has higher variation in vacuum pressure on the higher scale than nozzles at the suction inlet and dead ends of the manifold. That is, vacuum pressure is more uniform and lower at the two ends of the manifold, and the uniformity deteriorates towards the center of the manifold. The same pattern of airflow-pressure distribution was obtained by Dizadji and Sajadian (Citation2011) in the study and design of Oscillating Water Column (OWC) for maximum wave energy harnessing. The summary of vacuum distribution variation parameters among the 924 nozzles of the rectangular vacuum chamber manifold with 924 nozzles is presented in Table . A mean vacuum of 31.94 mbar was achieved, with a standard deviation of 0.475 for the 924 data set. The range of 2.93 mbar achieved entails the higher level of vacuum uniformity achieved. A maximum and minimum vacuum pressures of 33. 76 and 30.82 mbar were achieved, respectively.
Figure 17. Pressure distribution in 924 nozzles of manifold with rectangular vacuum chamber
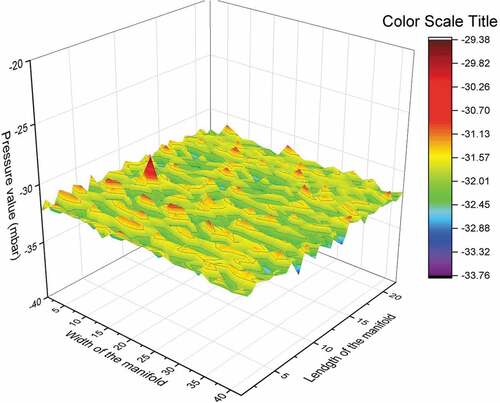
Table 5. Variability parameters among the 924 nozzles of rectangular chamber type manifold
3.8. Comparison of manifolds with cylindrical and rectangular vacuum chambers
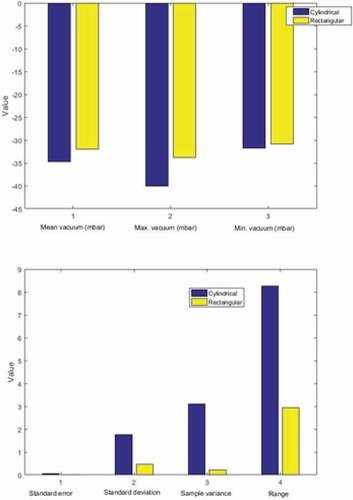
The results of simulation of vacuum distribution in the two manifold designs are compared graphically in Figure . The rectangular manifold with a mean vacuum of 31.94 mbar, standard deviation of 0.475 and a sample variance of 0.226 achieved a vacuum pressure that is closer to the target value of 30 mbar with lower variation in vacuum distribution in comparison to cylindrical manifold with a mean vacuum suction, standard deviation and sample variance of 34.73, 1.7632, and 3.1089 mbar, respectively. Comparison of these variability parameters between the cylindrical and rectangular types manifold have shown that rectangular manifold has a better vacuum distribution than cylindrical manifold with the same number of nozzles in all the variability parameters considered.
Figure 18. Comparison of variation in vacuum pressure between cylindrical and rectangular vacuum manifolds
3.9. Manifold size, airflow rate pressure relationships
The size of seeding manifold represented by number of nozzles on it, the amount of airflow evacuation rate out of the manifold in cfm and the mean vacuum pressure in mbar developed at the tip of the nozzles of manifolds with rectangular vacuum chamber are presented in Table , for the four manifold models with 9, 36, 81, and 924 nozzles considered in this study. EquationEquation 1Eqn. 1
Eqn. 1 is used to relate the number of nozzles, flow rate (cfm), and vacuum pressure (mbar).
Table 6. Relationship between number of nozzles, airflow rate (cfm), and vacuum pressure (mbar)
where,
are the mean vacuum pressure at the nozzle tip (mbar), number of nozzles in a manifold and airflow rate (cfm), respectively.
3.10. Validation of simulation of pressure distribution
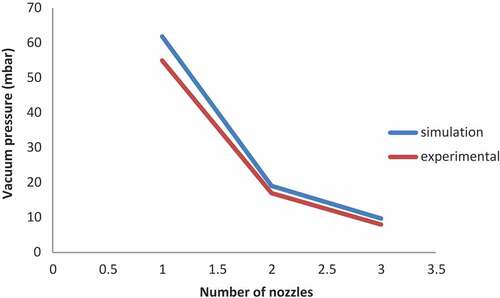
Results of the experimental and simulated vacuum pressure distribution at the seed-hole of the seeding nozzles using one nozzle, two nozzles, and three nozzles were compared in Figure . Though there was little difference between the experimental and simulated results. The simulation and experimental results have a good agreement with one another. The simulation accuracy was found to be 84.6%
Figure 19. Simulation and experimental pressure distribution
4. Conclusions and recommendations
In this study the effect of two designs of seeding manifold: manifold with cylindrical and rectangular vacuum chamber types on vacuum distribution uniformity was investigated. The following conclusions were derived from the conducted studies:
1. The uniformity of vacuum distribution in a manifold with rectangular vacuum chamber type is affected by the size of the manifold (number of nozzles). The smaller the manifold is (few nozzles) the higher the uniformity of vacuum distribution will be. The bigger the manifold is (many nozzles) the lower the uniformity of vacuum distribution will be.
2. The uniformity of vacuum pressure distribution in a seedling tray seeding manifold with rectangular vacuum chamber was not affected by the number of suction-holes on it
3. For two manifolds of equal size and number of nozzles, manifold with rectangular type vacuum chamber has better vacuum distribution uniformity than manifold with cylindrical vacuum chamber.
4. For a vacuum nozzles attached to a vacuum-seeding manifold, the pressure developed at the tip of the nozzle is directly proportional to the air flow rate at the air evacuation hole of the manifold.
5. The size of vacuum pump suitable for a vacuum based pick and place system could be estimated using CFD and CAD model of the proposed system.
6. The use of numerical method in the study of pressure distribution in seeding manifolds, on the basis of which selection of the best seeding manifold configuration was made, has a great economic benefit in engineering design process. It saves a lot of investment in the setting of physical experiment.
7. Based on the simulation results, the seeding manifold with 924 seeding nozzles and rectangular vacuum chamber is better than the seeding manifold with cylindrical vacuum chamber type. Hence, it is recommended for the development of the physical model, for mechanical seeding of paddy seed to SRI-seedling tray.
Acknowledgements
The financial support of Universiti Putra Malaysia through grant number GP-IPB/2014/9442501 and other laboratory facilities are hereby acknowledged.
Additional information
Funding
Notes on contributors
Tukur Daiyabu Abdulkadir
Tukur Daiyabu Abdulkadir completed his PhD program with the Department of Agricultural and Biological Engineering, Universiti Putra Malaysia. His research interest is in agricultural mechanization and Automation, machine design, CAD, agricultural systems optimization and bioprocess. He has his master degree in Agricultural Mechanization and Automation from Universiti Putra Malaysia and first degree from Bayero Universiti Kano, Nigeria. He works with the Department of Agricultural Engineering and Bio-Environmental Technology, Samaru College of Agriculture, Ahmadu Bello University, Zaria. He conducted his master and PhD research in mechanization of the System of Rice Intensification (SRI).
References
- Badar, A. W., Buchholz, R., Lou, Y., & Ziegler, F. (2012). CFD based analysis of flow distribution in a coaxial vacuum tube solar collector with laminar flow conditions. International Journal of Energy and Environmental Engineering, 3(24), 1–20. doi:10.1186/2251-6832-3-24
- Bashar, Z. U., Wayayok, A., Amin, M. S. M., Mahadi, M. R., & Ehsan, S. D. (2015). Single seedling nursery tray : An innovative breakthrough to quality seedling raising technique for SRI transplanting machine. Research Journal of Applied Sciences, Engineering and Technology, 10(11), 1258–1265. doi:10.19026/rjaset.10.1820
- Blocken, B. (2015). Computational fluid dynamics for urban physics : Importance, scales, possibilities, limitations and ten tips and tricks towards accurate and reliable simulations. Building and Environment, 91, 219–245. doi:10.1016/j.buildenv.2015.02.015
- Buccolieri, R., Santiago, J., Rivas, E., & Saanchez, B. (2018). Review on urban tree modelling in CFD simulations. Aerodynamic, deposition and thermal effects. Urban Forestry and Urban Greening .2018(31), 212–220.
- Chen, C., Jung, S., & Yen, S. (2007). Flow distribution in the manifold of PEM fuel cell stack. Journal of Power Sources, 173, 249–263. doi:10.1016/j.jpowsour.2007.05.007
- Dizadji, N., & Sajadian, S. E. (2011). Modeling and optimization of the chamber of OWC system. Energy, 36(5), 2360–2366. doi:10.1016/j.energy.2011.01.010
- Dong, J., Xu, X., & Xu, B. (2017). CFD analysis of a novel modular manifold with multi-stage channels for uniform air distribution in a fuel cell stack. Applied Thermal Engineering, 124, 286–293. doi:10.1016/j.applthermaleng.2017.06.030
- Durner, E. F., Poling, E. B., & Maas, J. L. (2002). Plug Transplant Technology. HortTechnology, 12, 545–550. doi:10.21273/HORTTECH.12.4.545
- Fu, Y., Yuan, J., Yuan, S., Pace, G., Agostino, L., Huang, P., & Li, X. (2016). Numerical and experimental analysis of flow phenomena in a centrifugal pump operating under low flow rates. Journal of Fluids Engineering, 137, 1–12. doi:10.1115/1.4027142
- Gaikwad, B. B., & Sirohi, N. P. S. (2008). Design of a low-cost pneumatic seeder for nursery plug trays. Biosystems Engineering, 99(3), 322–329. doi:10.1016/j.biosystemseng.2007.10.017
- Hassan, J. M., Abdulwahhab, A., & Kamil, B. K. (2008). Flow distribution in manifolds. Journal of Engineering and Development, 12(4), 159–177.
- Hsu, M., Akkerman, I., & Bazilevs, Y. (2014). Finite element simulation of wind turbine aerodynamics : Validation study using NREL phase VI experiment. Wind Energy, 17, 461–481. doi:10.1002/we
- Jafar, M. H., Thamer, A. M., Wahid, S. M., & Wissam, H. A. Experimental and numerical study on the improvement of uniformity flow for three-lateral dividing manifold Jafar, M. H., Thamer, A. M., Wahid, S. M., & Wissam, H. A. (2015). World research and innovation convention on engineering and technology 2014. Malaysia: Putrajaya.
- Jiajia, Y., Yitao, L., Jinling, C., Song, Y., & Qingxi, L. (2014). Simulation analysis and match experiment on negative and positive pressures of pneumatic precision metering device for rapeseed. International Journal of Agricultural and Biological Engineering, 7(3), 1–13. doi:10.3965/j.ijabe.20140703.001
- Karayel, D., Barut, Z. B., & Özmerzi, A. (2004). Mathematical modelling of vacuum pressure on a precision seeder. Journal of Biosystems Engineering, 87(4), 437–444. doi:10.1016/j.biosystemseng.2004.01.011
- Lihong, Z., Christopher, P., & Yi, Z. (2015). CFD modeling of methane distribution at a continuous miner face with various curtain setback distances. International Journal of Mining Science and Technology, 25, 635–640. doi:10.1016/j.ijmst.2015.05.018
- Liu, C., Wang, X., & Wang, Y. (2015). Design and experimental research of a rice precision seeder for plug seedlings. ASABE Annual International, 2015.
- Mahmood, M., Bhutta, A., Hayat, N., Bashir, M. H., Khan, A. R., Ahmad, K. N., & Khan, S. (2012). CFD applications in various heat exchangers design : A review. Applied Thermal Engineering, 32, 1–12. doi:10.1016/j.applthermaleng.2011.09.001
- Nunomura, O., Kozai, T., Shinozaki, K., & Oshio, T. (2016). Seeding, seedling production and transplanting. Plant Factory ( First, pp. 223–235). Rio de Janeiro, Brazil:Elsevier.
- Pal, E., Kumar, I., Joshi, J. B., & Maheshwari, N. K. (2016). CFD simulations of shell-side flow in a shell-and-tube type heat exchanger with and without baffles. Chemical Engineering Science, 143, 314–340. doi:10.1016/j.ces.2016.01.011
- Saco, S. A., Karuppa, R. T., & Karthikeyan, P. (2016). A study on scaled up proton exchange membrane fuel cell with various fl ow channels for optimizing power output by effective water management using numerical technique. Energy, 113, 558–573. doi:10.1016/j.energy.2016.07.079
- Shahril, S. M., Quadir, G. A., Amin, N. A. M., & Anjum, I. (2017). Thermo hydraulic performance analysis of a shell-and-double concentric tube heat exchanger using CFD. International Journal of Heat and Mass Transfer, 105, 781–798. doi:10.1016/j.ijheatmasstransfer.2016.10.021
- Wei, M., Boutin, G., Fan, Y., & Luo, L. (2016). Numerical and experimental investigation on the realization of target flow distribution among parallel mini-channels. Chemical Engineering Research and Design, 3, 74–84. doi:10.1016/j.cherd.2016.06.026
- Wilberforce, T., El-hassan, Z., Khatib, F. N., Al, A., Mooney, J., Barouaji, A., … Olabi, A. (2017). Development of Bi-polar plate design of PEM fuel cell using CFD techniques. Hydrogen Energy, 2, 25663–25685. doi:10.1016/j.ijhydene.2017.08.093
- Wu, Q., Huang, B., Wang, G., & Gao, Y. (2015). Experimental and numerical investigation of hydroelastic response of a flexible hydrofoil in cavitating flow. International Journal of Multiphase Flow, 74, 19–33. doi:10.1016/j.ijmultiphaseflow.2015.03.023
- Xiaolian, L. V., Xiaorong, L. V., Wei, W., & Xiaoqiong, Z. (2016). Numerical simulation and experiment on the adsorption seeds properties of air-suction peanut seed-metering device. International Journal of Simulation: Systems, Science and Technology, 17(26), 1–6.
- Yamauchi, M., Aguilar, A. M., Vaughan, D. A., & Seshu, D. V. (1993). Rice (Oryza sativa L .) germplasm suitable for direct sowing under flooded soil surface. Euphytica Journal, 67, 177–184. doi:10.1007/BF00040619
- Zuo, Y., Ma, X., Qi, L., & Liao, X. (2011). 3-D Turbulence numerical simulation for the flow field of suction cylinder-seeder with socket-slots. International Federation for Information Processing, 344, 1–8.