
 ?Mathematical formulae have been encoded as MathML and are displayed in this HTML version using MathJax in order to improve their display. Uncheck the box to turn MathJax off. This feature requires Javascript. Click on a formula to zoom.
Abstract
Construction projects still face the old–new problem of delivering the projects within the predefined time and cost. This problem becomes more complicated with when addendums and variations are considered during the projects. This study aimed at developing an artificial intelligent model using support vector machine (SVM) technique to predict the time and cost indices of projects. Data from 21 tunnel projects implemented in Kurdistan, Iraq were collected and used in this study. The input data include five variables, namely contract value, contract duration, number of change orders, number of conflicts, and classification of company. WEKA––a set of software for machine learning and data mining––developed at the University of Waikato in New Zealand was used to build SVM model to predict the time and cost indices. The collected data were split by default into a training set of 65%, a testing set of 10% and a validation set of 25%. The results show that SVM model I successfully predicted the cost index not only for the trained data, but also for projects with input parameters out of the range of the training inputs. Mean Absolute Percentage Error (MAPE) and Average Accuracy (AA) for SVM prediction of cost index were found to be 13.9% and 86.1%, respectively. The SVM model II accurately predicted the time index with MAPE and AA of 3.4% and 96.6%, respectively.
PUBLIC INTEREST STATEMENT
The application of support vector machine (SVM) is growing rapidly in the project management sectors. SVMs offer several advantages over traditional methods for the prediction of prediction the time index and cost index. Therefore, during the last few years or so, SVM has been applied successfully to solve many construction engineering problems. SVMs are also being applied to solve problems of project management, where the network is trained on a set of cause–effect data and trained to diagnose observed effects in terms of unknown causes.
1. Introduction
Construction projects are characterized by their complex nature. Hence, decision makers in the construction industry face many challenges due to the limited information and data. Generally, decision-making depends on two important elements: personal experience and the quality of accumulated knowledge Cheng and Andreas (Citation2010). In addition to the technical requirements of drawings and specifications, the successful projects should satisfy the economical requirements, which mainly consist of time and cost boundaries. It can be stated that cost and time are the most important elements of the project, considering that the poor performance in the implementation of construction projects leads to deviation of the quality of these projects on the one hand and deviation in time and cost of the projects on the other hand. Olawale and Sun (Citation2010).
Cost index (CI) and time index (TI) are important parameters that are used to predict the performance of construction projects. These two parameters take into consideration the probable project performance and risks. Construction projects are affected by a wide range of variables that influence the duration and total cost of projects. The two indices are related to each other and they can be good foundation for solving problems related to project management (Csordas Citation2017). Contractual documents indicate that time is the essence of the contract (Rick and Jim Citation2015). From the point of view of the owner, the time performance indicator of the construction project is the completion of the project less than the planned time, and thus the success of the construction project (Meeampol and Ogunlan Citation2006). Predictability of TI was defined as the difference between planned duration and actual duration expressed as a percentage of the planned duration (Zealand Citation2005):
where TI is the time performance, Ta is the actual duration, and Tp is the planned duration.
The cost performance indicator is an important indicator for all stakeholders in project management. The CI is considered to be positive if the planned costs are lower than the actual costs and vice versa (Rick and Jim Citation2015). The CI can be used to calculate the real performance of construction project against the estimated performance (Meeampol and Ogunlan Citation2006). Predictability of cost performance in construction projects was defined as the difference between the actual cost and the contractual cost, and thus can be expressed as a percentage of the contractual cost as follows (Zealand Citation2005):
where CI is the cost performance, Ca is the actual cost, and Cp is the contractual (planned) cost.
Predicting construction project costs and estimating price escalation are major stages for construction project contractors and owners. Construction project costs are always subject to fluctuations that trend toward increasing over the long term, which make the costing process a challenging task. CI has been widely used to forecast project costs.
Through the previous studies and research on the subject of artificial intelligence, it was found that artificial intelligence has the ability to overcome all difficulties and obstacles in the various processes in the management of construction projects. Despite the many techniques of artificial intelligence attached to the subject of prediction, it did not reach the peak of its potential because of the omission of state-of-the-art techniques and the inappropriate handling of missing data (Chongchong, Fourie, Ma, and Tang Citation2018). The number of studies and research on the CI and time in the field of project management is limited, and the most prominent previous studies have been obtained are discussed below.
Moon and Shin (Citation2017) developed time-series forecasting model to have significant impact on the CI. The forecast result obtained using the interrupted time series forecasting model was better than that using the conventional forecast models; the accurately forecasted CI using the presented model will help in budget planning and evaluating the bid as well as estimate the risk of future projects.
In this study, suggest a novel approach for the improved forecast of construction engineering projects depended on nonesuch machine learning algorithms.
2. Research objective
Main aim of this study is to develop of the forecasting model for predict the performance of CI and TI using support vector machine (SVM) technique for tunnel projects at execution and monitoring stage.
3. Research important
In developed countries, tunnels project is very important because it represents one of infrastructure projects and it has a prominent civilized worth. Also, the tunnels projects contribute greatly to solving the problem of traffic congestion, in addition to the movement of individuals and vehicles, and goods transportation. Also, tunnels projects are a clear demonstration of urban development in the country.
There are many methods and techniques used in the field of forecasting in the project implementation stage, but most of these techniques suffer from many disadvantages and shortcomings. The most important of which is lack of precision. Therefore, the project management sector in the Kurdistan region of Iraq in dire need of new, sophisticated and effective techniques to predict the performance of tunnels projects must be characterized by accuracy, simplicity and flexibility. This study is important because it provides a new method for measuring the performance of construction projects and evaluates the performance of tunnels projects at execution and monitoring stage by using an intelligent mathematical model such as SVM Technique.
The research as adds a reference to knowledge field for both academic researches and stakeholders in evaluation of the performance in infrastructure projects.
4. Research limitations
This study was conducted in Kurdistan, Iraq for the period from April to 2017 to May 2018.
5. Research hypotheses
Thus, based on this research the following hypotheses have been proposed:
Null hypothesis (H0): SVM is a powerful technique to predict the performance of CI and TI for tunnel projects at execution and monitoring stage.
Alternatives hypothesis (H1): SVM is not a powerful technique to predict the performance of CI and TI for tunnel projects at execution and monitoring stage.
6. Research methodology
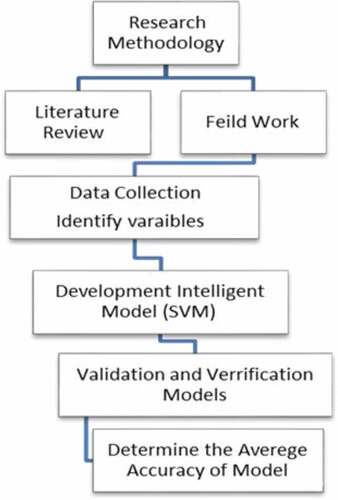
Research methodology used to accomplish the aim is summarized in Figure .
Figure 1. Research methodology
6.1. Literature review
The purpose of the literature review was to cover the subject of the study fully through the access to books and research, master’s thesis and doctoral studies and studies on the subject of evaluating the performance of construction projects that were published in the periodicals and conferences.
One of the important machine-learning theories is SVM that is promptly founded on learning algorithms and uses regression method (Liu, Yan, Zhao, and Yue Citation2016). The foundations of SVM were developed by Vapnik (Citation1995)at Bell Laboratories. In general, the technology of SVM is used in many fields of engineering. The most important field is computer and information systems and the field of statistics and mathematics and the field of engineering and project management and others.
Artificial intelligence was found to have the ability in prediction of many engineering parameters. In project management, artificial intelligence was used to predict the duration, cost, productivity, earned value management, cash-flow, CI and TI. SVM can be classified into the following types (Cheng and Andreas Citation2010).
6.1.1. A- classification SVM type 1
For this type of SVM, training involves the minimization of the error function:
Subject to the constraints:
where C is the capacity constant, w is the vector of coefficients, and b is a constantthat represents parameters for handling no separable data (inputs). The index i label the N training cases. Note that represents the class labels and xi represents the independent variables.
6.1.2. B- classification SVM type 2
In contrast to Classification SVM Type 1, the Classification SVM Type 2 model minimizes the error function:
Subject to the constraints:
Also, SVM can be classified based on regression method.
The task is then to find a functional form for f that can correctly predict new cases that the SVM has not been presented with before. This can be achieved by training the SVM model on a sample set, i.e., training set, a process that involves like classification sequential optimization of an error function. Depending on the definition of this error function, two types of SVM models can be recognized (Cheng and Andreas Citation2010):
6.1.3. A- regression SVM type 1
For this type of SVM, the error function is given by
which we minimize subject to:
6.1.4. B- regression SVM type 2
For this SVM model, the error function is given by
which we minimize subject to:
6.2. Data collection and identification of variables
Data of 21 tunnel projects performed in Kurdistan, Iraq were used in this study. All the information was formally obtained from the documents of the projects. In addition, interviews with managers of the projects were carried out by the authors. The interviews were mainly focused on the possible factors that affect the cost and time indices.
On the basis of the literature review of the cost and time indices and results of the interviews with the managers of the 21 tunnel projects, the following five parameters were selected as the main factors that affect the cost and time indices:
Contract Value (CV): the CV of the 21 projects was ranged from 9 to 30 billion Iraqi dinars (B, ID).
Contract Duration (CD): the CD of the projects ranged from 360 to 480 days.
Number of Change Orders (NCO): All the projects included from associated with change in cost and time of the projects were obtained from the projects’ documents. The NCO was ranged from 2 to 25.
Conflicts (CC): CC can be occurred in the site because of many reasons. The CC were classified into complicated CC, moderate CC, and simple CC and they were assigned numbers of 1, 2, and 3, respectively.
Classification of Contracting Company (CCC): Iraqi regulations classify contracting companies in descending order from Class 1 to Class 4. Only the three higher classes were involved in construction of the 21 tunnels. Numbers of 1, 2, and 3 were assigned to companies of class 1, 2, and 3, respectively.
These parameters were used as inputs in the SVM models, while TI and CI were used as outputs. Table depicts the inputs and outputs of the 21 tunnel projects. The table also contains some statistical functions such as standard deviation (SD) and average (Ave.) of input and output parameters.
Table 1. Inputs and outputs of the 21 tunnel projects
The table clearly shows that the TI ranged from 35 to 309%, meaning that durations of the projects were extended as minimum as one-third of the CD. The time extension reached as maximum as three times the CD. The CI of the projects ranged from 0.12 to 17.14% with an average and standard deviation of 5.87% and 4%, respectively. The table also depicts some statistical measures including standard deviation and average values of the input and output parameters.
6.3. WEKA software
There are many programs that use SVM. The most popular programs are MATLAB, LIBSVM, STATISTICA, DTREG, SVM light, WinSVM, and WEKA and others (Al-Zwainy and Neran Citation2016).
The researcher used the WEKA program version 3.7.13©1999-2015 for the following reasons:
WEKA is available and open source. Also, it can be obtained from University of Waikato, New Zealand.
WEKA workbench is a collection of state-of-the-art machine-learning algorithms and data pre-processing tools.
WEKA is easy and simple to use.
WEKA can be run in any operating system such as Macintosh, Linux, and Windows.
WEKA offers identical interfaces to many learning algorithms.
WEKA contributes to the organization and coordination of data and provides integrated support for learning systems.
6.4. Building and development SVM models
The development stage of the model is an important stage in the design of the SVM model. This stage includes the operation of the developed model and training to many the times with validation of the model.
To capture the relationships between the inputs and output, the SVM model requires to be trained. Data of the 21 tunnel projects were divided into three groups; training group, testing group and validation group. The training group included data of 13 projects, while testing and validations groups included 5 and 3 projects, respectively. The distribution of projects on the groups was randomly performed using the default parameters of WEKA software.
“Kernel” in machine learning refers to Kernel trick––a tool that uses a linear classifier to solutions of non-linear problems. It entails transforming linearly inseparable data to linearly separable ones. Kernel function is applied on each data instance to transfer the original non-linear relationship into a higher-dimensional space in which it becomes separable. There are many kinds of kernel functions that are commonly used including Sigmoid, Polynomial, Radial basis function, triangle, Epanechnikov, Silverman, tricube, cosin, triweight, quadratic, Gaussian, and Logistic (Al-Zwainy, Eiada, and Khaleel Citation2016).
The reliability and accuracy of each kernel function were measured using root mean square error (RMSE), given in EquationEquation (1(1)
(1) ), and correlation coefficient (R2) (Jaber, Hachem, and Al-Zwainy Citation2019):
where Yact is the actual value of the output variable, Ypred is the value of output predicted by SVM, and n is the number of data point.
Table shows the RMSE and correlation coefficient of all kernel functions. It can be seen that the polynomial function has the lowest RMSE and highest correlation coefficient of 0.05% and 97%, respectively. Hence, polynomial function was used to model the prediction time and cost indices.
Table 2. RMSE and correlation coefficients of various kernel functions
6.5. Parameters of SVM model
The insensitivity zone ε and the penalty parameter C are among the most important learning parameters in the development of the SVM model. These parameters determine the trade-off between the training error and VC dimension of the model. Trial-and-error approaches were used to determine the optimum values of ε and C (Kecman Citation2001).
The optimum C value was determined through measuring the effect of different values of C on RMSE and R2 of the SVM having the polynomial function and structure of 65% training, 25% testing and 10% validation sets. RMSE and R2 of various values of C parameter are shown in Figures and , respectively.
Figure 2. Effect of C value on RMSE of model
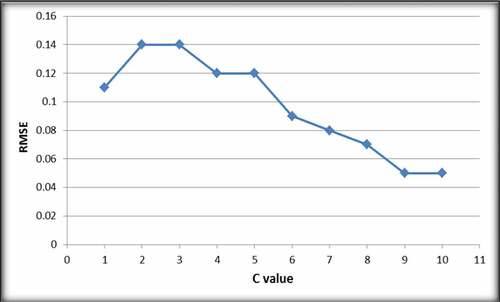
Figure 3. Effect of C value on correlation coefficient of model
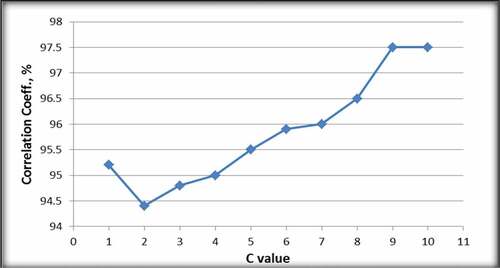
C value of 9 resulted in the lowest RMSE of 0.05 and the highest correlation coefficient of 97.5% as it can be seen in Figures and , respectively. Hence, C value of 9 was selected.
The same approach was applied to select the optimum value of ε. Figures and show the effect of various values of ε on RMSE and correlation coefficient of SVM Model.
Figure 4. Effect of ε values on RMSE of SVM model
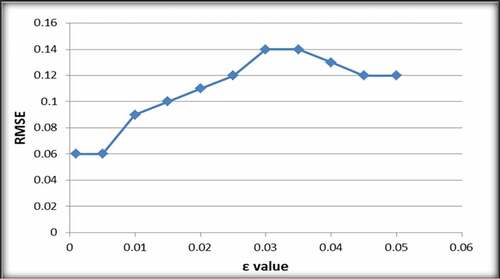
Figure 5. Effect of ε values on correlation coefficient of SVM model
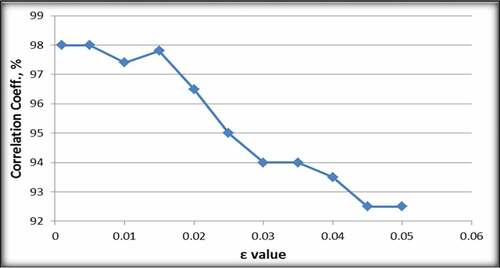
Figures and show that an ε value of 0.005 resulted in the lowest RMSE value (0.06) and the highest correlation coefficient of 98%. Hence, an ε value of 0.005 was selected.
The type of kernel function (polynomial) and the values of C and ε were fed to the WEIKA software and the weights of the inputs and outputs were obtained from the software report. Table depicts the weights of the input and output parameters.
Table 3. Weights of inputs and outputs extracted from WEKA software
The report also provided the value of θ1 which is the weight from node in the hidden layer to node in the output layer. The value of θ1 was found to be (−2.00006). On the basis of values of weight of inputs and outputs obtained from the run of the SVM, the predicted cost and time indices can be calculated as follows:
6.6. Verification SVM model
To verify the developed model, the researcher used five new projects as shown in Table .
Table 4. Verification of SVM model
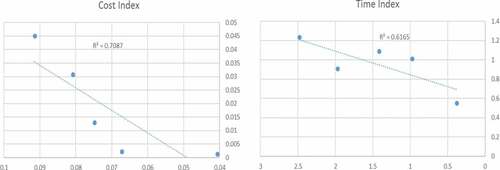
Summary of CI and TI by SVM for verification of predicting model is shown in Table . In the table, the second column presents CI (actual and predicting), and the third column represents TI (actual and predicting), where actual values CI and TI can be obtained using WEKA software by applying SVM equations.
Table 5. Comparison between actual and predicting value for (CI) and (TI)
Figure shows the correlation coefficients of the TI and the CI 78.7% and 83.4%, respectively, as these results show that the developed SVM model has an effective predictability of actual values in the future.
Figure 6. Correlation between actual and predicting value for CI and TI
6.7. Validation SVM model
This stage presented the validation of the SVM model. The performance measures are important to evaluate model; the following two parameters can be used to calculate the SVM model performance.
Mean Absolute Percentage Error (MAPE)
The MAPE can be calculated through the equation of the Boussabaiena et al. (1999) through which it is possible to know the amount of error allowed in the SVM model developed (AL-Somaydaii, Aljumaily, and AL-Zwainy Citation2018):
(2) Average Accuracy (AA):
The model’s AA% can be calculated by mathematical equation (EquationEquation 6)(6)
(6) discovered by Wilmot and Mei (Citation2005), (Al-Zwainy, Al-Suhaily, and Saco (Citation2015), and Al-Zwainy and Neran (Citation2015):
The results of the comparative study of the SVM model show that the MAPE of the CI and TI were 13.95902% and 3.43285%, respectively, while AA% for the CI and TI were 86% and 96.572%, respectively, so the developed SVM model is very effective in future prediction (see Table ).
Table 6. MAPE % and AA % for CI and TI
7. Conclusions
To evaluate the performance of the tunnels projects in the Republic of Iraq, a smart model was developed using the SVM technique to predict the CI and the TI based on five factors (CV, CD, NCO, CC and CCC). A mathematical equation was derived to measure the CI and TI by AA 86.1% and 96.6%, respectively.
Conflicts of Interest
The authors declare that they have no conflicts of interest.
Data Availability
The data used to support the findings of this study are available from the corresponding author upon request.
Acknowledgements
The authors thank Dr. Ibrahim A. Mohammed from Al-Isra University in Jordan for providing us advice and guidance and for checking this paper linguistically and scientifically.
Additional information
Notes on contributors
Firas Kh. Jaber
Assistant Professor Firas Kh. Jaber has Ph.D Construction project Management, M.Sc. Structural Engineering, B.Sc. In Civil engineering, He is a member of Arab Engineers Union, Consultant and international arbitrator in the Iraqi engineers Union, expect and arbitrator in various disputes (2011-now). Professional trainer in the consultation bureau and the Iraqi Engineers Union, conducting engineering courses and programs pertaining project management (2011-now).
Faiq M. S. Al-Zwainy
Dr. Faiq M. S. Al-Zwainy was born in Iraq. He completed his bachelor degree in civil engineering in 1996 and Master’s degree in 2000 from Al-Mustansiriya University, Baghdad, Iraq. He completed his PhD in 2009 from Baghdad University (BU), Baghdad, Iraq. He is the member of PMI (Project Management Institute). Currently, he is working as a professor in College of Engineering/Al-Nahrain University, Iraq. His research interest includes artificial neural network in project management. The experimental work of this research was implemented in Iraq, and this research aims to provide a statistical approach for prediction the time index and cost index.
Saba W. Hachem
Assistant Lecture Saba W. Hachem M.Sc. environment Engineering, B.Sc. In Civil engineering, she is a member of Iraq Engineers Union.
Related Research Data
References
- AL-Somaydaii, A. J., Aljumaily, H. S. M., & AL-Zwainy, F. M. S. (2018). Utilization multifactor linear regression technique for prediction the earned value in bridges projects. Journal of Engineering and Applied Sciences, 13(7), 1676–13. http://medwelljournals.com/abstract/?doi=jeasci.2018.1676.1682
- Al-Zwainy, F. M., Eiada, A. A., & Khaleel, T. A. (2016). Application intelligent predicting technologies in construction productivity. American Journal of Engineering and Technology Management, 1(3), 39–48.
- Al-Zwainy, F. M. S., Al-Suhaily, R. H., & Saco, Z. M. (2015). Project management and artificial neural networks: Fundamental and application. Jermany: LAP LAMBERT Academic Publishing.
- Al-Zwainy, F. M. S., & Neran, T. H. (2015). Investigation and evaluation of the cost estimation methods of Iraqi communication projects. International Journal of Engineering and Management Research, IJEMR, 5(6), 41–48.
- Al-Zwainy, F. M. S., & Neran, T. H. (2016). Application artificial forecasting techniques in cost management. Journal of Engineering, 22(8), 1–15.
- Cheng, M. Y., & Andreas, F. V. (2010). Evolutionary fuzzy decision model for construction management using support vector machine. Expert Systems with Applications, 37(8), 6061–6069. doi:10.1016/j.eswa.2010.02.120
- Chongchong, Q., Fourie, A., Ma, G., & Tang, X. (2018). A hybrid method for improved stability prediction in construction projects: A case study of stope hanging wall stability. Applied Soft Computing, 71, 649–658. doi:10.1016/j.asoc.2018.07.035
- Csordas, H. (2017). An overview of the time-cost trade-off problems of project planning. Procedia Engineering, 196, 323–326. doi:10.1016/j.proeng.2017.07.206
- Jaber, F. K., Hachem, S. W., & Al-Zwainy, F. M. (2019). Calculating the indexes of earned value for assessment the performance of waste water treatment plant. ARPN Journal of Engineering and Applied Sciences, 14(4), 792–802.
- Kecman, V. (2001). Learning and soft computing: Support vector machines, neural networks, and fuzzy logic models (pp. 179–184). Cambridge, Massachusetts London, England: Massachusetts Institute of Technology.
- Liu, J., Yan, K., Zhao, X., & Yue, H. (2016). Prediction of autogenous shrinkage of concretes by support vector machine. International Journal of Pavement Research and Technology, 9, 169–177. doi:10.1016/j.ijprt.2016.06.003
- Meeampol, S., & Ogunlan, S. O. (2006). Factors affecting cost and time performance on highway construction projects: Evidence from Thailand. Journal of Financial Management of Property and Construction, 11(1), 3–20. doi:10.1108/13664380680001076
- Moon, T., & Shin, D. H. (2017). Forecasting construction cost index using interrupted time-series. KSCE Journal of Civil Engineering, 22(11), 1–8.
- Olawale, Y. A., & Sun, M. (2010). Cost and time control of construction projects: Inhibiting factors and mitigating measures in practice. Construction Management and Economics, 28(5), 509–526. doi:10.1080/01446191003674519
- Rick, B., & Jim, M. (2015). Measuring construction (1st ed.). New York, NY: Routledge.
- Vapnik, V. (1995). The nature of statistical learning theory. New York: Springer.
- Wilmot, C. G., & Mei, B. (2005). Neural network modeling of highway construction costs. Journal of Construction Engineering and Management, 131(7), 765–771. doi:10.1061/(ASCE)0733-9364(2005)131:7(765)
- Zealand, K. N. (2005). The New Zealand construction industry national key performance indicators wallchart 2005 data. New Zealand: Centre for Advanced Engineering Christchurch.