
 ?Mathematical formulae have been encoded as MathML and are displayed in this HTML version using MathJax in order to improve their display. Uncheck the box to turn MathJax off. This feature requires Javascript. Click on a formula to zoom.
Abstract
This research investigated the use of cow dung (CD), poultry dung (PD) and cow dung/poultry dung for the bioremediation of artificially contaminated soil with petrol using response surface methodology. The application of cow dung and poultry dung to the contaminated soil was done through a statistical approach and the Box–Behnken design of experiment was adopted using design expert 6.0.8 software. The percentage of petrol removed was used as the response to assess the biodegradation. Experimental results revealed 84–96% for petrol degraded. Analysis of results showed that the quadratic model fitted best with R2 value of 95.85% of petrol removed and the results were also significant at probability values of 0.0487, 0.0114, 0.0113, 0.0001, 0.0016, 0.0234 and 0.003, respectively, were less than 0.05. The optimum process conditions obtained were 2.54 g CD, 3.34 g PD and 2.41 g CD/PD for the percentage of petrol removed and it gave a percentage of petrol removed as 99% from day 5 and then attained equilibrium. A graph of days vs percentage of petrol removed was plotted. Furthermore, biochemical test was carried out on the soil and three of the microorganisms were used also for the bioremediation. The microorganisms are Bacillus, Aspergillus and E. coli, respectively. The best degrader of petrol from the microorganism was Bacillus in which the percentage of petrol removed was 92%. This indicates that augmenting artificially contaminated soil with petrol with cow dung and poultry dung will enhance remediation and restoration of the polluted soil.
PUBLIC INTEREST STATEMENT
The absolute requirement for promoting sustainable development of our society with low environmental impact is to eradicate a wide range of pollutants and waste from the environment. Since the mid-nineteenth century, petroleum has been used for lightening for many decades and on a smaller scale as a lubricant. Hydrocarbon-contaminated soils have effective damage to local ecosystems as the acquisition of pollutants in animals and tissue of plants can cause death or mutation of the progeny. Petroleum’s toxic components turn arable land into poor soils and end the existence of the environment’s aesthetic quality. Increasing global use of petroleum and its products has resulted in severe soil and groundwater contamination. Indeed, the adverse impacts of pollutants on the environment and human health care varied and rely on the nature of pollution. In today’s globe, there is agitation about urbanization, industrialization, population rise and pressure on natural resources.
1. Introduction
The absolute requirement for promoting sustainable development of our society with low environmental impact is to eradicate a wide range of pollutants and waste from the environment. Since the mid-nineteenth century, petroleum has been used for lightening for many decades and on a smaller scale as a lubricant (Varjani, Citation2017). Hydrocarbon-contaminated soils have effective damage to local ecosystems as the acquisition of pollutants in animals and tissue of plants can cause death or mutation of the progeny. Petroleum’s toxic components turn arable land into poor soils and end the existence of the environment’s aesthetic quality. Increasing global use of petroleum and its products has resulted in severe soil and groundwater contamination (Lim, Von Lau, & Poh, Citation2016). Indeed, the adverse impacts of pollutants on the environment and human health care varied and rely on the nature of pollution. In today’s globe, there is agitation about urbanization, industrialization, population rise and pressure on natural resources. This challenge is exacerbated by extreme modifications that have been occurring in people’s manner of life and custom. The nature and the size of the issues are consistently changing, bringing new difficulties and making a constant demand for fresh and more appropriate technologies (Dindar, Sagban, & Bas¸ Kaya, Citation2013).
Hydrocarbons are referred to as the most common primary energy and fuel resources in the world. Human activities during exploration and distribution by accidents often cause accidental discharge or spillage. Therefore, hydrocarbon is an inclining pollutant of soil and water (Abbasian, Lockington, Mallavarapu, & Naidu, Citation2015). Microorganisms such as bacteria, fungi, microalgae have the potential of degrading petroleum hydrocarbons. It was reported in the literature that researchers had identified that different bacteria had been used in hydrocarbon degradation. Carbon and energy sources have been discovered as the metabolic equipment used by microorganisms to utilize petroleum products (Andreolli, Lampis, Brignoli, & Vallini, Citation2015). Molecular structure of the hydrocarbons, types of microbial population and ideal environmental circumstances to boost the bioavailability of the contaminants is among the variables that microorganisms use in degrading the contaminants (Rizzo et al., Citation2010).
In removing toxic and hazardous substances from the setting, bioremediation, a bio-friendly technique has been used. Bioremediation is a technology for environmental pollutants which restores and prevents further pollution in the initial natural setting (Zhao et al., Citation2017). Bioremediation can either be in-situ or ex-situ; in-situ remediation is the implementation of bioremediation in the subsurface while when soil is taken from the subsurface for rehabilitation is ex-situ bioremediation. Bioremediation is detoxifying by genetically engineered microorganisms from artificially contaminated soils or groundwater by man (Khudur et al., Citation2015). However, bioremediation is a microbial process and provision among other limiting factors such as nutrients is required for the process. Facilitation of aeration through small pores is by the addition of organic waste materials such as poultry litter (PL) and coir pith (CP) which enhances bioremediation. Bioremediation involves the breakdown of hydrocarbon and organic contaminants by soil organisms such as fungi, bacteria and plants for the improvement and enhancement of life. Complex or simple chemical compounds are converted into non-hazardous forms by biological agents by mutation. Oil bioremediation involves decomposition of organic pollutants and conversion to harmless products such as carbon dioxide, water and biomass by soil organisms. This approach makes use of indigenous oil-consuming microorganisms (Ron & Rosenberg, Citation2014). Gaur, Flora, Yadav, & Tiwari (Citation2014) described bioremediation as cost-effective, ecologically friendly treatment of oil-contaminated sites by the utilization of microorganisms. Many single or group of microorganisms is accounted for pollutant degradation. Molecular techniques are generally utilized these days to confirm the presence of degradative microflora in any contaminated sites. Degradation by microbes, however, is impacted by various Physiochemical and ecological parameters, for example, nutrients, electron acceptors or donors and pH and temperature (Klimek, Sitarz, Choczynski, & Niklinska, Citation2016). Bioremediation of crude-oil-polluted soil is becoming an increasingly important remedial option. Advantages that arise from bioremediation among other remedial alternatives such as physical and chemical treatments are the fact that it is cost-effective, environmentally friendly and ease of use of the process. This research work is aimed at bioremediation of artificially contaminated petroleum soil using animal waste (cow and poultry dung) using Box–Behnken design and to the best of our knowledge no work has been done via this noble approach.
2. Materials and methods
2.1. Materials
The soil sample used for this research work was gotten from Landmark University, Civil Engineering Department workshop Omu-Aran Kwara state, Nigeria, from the top horizon of 0–30 cm. The soil samples were dried, homogenized and passed through a 2 mm (pore size) sieve and stored in a polybag. Organic fertilizers were being prepared by collecting animal dungs (cow and poultry) from the Landmark University Teaching and Research Farm. The animal dungs were sun-dried, ground and sieved to obtain uniform size particles. The agars were prepared following the procedures given by the manufacturer, in line with the quantity needed. Autoclaving was done at 121°C for 15 min at 15 atm. (pressure).
2.2. Preparation of media
2.2.1. Preparation of culture media (nutrient agar)
The required quantity of 2.8 g of nutrient agar was weighed into a 500 mL conical flask. One hundred milliliters of distilled water was added and mixed to allow homogenization in the mixture using the heater. The conical flask was carefully corked with foil paper and cotton wool and allowing the mixture to soak for 5 min. It was later soaked; therefore, the medium was sterilized by autoclaving at 121°C for 15 min. The medium was allowed to cool at 45°C after sterilization. The medium was dispensed into sterile petri dishes. Gelation of the medium was allowed to take place for 30 min and incubating the already prepared agar for 24 h.
2.2.2. Preparation of eosin methylene blue agar
About 3.8 g of the medium was weighed and poured into a sterilized 500 mL conical flask after which 100 mL of distilled water was added and mixed. It was cotton plugged with foil paper and cotton wool and soak for 5 min. It was then sterilized by autoclaving at 12°C for 15 min. The medium was dispensed into sterile petri dishes; after which it was incubated for 24 h.
2.2.3. Preparation of potato dextrose agar
About 3.9 g of potato dextrose agar was weighed into a 500 mL conical flask after which 100 mL of water was added and mixed to allow homogenization. The conical flask was corked with foil paper and cotton wool and then allowed to soak for 5 min. After soaking, the medium was sterilized by autoclaving at 120°C for 15 min and then allowed to cool at 45°C. The medium was dispensed into sterile petri dishes. Gelation of the medium was allowed to take place for 30 min and the already prepared agar was incubated.
2.2.4. Preparation of MacConkey agar
MacConkey agar was prepared by weighing 5.2 g of the medium into a sterile conical flask after which one 100 mL of distilled water was added and mixed continuously allowing a fast dissolution of the agar. Furthermore, after 10 min of solution boiling, the sample was sterilized by autoclaving at 121°C for 15 min. The medium was dispensed aseptically, poured in each sterile petri dish. Plates were allowed to gel after which were incubated for 24 h, and sterility check was carried out by incubating the already prepared agar.
2.3. Isolation and identification
2.3.1. Bacteria isolation of the soil
Soil sample of 1 g was weighed and dispensed into a conical flask containing 50 mL of distilled water and mixed together by shaking and labeled as stock solution. One milliliter was taken using a pipette from the stock solution and put into the first test tube containing 9 mL of distilled water (the test tubes were already sterilized by autoclaving at 121°C for 15 min) and mixed by shaking thoroughly and labeled as 10−1. One milliliter was drawn from the test tube of 10−1 and dispensed into the second test tube labeled 10−2 and mixed by shaking. The same process was done for the remaining test tubes 10−3, 10−4, 10−5, 10−6 and 10−7. This process is called serial dilution. However, after serial dilution, 1 mL was taken from test tubes 10−3, 10−4, 10−5, 10−6 and 10−7 dispensed into five petri dishes, nutrient agar was then poured into the five plates then allowed to solidify. The same procedure was done for PDA and EMB. After solidifying they were inverted and kept in the incubator at 37°C for 24 h, while PDA was inverted and kept in the incubator at 27°C.
2.3.2. Sub-culturing
After 24 h, different microorganisms grown on the plate were carefully injected onto different nutrient agar, EMB and PDA (fungi), and another agar called MacConkey was prepared to inject the microorganism for bacteria. The plate was inverted and incubated (37°C) for 24 h.
2.3.3. Gram staining
Gram’s Stain is one of the most frequently used processes in identifying bacteria and is used daily in hospitals. It is a primary test that quickly and cost-effectively divides bacteria into one of the two types: Gram-positive or Gram-negative. To identify the microbes grown, Gram staining technique was used to distinguish between the Gram’s positive and Gram’s negative organisms. A smear of bacteria was applied on to a slide, it was air-dried and then heated by passing it through a flame a few times. A few drops of crystal violet were added to the culture and allowed to stand for 1 min; the slide was rinsed in water for 5 sec. Gram’s iodine was then applied on the smear and allowed to stand for 1 min allowing the formation of dye-iodine complex in the cytoplasm of the bacteria cell. The slide was then tilted and decolorized with solvent (acetone solution) for 5 sec and then rinsed and shaken to remove excess. The slides were finally treated with safranin (counterstain since the safranin is lighter than crystal violet, it does not disrupt the purple coloration in Gram-positive cells) and allowed to stand for 1 min and then washed briefly with water and shaken off to remove excess. It was then allowed to dry before examining under a microscope.
2.3.4. Biochemical test
Biochemical test was carried out to identify the microbes involved in the reactions. The tests include citrate test, methyl red (MR) and Voges–Proskauer (VP). Citrate utilization test was carried out by preparation of slopes of the medium (Simmon’s citrate agar) in bijou bottle as instructed by the manufacturer. Using a sterile inoculating loop, the test organism was streaked on the medium and incubated at 37°C for 24 h. After incubation, the observation of a blue color indicates that the organism can utilize citrate while no color change indicates that such an organism cannot utilize citrate. The methyl red test was carried out to determine whether the microbe performs mixed acid fermentation when supplied with glucose. The microorganism is inoculated with MR broth and incubated for 4 days. FIve drops of methyl red indicator solution were added. A positive response is when the medium turns from yellow to red. Positive control microorganism includes E. coli. Voges–Proskauer test is to determine if an organism produces acetyl methyl carbinol from glucose fermentation. The microorganism is incubated at 37°C for 24 h. Add two drops of Barrit’s reagent. A positive response is when it changes from yellow to a pink-red color after 30 min of shaking vigorously.
2.3.5. Soil sample and organic fertilizer characterization
The soil and the organic manure were analyzed for Physiochemical parameters, using standard methods. Parameters such as the following were evaluated: pH, total alkalinity, total nitrogen (TN), total ammonia (TA), total phosphorus (TP), phosphate and sulphate. Metals such as calcium, potassium, aluminum, magnesium, manganese, total zinc (TN), total iron (TI), total nickel (TN) were analyzed.
2.4. Experimental design and data analysis
The Box–Behnken design was employed with three variables: cow dung, poultry dung and cow dung/poultry dung. Each of the independent amendment variables was studied at three levels, with 17 experimental runs. The variables optimized were cow dung in the range of 0–5 g, poultry dung in the range of 0–5 g and cow dung/poultry dung in the range 0–5 g, respectively. The percentage of petrol removed was considered as the response. Efficiency of petrol removal was assessed after 5 days. Petrol contaminated soil without micro-organisms or any of the variables was assayed as control. The statistical software Design Expert 6.0.8 (Stat-Ease Inc., Minneapolis, USA) was used to evaluate the analysis of variance (P < 0.05), to determine the significance of each term in the fitted equations and to estimate the goodness of fit in each case. The samples put in petri dishes and labeled run 1–17 were extracted with 50 mL of n-hexane as a solvent using separating funnels. Afterwards, the petrol and n-hexane mixture was separated to obtain the amount of petrol left by using Soxhlet extractor and incubated in a water bath at 78°C.
The degradation rate of petrol was determined according to the following EquationEquation (1)(1)
(1) :
where Rp is the degradation rate of petrol oil; Cin and Cout are concentrations of petrol in the soil before bioremediation and the concentration of petrol remaining after bioremediation.
3. Results and discussion
3.1. Physiochemical analysis of soil samples
The physical and chemical properties of soil samples before and after contamination are shown in Table . This is carried out for the comparison of nutrients in the soil before and after contamination, the results also show how significant bioremediation will be in treating contaminated soil to retain its physical and chemical properties. However, it was observed that some chemical properties change after the addition of petroleum into the soil while some stayed the same way. Tables and show the physical and chemical properties of poultry droppings and cow dungs (Forsyth, Tsao, & Bleam, Citation1995; Yerushalmi et al., Citation2003)
Table 1. Result of physiochemical analysis of the soil samples
Table 2. Physical and chemical properties of poultry droppings
Table 3. Physical and chemical properties of cow dung
3.2. Microbial composition
The microbial analysis carried out as depicted in Table on the soil showed the presence of different aerobic and anaerobic microorganisms. Thus, 11 different microorganisms were inoculated in the soil and 3 of them were used in the degradation experiment. The bacteria were all hydrocarbon-degrading (Adams, Fufeyin, Okoro, & Ehinomen, Citation2015; Danjuma, Abdulsalam, & Sulaiman, Citation2012; Drzewiecka, Citation2016; Subathra, Immanuel, & Suresh, Citation2013). The microorganisms from the soil used for the bioremediation are Aspergillus (fungi), Bacillus and E. coli (bacteria) because from the theory they have been proved to be the best and most commonly used. Table showed the percentage of petrol removal by Aspergillus, Bacillus and E. Coli, respectively.
Table 4. Isolated microorganisms from virgin soil
Table 5. Percentage removal of petrol
It was observed that the bacteria (Bacillus) degraded the soil better and faster after 5 days and the best degrader as a microorganism.
3.3. Statistical analysis
The results in Table show how cow dung, poultry dung and the combination of cow dung and poultry dung affect the degradation in the soil. There were 17 runs given by the design expert and a control experiment. The variables optimized were cow dung in the range of 0–5 g, poultry dung in the range of 0–5 g and cow dung/poultry dung in the range 0–5 g, respectively. The percentage of petroleum removed (%) was considered as the response (Y).
Table 6. Experimental runs for cow dung, poultry dung and cow dung/poultry dung
Degradation was allowed to occur and data were collated after 5 days. It was observed that the highest percentage removal was at 96%, a combination of poultry dung at 5.00 g and cow dung at 2.5 g. This shows that the combination of cow dung and poultry dung without the addition of cow dung/poultry dung has a positive effect on the degradation of the soil hence increasing the percentage removal in the soil. While the lowest percentage removal was at 84%, a combination of poultry dung at 5.00 g, cow dung at 5.00 g and cow dung/poultry dung at 2.5 g. This shows that the combination of cow dung, poultry dung and cow dung/poultry dung has a negative effect on the degradation of the soil hence affecting the percentage removal in the soil.
3.4. Analysis of variance (ANOVA) and regression equation
The ANOVA results as depicted in Table show that the Model F-value of 17.96 implies the model is significant. Values of “Prob > F” less than 0.0500 indicate model terms are significant. In this case, B, C, A2, B2, C2, AC, and BC are significant model terms.
Table 7. Analysis of variance (ANOVA) on the petrol percentage removal
The coefficients of a single factor (i.e., the ones in front of A, B and C) represent the effects of that particular factor, while the coefficients of two factors (i.e., the ones in front of AB, AC and BC), where applicable, and those of second-order terms (i.e., the ones in front of A2, B2 and C2) represent the interaction between the two factors and quadratic effects, respectively (Yerushalmi et al., Citation2003). Values greater than 0.1000 indicate the model terms are not significant. If there are many insignificant model terms (not counting those required to support hierarchy), model reduction may improve your model. The “lack of fit F-value” of 2.26 implies the lack of fit is not significant relative to the pure error. There is a 22.34% chance that a “lack of fit F-value” this large could occur due to noise. Non-significant lack of fit is good—we want the model to fit.
The regression equation showed that the percentage of petroleum biodegradation was an experimental function of test variables in coded units. The experimental data were fitted to a second-order polynomial regression model containing three linear, three quadratic and three interaction terms using the same experimental design software to derive the regression equation for diesel removal as stated in EquationEquation (2)(2)
(2) :
where β0 is the value of the fixed response at the center point of the design; β1, β2 and β3 are linear coefficients; β12, β13 and β23 are quadratic coefficients and the interaction effect coefficient regression terms, respectively; A, B and C are the levels of independent variables.
The significance of each coefficient in the equation was determined by F-test and P-values. F-test showed that not all the factors and interactions considered in the experimental design were statistically significant, i.e., p< 0.05, at 95% confidence level. The regression equation obtained after analysis of variance gave the level of petrol biodegradation as a function of the cow and poultry dungs. All the significant terms excluding the insignificant terms are included in the equation.
The sequential model sum of squares, lack of fit tests and model summary statistics were presented in Table and Table . The numerator of the general linear F-statistic, i.e., SSE(R) − SSE(F) is what is referred to as sequential model sum of squares. Lack of fit error is the error that occurs when the analysis omits one or more important terms or factors. Pure error occurs for repeated values of dependent variable Y, for a fixed value of independent variable, X.
Table 8. Sequential model sum of squares, lack of fit tests, model summary statistics
3.5. Validation of results
These runs were carried out from the selected values given by the design expert of cow dung 2.54 g, poultry dung 3.34 g and cow dung/poultry dung 2.41 g. The results as depicted in Table and Figure showed that the percentage of petroleum removed from the soil increases rapidly and remain constant after 5 days. At this point, it is called equilibrium. In the control experiment, the percentage of petrol biodegradation in natural biodegradation reached 80% in 5 days. It was indicated that the biological process of natural attenuation that may occur on the control by chemical reaction and evaporation. The addition of cow and chicken dung on petrol contaminated soil increased the efficiency of petrol biodegradation.
Figure 1. Graph of time vs % petrol removed. (This graph shows the degradation rate in the soil.)
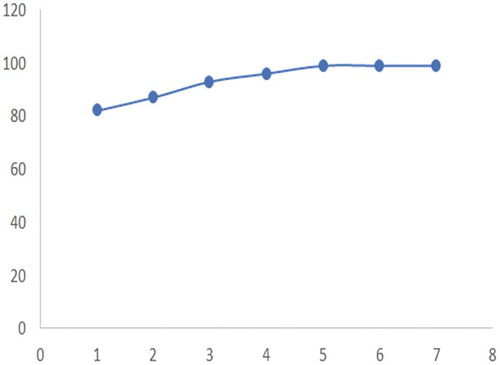
Table 9. Lack of fit tests
Table 10. Percentage of petrol removed for the selected optimal values
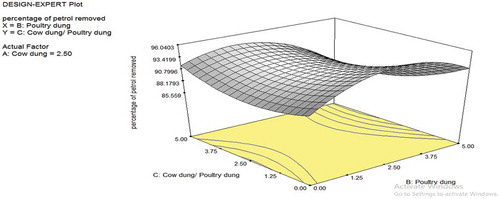
3.6. 3-dimensional plots
The dimensional plots for the cow dung and poultry dung interaction are depicted in Figures –. Figure shows the effect of cow dung and poultry dung on the percentage removal of petroleum in the soil. The interaction as seen in the plots is minimal with F-value of 0.23. The poultry dung interaction is more as compared to the cow dung in terms of singular interaction. Figure shows that the bioremediation effect is relatively flat as seen in the 3D contour plots; the 3D plot shows it actually as a saddle or minimal nature. The saddle is a surface that curves up in one direction, and curves down in a different direction, resembling a riding saddle or a mountain pass between two peaks forming a landform saddle. This implies that the biodegradation is stable for most part of the values uses in the plot. As the cow dung composition increases, higher removal percentage was observed. The exit of the saddle is observed at the upper quadrant of the 3D contour plot at values of cow dung higher than 3.75 and cow dung/poultry dung ratio higher than 2.5. Hence, for effective bioremediation of petrol, the cow dung and cow dung/poultry dung ratio should be maintained with the ranges that allow for optimal removal of petrol. Figure shows a similar saddle nature as Figure . However, the contour lines are more pronounced indicating the fact that with the poultry dung, the removal of petrol has a higher level of sensitivity to the low and extreme values of poultry dung and at all levels of the cow dung/poultry dung ratio.
Figure 2. Plot of cow dung to poultry dung
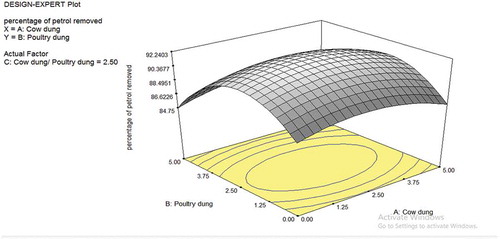
Figure 3. Plot of cow dung to the ratio of C/P dung using P factor
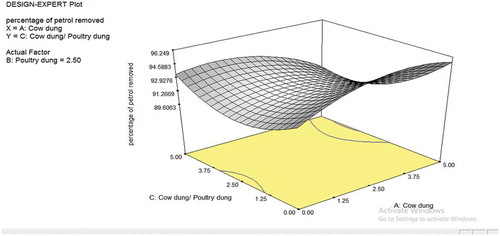
Figure 4. Plot of cow dung to the ratio of C/P dung using C factor
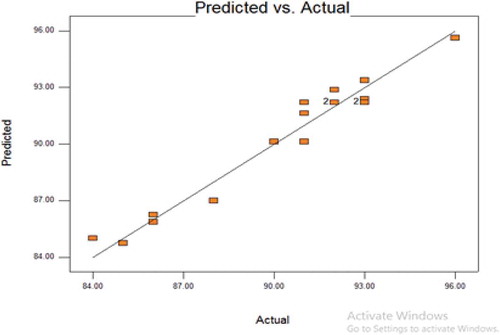
To further validate the model fitness, diagnostic plots such as predicted versus actual and normal residual plots used as shown in Figures and respectively. Residual shows the difference between the observed value of the response measurement and the value that is fitted under the theorized model. Small residual values indicate that model prediction is accurate (Figure ). Figure shows the predicted versus the actual plot of petrol degradation. Actual values were determined for a particular run and the predicted values were calculated from the approximating function used for the model. The result showed that a linear relationship exists between the actual and predicted values thereby indicating that the model equations adequately predict the petroleum removal within the limit of the experimental condition investigated.
Figure 5. Normal plot of residuals
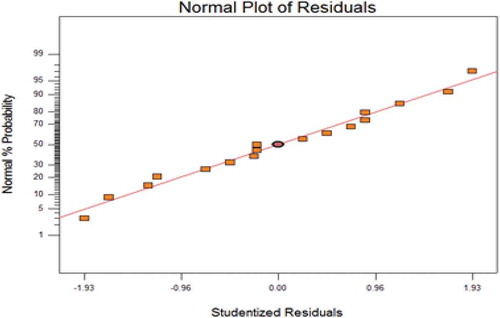
Figure 6. Plot of actual versus predicted
4. Conclusion
This study showed that optimizing animal dungs were highly successful for cleanup of the artificially contaminated petrol-polluted soil. The study was designed to determine the degradation of petrol and its optimization using Box–Behnken design. It showed that the use of bio-augmentation and biostimulation was remediative to petrol contaminated soil. The variation of cow dung, poultry dung, cow dung/poultry dung and microorganisms was observed to be very significant. Furthermore,; microorganisms of Bacillus, E. coli and Aspergillus indicated that the best degrader for petrol was at 92% removal. Box–Behnken is dependable and effective tool for modeling and optimization of petrol bioremediation processes; the highest removal from the design was 96%. The predicted optimum conditions of cow dung at 2.54 g, poultry dung at 3.34 g and cow dung/poultry dung at 2.41 g were validated and it gave 99% petrol removal from the soil.
Author statement
The release of hydrocarbons into the environment whether accidentally or due to human activities is the main cause of soil and water pollutions. Soil contaminated with hydrocarbons causes extensive damage to local systems as a result of their accumulation in animals and plant tissues which may result in death and mutations. Many technologies are being employed for soil remediation with varying degrees of success, they include the use of high temperature (incineration), dispersion and washing, landfill among others. However, most of these technologies are expensive and not environmentally friendly. In light of the above, bioremediation which involves the use of cow and poultry dung to reduce or detoxify hydrocarbon contaminants as a result of its diverse metabolic capabilities, versatility of application, effectiveness and relatively low cost is the most appropriate for the decontamination of soil contaminated with petroleum and other hydrocarbon-contaminated sites (soil and water).
Additional information
Funding
References
- Abbasian, F., Lockington, R., Mallavarapu, M., & Naidu, R. (2015). A comprehensive review of aliphatic hydrocarbon biodegradation by bacteria. Applied Biochemistry and Biotechnology, 176, 670–15. doi:10.1007/s12010-015-1603-5
- Adams, G. O., Fufeyin, P. T., Okoro, S. E., & Ehinomen, I. (2015). Bioremediation, biostimulation and bioaugmention: A review. International Journal of Environmental Bioremediation & Biodegradation, 3(1), 28–39.
- Andreolli, M., Lampis, S., Brignoli, P., & Vallini, G. (2015). Bioaugmentation and biostimulation as strategies for the bioremediation of a burned woodland soil contaminated by toxic hydrocarbons: A comparative study. Journal of Environmental Economics and Management, 153, 121–131. doi:10.1016/j.jenvman.2015.02.007
- Danjuma, B. Y., Abdulsalam, S., & Sulaiman, A. D. I. (2012). Kinetic investigation of Escravos crude oil contaminated soil using natural stimulants of plant sources. International Journal of Emerging Trends in Engineering and Development, 2(5), 478–486.
- Dindar, E., Sagban, F. O. T., & Bas¸ Kaya, H. S. (2013). Bioremediation of petroleum contaminated soil. Journal of Biological and Environmental Sciences, 7, 39–47.
- Drzewiecka, D. (2016). Significance and roles of proteus spp. bacteria in natural environments. Microbial Ecology, 72(Issue 4), 741–758. doi:10.1007/s00248-015-0720-6
- Forsyth, J. V., Tsao, Y. H., & Bleam, R. D. (1995). Bioremediation: When is bioaugmentation needed? In R. E. Hinchee, J. Fredrickson, & B. C. Alleman (Eds.), Bioremediation for site remediation (pp. 1–14). Columbus, Ohio: Battelle Press.
- Gaur, N., Flora, G., Yadav, M., & Tiwari, A. (2014). A review with recent advancements on bioremediation-based abolition of heavy metals. Environmental Science: Processes & Impacts, 16(2), 180–193. doi:10.1039/C3EM00491K
- Khudur, L. S., Shahsavari, E., Miranda, A. F., Morrison, P. D., Nugegoda, D., & Ball, A. S. (2015). Evaluating the efficacy of bioremediating a diesel-contaminated soil using ecotoxicological and bacterial community indices. Environmental Science and Pollution Research, 22, 14809–14819. doi:10.1007/s11356-015-4624-2
- Klimek, B., Sitarz, A., Choczynski, M., & Niklinska, M. (2016). The effects of heavy metals and total petroleum hydrocarbons on soil bacterial activity and functional diversity in the upper silesia industrial region (Poland). Water, Air, and Soil Pollution, 2, 227–265.
- Lim, M. W., Von Lau, E., & Poh, P. E. (2016). A comprehensive guide of remediation technologies for oil contaminated soil-present works and future directions. Marine Pollution Bulletin, 109, 14–45. doi:10.1016/j.marpolbul.2016.04.023
- Olawale, O., Oyawale, F. A., Adepoju, T. F., Aikulolu, S., & Akinmoladun, A. I. (2015). Optimization of diesel polluted soil using response surface methodology. International Journal of Environmental Protection and Policy, 3(6), 194–202. doi:10.11648/j.ijepp.20150306.13
- Rizzo, A. C. D. L., Dos Santos, R. D. M., Dos Santos, R. L., Soriano, A. U., da Cunha, C. D., Rosado, A. S., … Leite, S. G. (2010). Petroleum-contaminated soil remediation in a new solid phase bioreactor. Journal of Chemical Technology & Biotechnology, 85, 1260–1267. doi:10.1002/jctb.v85:9
- Ron, E. Z., & Rosenberg, E. (2014). Enhanced bioremediation of oil spills in the sea. Current Opinion in Biotechnology, 27, 191–194. doi:10.1016/j.copbio.2014.02.004
- Subathra, M. K., Immanuel, G., & Suresh, A. H. (2013). Isolation and identification of hydrocarbon degrading bacteria from Ennore creek. Bioinformation, 9(3), 150–157. doi:10.6026/bioinformation
- Varjani, S. J. (2017). Microbial degradation of petroleum hydrocarbons. Bioresource Technology, 223, 277–286. doi:10.1016/j.biortech.2016.10.037
- Yerushalmi, L., Rocheleau, S., Cimpoia, R., Sarrazin, M., Sunahara, G., Peisajovich, A., … Guiot, R. S. (2003). Enhanced bioremediation of petroleum hydrocarbons in contaminated soil. Bioremediation Journal, 7(1), 37–51. doi:10.1080/713914241-274
- Zhao, J., Gui, L., Wang, Q., Liu, Y., Wang, D., Ni, B. J., … Yang, Q. (2017). Aged refuse enhances anaerobic digestion of waste activated sludge. Water Research, 123, 724–733. doi:10.1016/j.watres.2017.07.026