
 ?Mathematical formulae have been encoded as MathML and are displayed in this HTML version using MathJax in order to improve their display. Uncheck the box to turn MathJax off. This feature requires Javascript. Click on a formula to zoom.
Abstract
In a jet dragster race car, the engine mount is one of the important components of an engine sub-assembly. The mounting system is the primary interface between the jet engine and the vehicle chassis, firmly containing the engine and transmitting forces to/from the engine to chassis. The jet dragster, being a high-performance vehicle, subjects its engine mount to high stresses, while requiring as low of weight as possible. The main function of the engine mount and the bracket is to properly balance the engine on the vehicle chassis and maintain its position. Strength of the mount is of high significance since it may lead to structural failure if the resulting vibration and stresses are severe and excessive, thus resulting in catastrophic consequences upon mount failure. The present work focuses on the Finite Element Analysis of an engine mount for application in a jet dragster using the FEA tool ANSYS. Static analysis, modal analysis and harmonic response analysis are carried out, by which maximum von-Misses stress and natural frequency are computed and the system’s frequency response is determined. The main objective of this study is to reduce the weight of the engine mount by suitably developing an alternate design with an optimized topology to contribute to overall weight reduction and hence enhance the vehicle’s performance and reduce manufacturing costs.
PUBLIC INTEREST STATEMENT
In a jet dragster race car, the engine mount is a very important component of an engine structure. The mounting system is the primary interface to transmit the force of the engine to propel the vehicle forward and maintain the engines position. The dragster, being a high-performance vehicle, subjects its engine mount to high stresses, while requiring as low of weight as possible. Strength of the mount is of high significance since it may lead to structural failure if the resulting vibration and stresses are severe and excessive, thus resulting in catastrophic consequences upon mount failure. The work presented in this paper focuses on the analysis of an engine mount for application in a jet dragster using the advanced software tool ANSYS. Different analysis techniques were carried out to ensure the redesigned mount matches or exceeds the performance of the original mount, while being lower in weight and remain easy to manufacturer.
1. Introduction
A jet dragster is a high-powered race car powered by a jet engine. It is predominantly used for setting land speed records and in drag race competitions. The Green Monster powered by a General Electric J79 jet engine was the first jet-powered drag racing vehicle. It attained its four-wheeled design with a 22 ft long body in the 1960s and was able to reach a top speed of 285 kph (177 mph). With advancements in science and technology, dragsters today can reach a top speed of 350 mph in a quarter mile long race. With aircraft engines reconfigured to race applications, a jet dragster can reliably produce 22 kN (5000 lbf) of afterburner thrust and travel at approximately 300 mph in 6 s, consuming up to 5.7 l of fuel every second.
Reduction in vehicle mass is a continuous demand in high-performance automotive and aerospace applications. Vehicular weight reduction, while maintaining adequate performance and safety, is of interest in race car applications and the National Hot Rod Association (NHRA) drag race competitions are no exception. In automotive applications, weight reduction can improve vehicle performance by reducing rolling resistance and the energy required for acceleration, thus improving fuel efficiency Ghorpade et al. (Citation2012). Both vehicle acceleration and safety are critical factors for a lightweight and structurally sound vehicle design.
A critical component of the design process for a high-performance dragster is the structural analysis and a primary area of concern is the engine mounts. Secondary to the safety of the structural components is the manufacturability of the various components to ensure feasibility and reduced cost. With growing popularity and advancing technology, the need for higher engine power and improved performance is increasing, thereby providing an opportunity for improvement in the design of engine mounting system. The typical dragster’s engine mounting system is made of metal components with high strength characteristics to endure high loading conditions. The mounting system is the primary interface between the jet engine and the vehicle chassis, rigidly containing the engine and transmitting forces to/from the engine to chassis. The dragster, being a high-performance vehicle, subjects its mount(s) along with other structural members to high static and dynamic stresses; therefore, keeping the stresses under a pre-determined level of safety should be achieved by careful design and analysis of the mount components. The engine mount must be constructed and located such that the engine thrust is aligned with the centerline of the vehicle. Canted thrust is often a result of non-concentricity and the off-axis thrust line will lead to vehicle motion instability. Thus, careful design and analysis of the engine mounts are essential.
2. Literature review
Vinchurkar & Khanwalkar (Citation2016) conducted their research in Finite Element Analysis (FEA) and Topology Optimization of a road vehicle engine mounting bracket with the objective of optimization for weight reduction. The optimized mounting structure is required to have appropriate stiffness in order to avoid excessive vibrations and noise. The engine load acting on each of the mounting structures is computed and with these boundary conditions strength and stress analysis were performed to identify the structure’s behavioral characteristics and verify that the results are within an acceptable range. The structure was rigidly fixed at the bottom of the mount and a force was applied at the top of the mount with a force of 1500 N. Once boundary conditions and force loads were applied in order to obtain a baseline FEA result, the topology of the mount was optimized resulting in a suitable reduction in mass. The optimized mount was found to have higher stress values (compared to the original structure) but was still within the acceptable range.
Benaouali et al. (Citation2016) in their study about design optimization of a very light aircraft engine mount, first identified the different types of loading conditions (or load cases) experienced by the system. Loads were applied at the center of gravity of the structure and the mounting locations were rigidly fixed. The structure needed to have appropriate strength and stiffness to resist different load cases, all while achieving a minimal mass. The engine’s vibrational frequencies corresponding to its maximum and nominal rotational speeds were computed and the optimal design structure’s natural frequencies were identified to ensure the system was safe from resonance.
Pan et al. (Citation2007) performed structural optimization of an engine mount bracket and in their study implemented two types of structural optimization methods, topology and shape optimization: the latter is usually applied to optimized topology for further mass reduction. The methodology involved defining the initial design space in an FE model as the primary step and ensured that the defined design space does not interfere with other parts. The optimized design is further shape optimized. One of the major problems in topology optimization is manufacturability of the optimized model. Thus, novel draw direction constraints are applied to the topology optimization. The obtained optimized design must be suitably altered by taking into consideration manufacturability and other constraints.
Patil & Naghate (Citation2012) in their study of the modal analysis of an engine mount bracket attempted to reduce the weight of the bracket component, thereby contributing to overall vehicular weight reduction. With studies showing that brackets can save up to 38% of weight, structural and material optimization of engine mounting brackets were performed. Magnesium was found to a better option for the bracket material and the modal analysis showed that the frequencies for the magnesium bracket were lower than that for aluminum bracket. With the revised design having a natural frequency which is lower than the excitation frequency of the engine bracket, the design was considered safe.
Lucas et al. (Citation2006), optimized the topology of a bell crank used in a Formula SAE student competition race car in 2006. The new 2006 bell crank was compared to that used in the 2005 competition. Altair OptiStruct topology optimization software was used in order to reduce weight from the 2006 bell crank model whilst maintaining yield strength. Given the results, they had a 24.3% mass reduction from the 2005 model. The 2006 bell crank had a mass of 140 g and obtained a yield increase of 30% (15.9 kN yield load). The results also demonstrated that weight reduction helps vehicular performance. Their 2006 car’s final weight was of 223 kg (2005 model was 246 kg) and ended up third place in the competition. Their time recorded in the 75-m acceleration event was of 4.137 s. This is a drastic improvement to the car model they had in 2005 which ran a time of 4.634 s.
Kala & Kiran (Citation2015) performed a modal analysis using ANSYS in order to find the natural frequencies at different modes. Reverse engineering was implemented by physically obtaining measurements of a V6 engine mount bracket for a bus. With the given measurements a CAD model was generated in CREO. Results from the modal analysis demonstrated that the use of computer-aided engineering programs can help to give simple visualization of the analysis. This helps with the detection of early problems given the design and helps determine what the outcome of the model will be. This means implementing more simulation techniques and reducing physical prototypes in order to achieve the same goal.
Benur & Akshatha (Citation2015) implemented a 2-step finite element-based optimization process to reduce weight while satisfying strength parameters of a typical aircraft engine aluminum mount bracket. The first step is to search optimum material distribution followed by the second step which involves using finite element sizing and shape optimization in order to satisfy strength-based parameters. Given the results, this study demonstrated that there was a 20.17% overall weight reduction using this 2-step FE base optimization technique for the aluminum bracket. This new bracket not only weights less which is super important in the aerospace industry but also maintains the desired strength parameters.
3. CAD modeling & finite element analysis
The Finite Element Method (FEM) is a numerical approximation method in which the complex structure is divided into several small parts called finite elements. Topology optimization is a useful feature in FEM tools, enabling an engineer to identify parts in an assembly that are overdesigned or unnecessary to fulfil the structural requirements. Topology optimization identifies regions of a structure where material density can be minimized, thus providing scope for optimized designs. The FEM tool used here is ANSYS Workbench 19.0. Topology optimization allows specifying where supports and loads are located on a volume of material, the optimization region, and the constraints to meet the desired requirements.
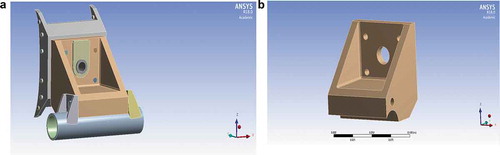
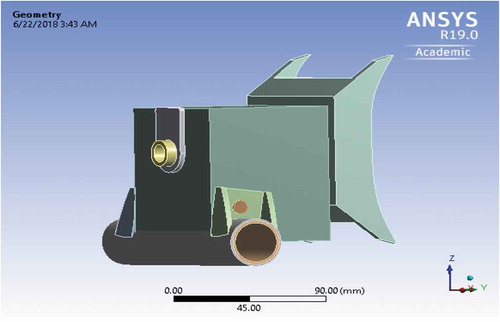
The current/existing engine mount was modeled using the Siemens SolidEdge CAD tool. The mount assembly is shown in Figure ,). The designed model was exported into ANSYS to perform structural analysis. The engine mount is made of Aluminum 6061-T6511H and the material properties can be found in (Sapa Extrusion North America, Citation2017).
Figure 1. (a) Engine mount assembly. (b) Original engine mount
3.1. Static structural analysis
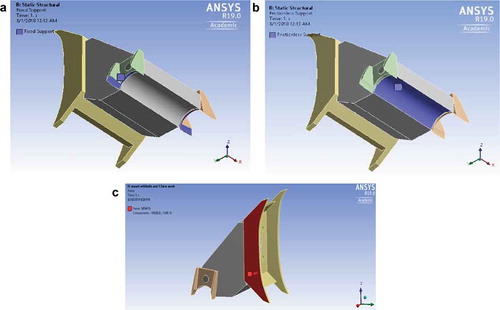
A static FEA structural analysis was performed to obtain the displacements, stresses, strains and forces acting on a structure or a component due to the applied loads under given constraints (boundary conditions). The loading conditions can be either externally applied force or pressure, inertial loads, displacements or temperature conditions. For the engine mount assembly, the bottom curved surface of the mount where it makes contact with the chassis is taken as a frictionless support, the bottom surfaces of the brackets are set as a fixed support and a force of 22 kN is applied in the negative x-direction, i.e. the axial direction of the jet engine. A force of 1600 N is applied in negative z-direction accounting for the weight of the jet engine. There are two mounting positions for the engine on the chassis and the load is assumed to be distributed equally between them, hence a single mount will be subjected to 11 kN axial thrust and 800 N in—z-direction on each side. Given the extreme performance nature of the jet dragster vehicle, a safety factor of 1.5 is considered, resulting in applied forces equaling 16.5 kN and 1200 N in the x and -z directions, respectively. The boundary conditions are shown in Figure –).
Figure 2. (a) Fixed support on mounting tabs welded to the chassis. (b) Frictionless support engine mount sitting on chassis. (c) Combined applied force from the jet engine
3.2. Modal analysis
Modal analysis provides the natural frequencies and corresponding mode shapes of a system. If the forcing function’s frequency matches a natural frequency of the system, a resonant condition occurs. It is important to know these natural frequencies at which the structure can be excited by engine-generated vibrational forces. The modal analysis of the engine mount was carried out to determine the natural frequencies and shapes of the natural vibration modes. This also allowed for verification of any natural frequencies that would be excited by the jet engine’s excitation frequencies (which are usually broad spectrum, i.e. 60 Hz to 1600 Hz) (Farby & Ceskovic, Citation2017). A total of six modes were analyzed for both mounts.
As stated in section 4, the old mount design, the frequencies obtained begin from 1057 Hz (mode 1) and end 5614.6 Hz (mode 6) where frequency gradually increases after mode1 and reaches the value for mode 6. For the optimized mount, the range of frequency goes from 439.6 Hz (mode 1) to 5062.2 Hz (mode 6). A static structural analysis is required first for performing prestressed modal analysis.
3.3. Harmonic response analysis
Harmonic response analysis helps predict the response (i.e. displacement) of a structure if it is excited at one of its natural frequencies. This type of analysis enables the verification of the design, i.e. predicts whether the design can withstand fatigue. The structural response at several frequencies (including the natural frequencies) was obtained and a graph of displacements (or any other response quantity) versus frequency was also obtained. “Peak” responses are then identified on the graph and corresponding stress amplitudes were reviewed. The forcing frequency range was determined by the frequency or frequencies applied to the structure due to the harmonic loading. The jet engine produces dry thrust (12.5kN) at a maximum RPM of 16,550. Hence, the vibrational fundamental excitation frequency can be computed as follows: (Benaouali et al., Citation2016). A jet engine, however, presents many harmonics of its fundamental frequency, which could excite the structure’s natural frequency.
This analysis technique calculates only the steady state, forced vibrations of a structure. The transient vibrations, which occur at the beginning of the excitation, are not accounted for in a harmonic response analysis. The transient response is not considered at the mount’s lowest natural frequency, which as described in Section 4 was found to be over 1000 Hz (1057 Hz) for the original mount and over 400 Hz (439.6 Hz) for the optimized mount, sufficiently above the maximum forcing frequency.
3.4. Topology optimization
Structural design problems are usually bounded by performance constraints that are defined by specific design objectives. Arriving at a design solution that satisfies the performance criteria and fulfils the stated objectives is an iterative process, usually requiring several iterations using finite element analysis. Topology optimization is a new numerical method used to determine the optimum shape and material distribution within a given design space for a given set of design constraints. The results of topology optimization do not necessarily have to be the best solutions, but they provide a basic framework of the optimized design solution.
In this case, the optimization objective was set to be mass reduction with the response constraint being the percentage of reduction in mass. With an iterative process and varying the mass reduction percentage each time, a rough framework of the material distribution within the design space was achieved. As shown in Section 4.2, different percentages of weight reduction iterations were done in order to make sure that there was enough material left to maintain bolt locations whilst reducing the original mount’s weight.
While arriving at a final design solution, other factors were also taken into consideration such as ease of machining/manufacturability, bolting locations, etc. Therefore, the end result changed from Figure where most of the material is gone and manufacturability is nearly impossible to the design seen in Figure . Today this method is widely accepted for bracket-type structures and has already proven to be a huge benefit to many of the large aerospace and automotive corporations.
4. Results of Fea analysis
4.1. Original mount
4.1.1. Deformation and stress analysis
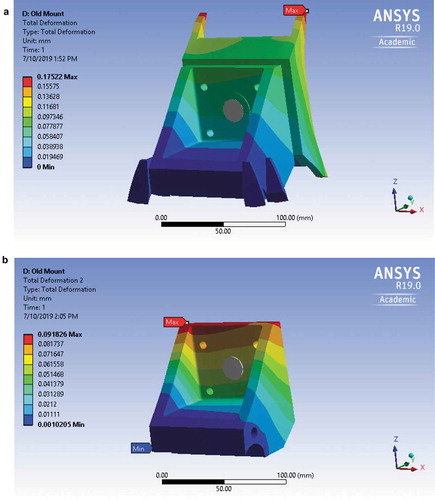
A static structural analysis was performed to determine total displacement and the equivalent (Von-Mises) stress induced in the mount, as the Von Mises failure criterion will be used for design. These results are shown in Figures and respectively. Figures ) and 4() illustrate the results of the entire mount assembly due to static loading, while Figures ) and 4() show the same solution only for the engine mount that was to be optimized. The mount is made of aluminum 6061-T6H11 and has a yield strength of 260 MPa. A uniform fine mesh was generated in ANSYS 19.0. A fine mesh sizing was used with an element size of 2.0 mm for improved solution accuracy. From the results of this simulation, the maximum deformation of 0.18 mm occurs on the ends of the mainframe. The maximum deformation on the mount is 0.092 mm at the region in contact with the mainframe.
Figure 3. (a) Total deformation of assembly. (b) Total deformation of mount
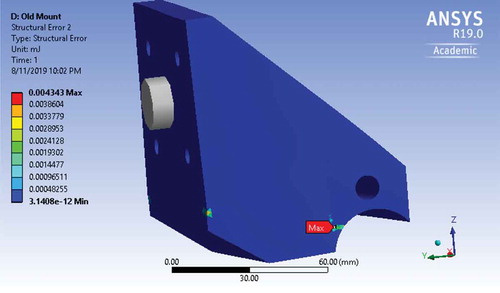
The results of stress analysis show the maximum stress of 247.4 MPa occurs on the mainframe, as shown in Figure ); however, since this current study is focused on the mount structure and not the entire assembly, the stress distribution for the mount alone was isolated and is shown in Figure ). The maximum stress induced in the mount is 116.78 MPa, with a slight stress concentration in the bottom part of the mount where the chassis is in contact with the mount and is also close to the mounting tabs that are welded to the chassis (Figure )). Initially, the largest structural error was located at the same area where the largest stresses were being shown. After considerable mesh refinement, the maximum structural error of 0.0043 mJ was shifted to the side of the mount near where the chassis mounts are located as shown in Figure .
Figure 4. (a) Stress distribution in mount assembly. a-2: Stress distribution in mount assembly close-up. (b) Stress distribution in engine mount. b-2: Stress distribution in engine mount close-up
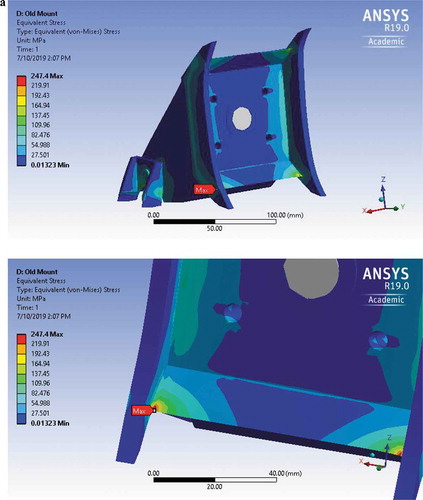
Figure 4. (Continued)
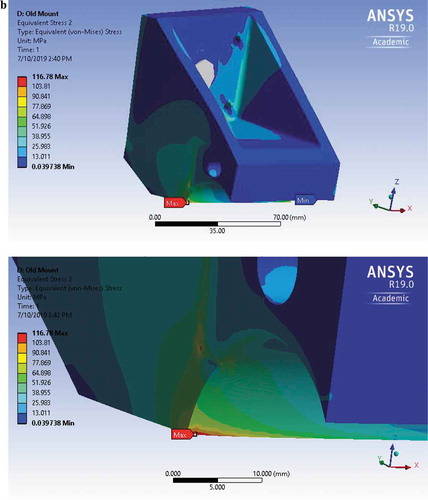
Figure 5. Structural error in engine mount
4.1.2. Modal analysis
A pre-stressed modal analysis is performed on the two designs and a frequency range is obtained. The first six frequencies are extracted, and the results obtained from this analysis are shown below in Table . The modal analysis of the engine mount is carried out for determining natural frequencies and corresponding mode shapes. Every system has natural frequencies at which the object can naturally vibrate. As the forcing frequency approaches a natural frequency, the amplitude of response asymptotically increases. This data will be useful to ensure that the structure’s natural frequencies do not match any of the fundamental forcing frequencies or approach any harmonic frequencies. (Patil & Naghate, Citation2012)
Table 1. Natural frequencies of the original mount
4.1.3. Harmonic analysis
The frequency response of the original mount under given load conditions is evaluated and is shown below in Figure . The default constant damping coefficient of 0.01 found in the ANSYS engineering material library was used. Besides having applied a constant damping coefficient, the frequency response analysis was done with clustering results around the natural frequency modes. The maximum amplitude of the frequency response was found to be 1.11 mm. The peaks in the graph indicate the amplitude of the response at structural natural frequencies. In this case, maximum amplitude of vibration occurs at 2775.5 Hz, which corresponds to the 3rd mode.
Figure 6. Frequency response of original mount
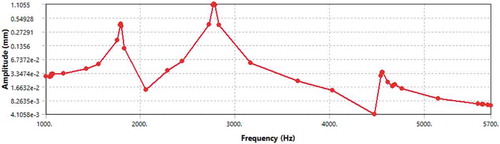
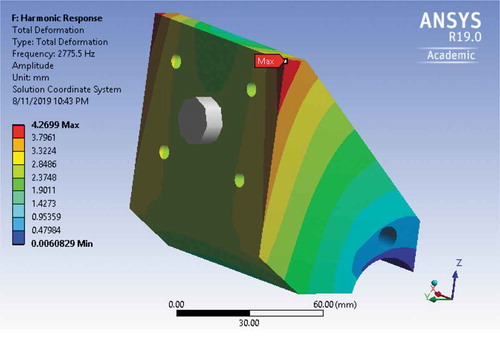
The location of the maximum amplitude of the frequency response is shown below in Figure . It was located on the top right corner of the flat face where the mount is touching the airframe. Additionally, Mode 1 (1057 Hz) could be close to the 4x harmonic frequency. This phenomenon can occur with jet engines, thus it is critical to have a stiff frame supporting the engine.
Figure 7. Total deformation of the original mount at 2775.5 Hz
4.2. Optimized topology
The initial design space was a cubic aluminum block as shown in Figure . A topology optimization was performed on this block with the objective of minimizing compliance and constraint as a percentage reduction in mass. The Finite Element Topology Optimization is followed by a geometric interpretation phase, since the results of the topology studies are merely rough geometric proposals, and some interpretation is required to create the final design. That mass constraint was treated as a variable and many iterations were performed to get a better idea about the region of criticality, in other words, several iterations (with 90%, 80%, 60% 40% and 20% mass reduction) were performed to identify regions where material density is necessary. The results of this optimization are shown in Figure –).
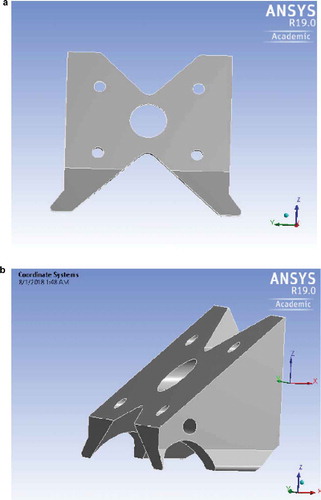
An aluminum and a structural steel version of the optimized mount were made in order to compare results. The mount sits on the chassis tube and is held in position by the brackets on either side. These brackets are TIG-welded to the chassis tube. The mount bolts on to the mainframe, which is again bolted onto the jet engine. Since the load acting on these bolts and pins is axial in nature, the principal force in the bolts is shear A shear pin connects the aluminum alloy and the mainframe. This shear pin is the primary load transmitting component (from the mainframe to the mount). The bolts mainly hold the mount in position and well fastened to the mainframe. Once the optimized topology was determined, material was added to ensure manufacturability, as well as maintaining the necessary holes for mounting and assembly of the overall substructure. The final optimized assembly is shown in Figure ,).
Figure 8. Initial design space
If the shear load on these bolts exceeds the bolt strength, then the bolts will experience shear failure and mount dislocation will ensue, which can have severe safety consequences. As a safety measure, the shear pin is introduced as the main force transmitting component and the bolts will be subjected to minimal shear loads. Thus, it is important to ensure a suitable location for shear pin even in the topology optimized design. The optimized structure is shown in Figure . This topology has a mass reduction of 72% from the cubic aluminum block. Material has been removed near the shear hole and bolt holes (Figure ). Since the shear pin is a critical part of the design additional material must be added to retain the bolt holes and shear pin holes. The final design weighs 0.663 kg. Thus, the weight of the optimized design is 17.9% lighter than the current engine mount (0.808 kg). For the structural steel block, the same design is used making the weight if the optimized design weighs 1.92 kg. That means it is 57.9% heavier than the original mount and 65.4% heavier than its aluminum counterpart.
Iterations with higher percentage of weight reduction showed the concentration of material towards the center with no provision for the shear pin or the upper two bolts. These results, although considered to be an impractical design, were useful in identifying the regions where material density was critical.
Figure 9. (a) Results of topology optimization front view. (b) Results of topology optimization top view. (c) Results of topology optimization side view
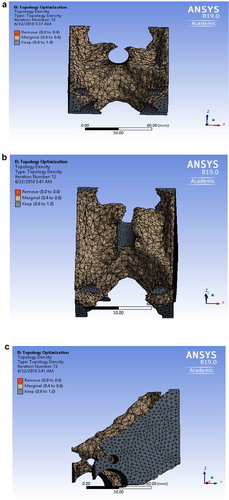
Figure 10. (a) Optimized design—front view.(b) Optimized design—isometric view
4.3. Optimized mount
4.3.1. Deformation and stress analysis
4.3.1.1. Aluminum optimized mount
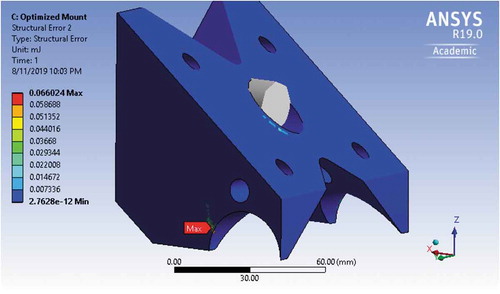
Default element sizing and a hexagonal-dominant mesh were generated for the entire assembly. By using spheres of influence, a refinement near the chassis mounts was made. This was done in order to obtain better accuracy results and to reduce errors. The results of total deformation and stress analysis are shown in Figures and , respectively. Maximum deformation of 0.18 mm occurred on the ends of the mainframe. The maximum deformation on the mount is 0.068 mm at the region in contact with the mainframe. The stress analysis showed the regions of stress concentration. It is seen the regions of high stresses were around the mounting tabs for the chassis just like the previous mount. If compared, the optimized mount distributes the stress in smaller areas than the old mount where the stress was spread more evenly throughout the mount. The maximum stress induced in the mount, as shown in Figure 12b, was found to be 216 MPa. The maximum structural error as shown in Figure , was found in the region of the chassis mounts with a value of 0.066 mJ.
Figure 11. (a) Total deformation of assembly. (b) Total deformation of mount
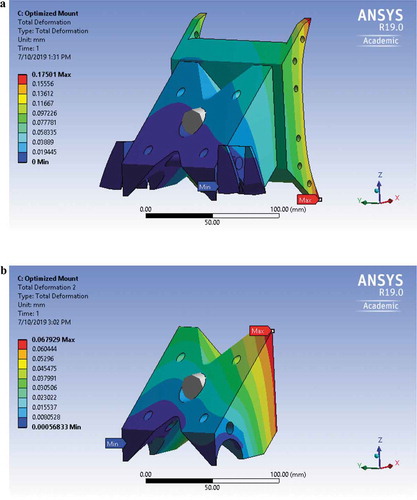
Figure 12. (a) Stress distribution in mount assembly. a-2: Stress distribution in mount assembly close-up. (b) Stress distribution in mount. b-2: Stress distribution in mount close-up
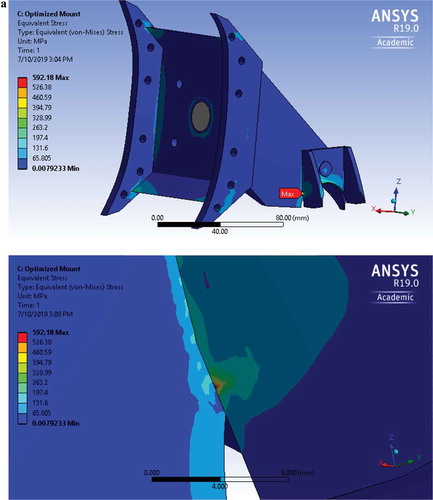
Figure 12. (Continued)
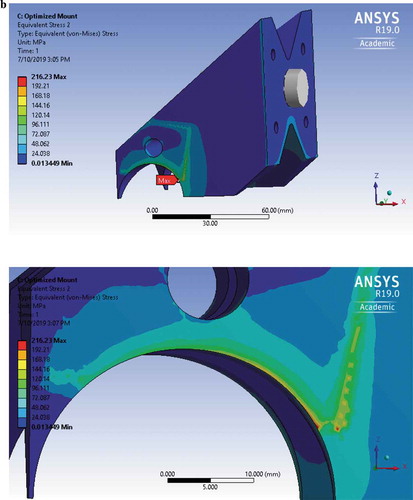
Figure 13. Structural error in engine mount
4.3.1.2. Structural steel optimized mount
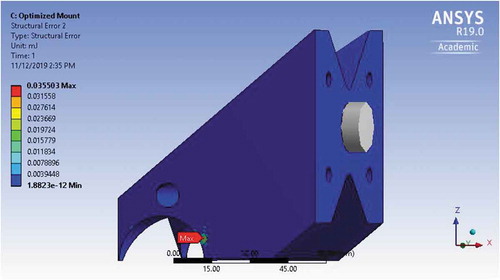
The same setup used for the aluminum optimized mount was used for this mount. Element sizing and a hexagonal-dominant mesh were generated for the entire assembly. By using spheres of influence, a refinement near the chassis mounts was made. The results of total deformation and stress analysis are shown in Figures and respectively. The maximum deformation of 0.125 mm occurred on the lower ends of the mainframe. The maximum deformation on the mount is 0.035 mm at the top right region in contact with the mainframe. The stress analysis showed the regions of stress concentration. It is seen the regions of high stresses were around the mounting tabs for the chassis just like the previous mount. The maximum stress induced in the mount, as shown in Figure ), was found to be 337.81 MPa. The maximum structural error as shown in Figure , was found in the region of the chassis mounts with a value of 0.036 mJ.
Figure 14. (a) Total deformation of assembly. (b) Total deformation of mount
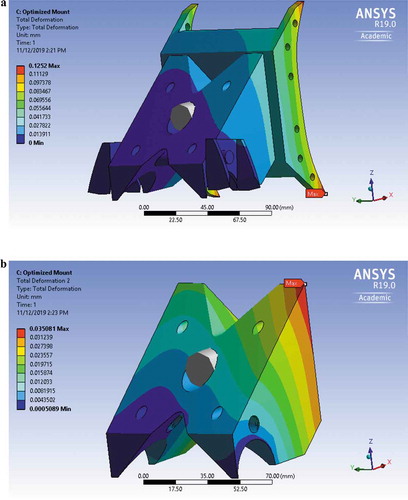
Figure 15. (a) Stress distribution in mount assembly. a-2: Stress distribution in mount assembly close-up. (b) Stress distribution in mount
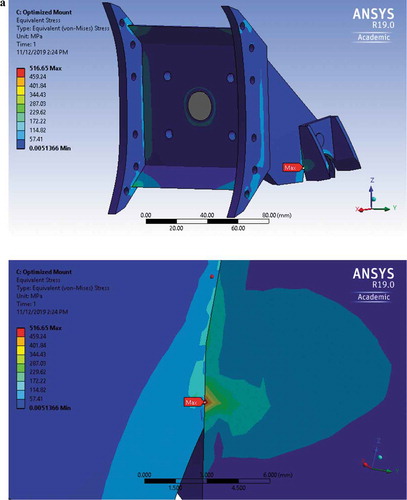
Figure 15. (Continued)
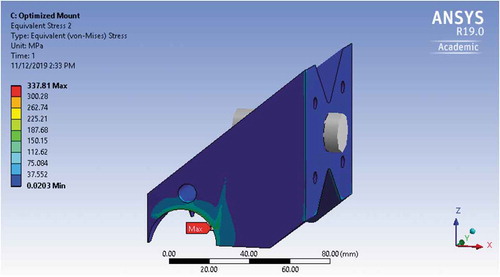
Figure 16. Structural error in engine mount
4.3.2. Modal analysis
A pre-stressed modal analysis is performed on the optimized design for both the aluminum and structural steel mounts and the first six vibrational frequencies (modes) are extracted. Results obtained from this analysis are shown in Table .
Table 2. Frequency range of optimized mounts
It can be observed that the fundamental frequency of the optimized design is lower than the existing design. The aluminum optimized mount was found to have a fundamental frequency of 439.6 Hz. The fundamental frequency of the structural steel optimized mount was of 611.4 Hz. Both optimized mounts obtained a lower fundamental frequency than that of the original mount which was 1057 Hz. Since the frequencies do not match the engine excitation frequency, the design was considered to be safe from resonance.
4.3.3. Frequency response analysis
4.3.3.1. Aluminum optimized mount
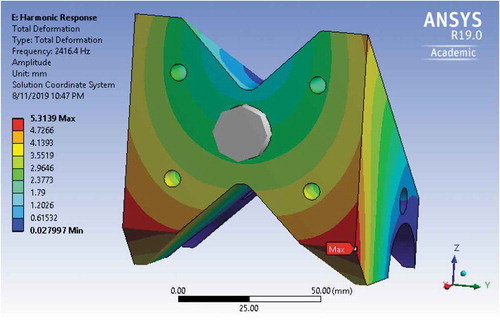
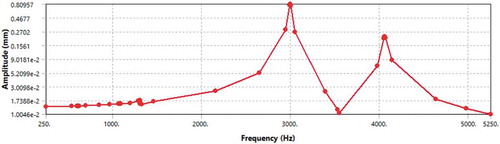
The frequency response of the redesigned mount under given load conditions is evaluated and is shown below in Figure . The default constant damping coefficient of 0.01 found in the ANSYS engineering material library was used. The frequency response analysis was performed with clustering results around the natural frequency modes. The maximum amplitude of vibration was found to be 1.1 mm. The peaks in the graph indicate the frequencies of maximum amplitude. In this case, maximum amplitude of vibration occurs at the 4th natural frequency of 2416.4 Hz.
Figure 17. Frequency response of optimized mount
The location of the maximum amplitude of the frequency response is shown below in Figure . It was located on the bottom right corner of the flat face where the mount is touching the airframe.
Figure 18. Total deformation of the redesigned mount at 2416.4 Hz
4.3.3.2. Structural steel
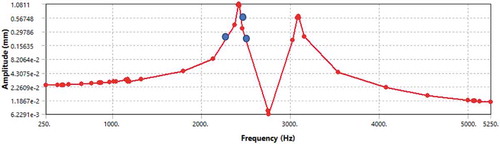
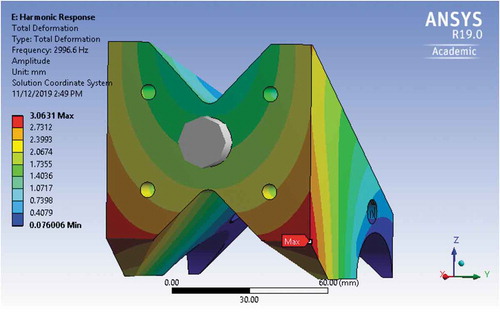
The setup for the harmonic response for the structural steel mount was the same as the one used for the aluminum optimized mount. The frequency response of the redesigned mount under given load conditions is evaluated and is shown below in Figure . The default constant damping coefficient of 0.01 found in the ANSYS engineering material library was used. The frequency response analysis was performed with clustering results around the natural frequency modes. The maximum amplitude of vibration was found to be 0.81 mm. The peaks in the graph indicate the frequencies of maximum amplitude. In this case, maximum amplitude of vibration occurs at the 4th natural frequency of 2996.6 Hz.
Figure 19. Frequency response of optimized mount
The location of the maximum amplitude of the frequency response is shown below in Figure . It was located on the bottom right corner of the flat face where the mount is touching the airframe.
Figure 20. Total deformation of the redesigned mount at 2996.6 Hz
5. Results and discussion
The results of Finite Element Analysis are consolidated and shown in Table .
Table 3. Results summary
The results from Table show that there was a mass reduction of 17.9% from the aluminum optimized mount but a 57.9% increase with the structural steel optimized mount. The original mount had a weight of 0.808 kg and was reduced to 0.663 kg in the aluminum optimized mount. When using structural steel, the weight increased to 1.92 kg. Jet dragsters always try to reduce weight in order to obtain better performance of their vehicles and reducing the mass of the mounts helps achieve the end goal of better overall performance.
The maximum stress for the original mount was found to be 116.78 MPa while the max stress found on the aluminum optimized mount was of 216.26 MPa. The structural steel mount had a maximum stress of 337.81 MPa. Both the original mount and the optimized mount with aluminum are under the maximum yield strength of 270 MPa. This was because the area on which the load acts has changed due to the redesign of the mount. The maximum stress acting on the optimized mount was higher than the original mount, but still below the yield strength, thus providing a good factor of safety as shown in Figure below.
Figure 21. Factor of safety for aluminum optimized mount
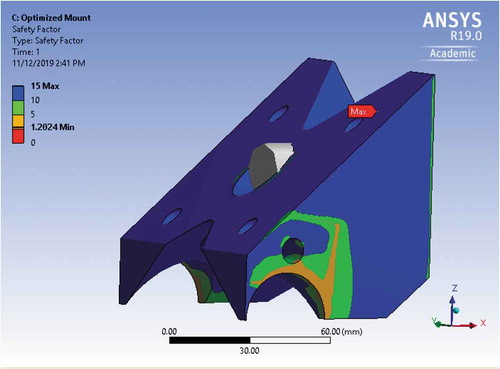
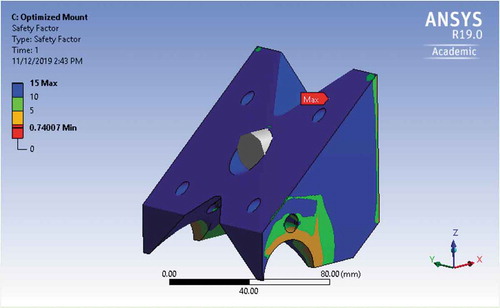
The factor of safety was above 1.0 which means the mount will not yield. For the structural steel mount, the factor of safety shown in Figure was of 0.74 which is below 1.0. This means the structural steel mount would yield.
Figure 22. Factor of safety for structural steel optimized mount
The total deformation for the original mount was of 0.092 mm which is higher than that of the aluminum optimized mount which was of 0.0679 mm. The structural steel optimized mount had a total deformation of 0.035 mm. The same is true for the peak harmonic response deformation where the aluminum optimized mount had a 1.08-mm deformation, the structural steel optimized mount had a 0.81 mm deformation whilst the original mount had a deformation of 1.11. This means the aluminum optimized mount still has good structural integrity even though there was a 17.9% mass reduction. The structural steel mount, on the other hand, does not, the factor of safety is below 1.0 which means that the optimized design will not work for that material. The yield strength is lower with it being 250 MPa while aluminum has a yield strength of 270 MPa.
The first (fundamental) natural frequencies for both the original and optimized designs were higher than the excitation frequency of the engine, so the structures will not be excited at resonance. The first fundamental natural frequency for the original mount was of 1057 Hz. For the aluminum optimized mount, the fundamental frequency was of 439.6 Hz and for the structural steel mount, the fundamental frequency was of 611.41 Hz.
By reducing weight on the mount that means that there is less material being used. This also means that the cost being paid for aluminum needed to make the mount is going to decrease. According to the American aluminum extrusion company (American Aluminum Extrusion Company,LLC, Citation0000), the latest price for aluminum is 1.74 US$/kg. Table shows the difference in price per mount.
Table 4. Price difference between original and aluminum optimized mount
Table demonstrates that there is a 18.4% decrease in price cost of aluminum when using the optimized mount. That is because aluminum alloy weighs less and uses less material overall than the original mount. Not only was there an improvement in weight, but there was also an improvement in price cost by optimizing the mount.
We also thought of different alternatives of how to improve the old mount. One of them was considering the use of structural steel as the material used for the optimized mount. Steel is stronger than having more density than aluminum with 7850 kg/m3 compared to 2710 kg/m3. Steel weighs more than the aluminum-alloy considered, but it is important to note that with the use of less material in steel frame we can manage to get the same maximum stresses compared to an aluminum-alloy frame, which would need more material due to its lower yield strength. It is also important to take into consideration that structural steel also costs less than aluminum. According to MetalMiner, (Citation2019), structural steel costs 0.75 $/kg Table shows the difference in price if the optimized mount was to be made of structural steel.
Table 5. Price difference between original and optimized mount
As Table demonstrates, the aluminum optimized mount costs 65.3% less than the structural steel optimized mount. This is because given the design, the structural steel mount weighs more than twice the aluminum optimized mount. This is why the aluminum optimized mount was chosen to be the best between the two. Not only does it cost less to manufacture but it weighs less and based on results, given the higher yield strength of aluminum (270 MPa vs 250MPa of structural steel), the aluminum optimized mount has a factor of safety higher than 1.0 which means it does not yield or break during the test.
6. Conclusions
The need for lightweight vehicles in automotive applications is spurred by improvement in vehicular performance and fuel economy. The most effective way of increasing fuel economy is reduction in vehicular weight. Some studies suggest that 4.5% to 6% fuel efficiency can be gained for every 10% reduction in vehicle weight.
In this study, an attempt has been made to optimize the structure of the engine mount for application in a jet dragster through Finite Element Analysis. A static, modal and harmonic response analyses were carried out in order to compare the stress and deformation distributions in the redesigned mounts (resulting from the topology optimization) as compared to those corresponding to the original mount. The topology optimization results yielded an optimal mount design, manufactured from aluminum alloy, which is structurally stable and 17.9% lighter than the original whilst maintaining structural integrity.
Also, besides decreasing the total weight of the mount by optimizing its shape, the cost of manufacturing it also decreases. That is because less material is used to make the optimized mount. Based on the price per kilogram of aluminum, the material needed based on the weight of the original mount would cost around $1.41 while the optimized mount comes out to be $1.15. That is 18.4% decrease in material cost per mount.
The design presented in this work also proves that the optimized mount, whilst using less material, can withstand the loading. The maximum stress of 216.23 MPa is below the yield strength of the aluminum material with a factor of safety of 1.2. The total deformation for the optimized mount also decreased: the original mount had a maximum deformation of 0.092 mm while the optimized mount had a maximum deformation of 0.068 mm.
Additional information
Funding
Notes on contributors
Matthew J. Jensen
Matthew J. Jensen received his bachelor’s degree in Mechanical Engineering from Rose-Hulman Institute of Technology in 2006. Matthew received his doctorate from Clemson University in 2011 in Mechanical Engineering, focused primarily on automotive control systems and dynamics. Matthew spent several years as an assistant professor at Florida Institute of Technology, before recently joining Utah Valley University in Fall 2019 to help start a new mechanical engineering Bachelor of Science degree program. His research interests include applications in automotive/transportation safety, electro-mechanical systems, data analysis strategies and techniques, and engineering education. His research lab focused on a variety of topics related to the modeling, analysis control of automotive systems including high performance applications. The work presented in this paper was initiated by an industry partner wanting to improve the design of some of the smaller structural components in their world championship winning jet dragster race car.
References
- American Aluminum Extrusion Company,LLC. (0000). http://www.americanaluminum.com/capabilities/aluminum-pricing/
- Benaouali, A., Abdelkader., Robert., Rogólski., Tomasz., Łącki., Kachel., Stanisław., Olejnik., & Aleksander. (2016, Nov). Design optimization of a very light aircraft engine mount with consideration of extremal flight loads. Researchgate, 16, 77–84.
- Benur, R., & Akshatha, H. T. (2015, June). Design evolution of a typical aircraft engine mount bracket using FE based optimization technique. International Journal of Mechanical Civil and Control Engineering, 1(3), 2394–24. ISSN No.
- Farby, S., & Ceskovic, M. (2017). Aircraft gas turbine engine vibration diagnostic. Magazine of Aviation Development, 5(4), ISSN: 1805-7578 24–28. doi:10.14311/MAD.2017.04.04.
- Kala, P. L., & Kiran, V. R. (2015). Modeling and analysis of v6 engine mount bracket. International Journal of Innovative Research in Science, Engineering and Technology, 4, 5907–5914.
- Lucas, V. F. (2006). Weight reduction techniques applied to formula SAE Vehicle Design: An investigation in topology investigation. San Diego: Thesis Submission University of California.
- MetalMiner. (2019). https://agmetalminer.com/metal-prices/carbon-steel/
- Pan, X.-Y., Xiao-Yong Pan., Doni Zonni., Guo-Zhong Chai., Yan-Qing Zhao & Cui-Cui Jiang. (2007). Structural optimization for engine mount bracket. SAE International, 2007-01-2419.
- Patil, S., & Naghate, S. (2012, Aug). Modal analysis of engine mount bracket using FEA. International Journal of Engineering Research and Applications, 2(4), 2248–9622. www.ijera.com
- Sapa Extrusion North America. (2017). Data sheet aluminum 6061. orsk Hydro ASA. www.hydroextrusions.com/contentassets/7a0f14a8e10a42d0b2ad96f818fe1c25/data_sheet_6061_new_metric_12_10_2017.pdf.
- Umesh, S., Ghorpade., D. S. Chavan., Vinaay Patil., & Mahendra Gaikwad. (2012). Finite element analysis and natural frequency optimization of engine bracket. International Journal of Mechanical and Industrial Engineering (IJMIE), 2(3),1–6, 2012. ISSN No. 2331-6447.
- Vinchurkar, S. C., & Khanwalkar, P. M. (2016). FEA and topology optimization of an engine mounting bracket. International Journal of Current Engineering and Technology. http://inpressco.com/category/ijcet