
 ?Mathematical formulae have been encoded as MathML and are displayed in this HTML version using MathJax in order to improve their display. Uncheck the box to turn MathJax off. This feature requires Javascript. Click on a formula to zoom.
Abstract
The search for acceptable optimal or near-optimal weld process parameters through the application of suitable optimization technique cannot be over emphasized, as this will help prevent weld defects capable of causing remarkable decrease in the mechanical properties of welded joints. This study explodes the application of multi-objective genetic algorithm (MOGA), an evolutionary optimization technique, alongside a regression model, in finding the optimal process parameters of a GTAW welded mild steel plate. Analysis of variance ANOVA was used in determining the significance of the model as well as studying the main and interactive effects of the process parameters on the responses. With the mathematical models obtained, used as objective functions, the genetic algorithm provided the best optimization on the 186th generation. An optimal weld strength of 546.8 N/mm2 and hardness of 159.1 at the combined input variable of 140 ampere welding current, 24.9 V weld voltage, 20 l/min gas flow rate, and 2.4 mm filler rod diameter were obtained. Confirmatory tests conducted using the generated optimal results showed that the percentage of error was within the permissible limit of 5%, a validation of the optimization technique.
PUBLIC INTEREST STATEMENT
The rise in the failure of mechanical components, some of which are attributable to poor weld joints has given rise to research study on the use of optimization techniques in the determination of excellent weld joint. These areas has generated a lot of attention because of the role they play in determining the quality of the weld joint. Selecting the right combination of input process parameters can be tedious, and has mostly been based on trial and error, which is non-systematic and usually does not produce an optimized combination of welding parameters, which can be replicated for different outcomes. This paper explores the use of genetic algorithm, one of the several optimization techniques developed over the years in determining the optimal weld properties of a 10 mm thick gas tungsten arc welded plate.
1. Introduction
Welding is a key process of joining in the fabrication and manufacturing industry, which is predominantly applied in the repairs and hard facing of engineering products (Groover, Citation2007). It is an excellent alternative to casting, forging, as well as bolted, and riveted joints (Praveen & Yarlagadda, Citation2005), involving a wide range of variables such as current, voltage, electrode stick-out, gas flow rate, edge preparation, position of welding, welding speed and many more which influences the integrity and quality of the joints (Sun & Karppi, Citation1996; Winiczenko, Citation2015).
The past few years have witnessed the development and application of quite a number of optimization techniques, utilized by various researchers in performing process parameters optimization geared towards improving productivity and quality of welded joints (Sada, Citation2018). The application of optimization techniques requires that the desired input and output variables be defined through the use of developed mathematical models, as well as an appropriate set of operational conditions that optimizes all response variables (Benyounis et al., Citation2005). Among the several techniques, genetic algorithm (GA) which employs the Darwinian principle of natural selection strategy (survival of the fittest) in exterminating unfit solutions, combining random information exchange and exploring knowledge contained in old solutions, to obtain a search mechanism possessing power and speed, has been rapidly applied as a tool for process optimization. With the use of gene information and chromosome processing, for the optimization of specific functions, as well as its ability in finding the desired optimal weld condition within a large set of search space points, genetic algorithm has proven to be a very efficient optimization tool compared to other optimization techniques (Deb, Citation2001; Gaitonde et al., Citation2008).
A good number of studies has shown that the genetic algorithm is a very efficient technique in determining the optimum/near-optimum parameters for weld joint quality (Anil & Patel, Citation2015). Anil and Patel (Citation2015) with the application of the experimental data generated on stainless steel TIG welded plate developed a regression model correlating the weld-bead shape parameters with the process parameters which was also used in representing the objective/fitness function for the GA analysis. Test of analysis of variance (ANOVA), performed to identify the parameters with the most significant effect, followed by the optimization of the weld parameters. The results obtained showed that gas flow rate had the most percentage contribution of 43.52%, followed by Filler rod diameter 31.08% and the least welding current 25.40% and the combined optimal parameters current 80 A, Shielding gas 8 l/min, Filler rod diameter 1.6 mm and Aspect ratio of 2.228 were obtained. Shafikh and Sudheesh (Citation2013) used regression modeling in establishing the relationships between selected input process parameters and the weld geometry of a mild steel Gas Metal Arc Welded plate as per the Taguchi orthogonal array. The process parameters were then optimized using GA to obtain the optimum weld bead geometry. The results obtained showed that the genetic algorithm can be successfully implemented for continuous optimization problems like weld bead geometry optimization. Elangovan et al.(Citation2012) developed a model to determine the relationship between the welding conditions and the joint strength of an ultrasonic weld, conducted as per central composite centered design (CCCD) for spot and seam welding. Genetic algorithm (GA) was employed to determine the optimal conditions, findings showed that the optimum conditions obtained from GA correlate very well with the experimental results with a percentage error less than 6%.
Correia et al. (Citation2005) performed the optimization and prediction of MIG weld process variables using Genetic algorithm (GAs) without the application a modeling equation. The GA performed excellently well in establishing the near-optimum conditions using a small number of experiments, not withstanding its demand for a good parameter setting, such as number of generations, population size, etc. Mishra and Debroy (Citation2007) adopted a similar approach in determining the near-optimal settings of a GMAW process using genetic algorithm, in predicting the next experiment based on the previous, without the knowledge of the modeling equations between the inputs and outputs. Meran (Citation2006) developed the optimal welding current/velocity estimation models (GAWCEM/GAWVEM) to optimize the parameters like weld current and weld velocity in tungsten inert gas (TIG) welding using genetic algorithm. The developed models were compared with experimental data and were found to be in good agreement. Though these studies have been performed to evaluate certain weld properties, very little has been recorded in the optimization of weld strength using the multi-objective genetic algorithm. Hence, this study is aimed at developing a mathematical model of the response variable and obtaining the optimum combination of welding process parameters for a guaranteed weld joint quality using a multi-objective genetic algorithm.
2. Methodology
The material selected for this experiment is a 10 mm thick mild steel plate, cut to coupons of dimensions 50 mm x 100 mm with the aid of a power hack saw and ground at the edges to smoothen the surfaces to be welded. The sides of both plates to be welded were cut to form a V groove for a total of 30-degree inclined angle and then set with a root face and root distance of 3 mm, respectively. The following input process parameters, weld current (140–200 AMP), arc voltage (15–25 V), gas flow rate (20–24 l/min), filler rod (2.4–3.2 mm) were chosen for this experiment with tensile strength and hardness as the selected response variables. Prior to the welding experiment, central composite design (CCD) was employed using the design expert method in generating the design matrix which is composed of 30 thirty experimental runs.
The gas tungsten arc welding (GTAW) process was used in performing the experiment, with argon gas as the shielding gas. At the completion of the experiment, each specimen was cut at the cross-section for tensile strength and hardness test. The shape and size of all the tensile specimens were prepared designed in accordance with ASTM specification E8/E8 M-11 as in Figure and tested accordingly.
Figure 1. Standard 10 mm thick Butt Welded Plates machined for tensile test
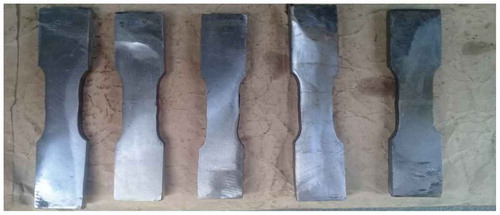
Figure , represents a view of the prepared weld plates with a region on the cross-sectional area known as the gauge length reduced relative to the reminder of the specimen, to ensure that the deformation, as well as failure of the specimen, is localized within that region.
2.1. Optimization
Optimization of the response variable “y” requires the identification of an appropriate approximation which reflects the true functional relationship between the independent and response variable, this is achieved using a second-order model through the application of the least square method as shown in EquationEquation 1(1)
(1) (Ixtaina et al., Citation2015, Myers & Montogomery, Citation1995).
where y is the predicted response; is the intercept constant;
are the interaction coefficients of the linear, quadratic, and the second-order terms, respectively, k is the number of factors; xi and xj are variables (i and j range from 1 to k) and ei is the error.
Once the mathematical model has been selected, it is essential to test the statistical quality of the results prior to their evaluation as well as determine the significant model terms by means of an analysis of variance (ANOVA) test and assessment of the models goodness-of-fit. The model is considered a good fit to the experimental data when the proposed mathematical model is statistically significant, a necessary condition in validating the model for further optimization process (Ixtaina et al., Citation2015). This validation is made using the test of Significance which forms the basis for model optimization, it involves the determination of probability value (P-value), a value that relates the risk of rejecting a given hypothesis falsely (NIST/SEMATECH, Citation2006). The evaluation of the goodness of fit test through the coefficient of Determination (R2) and adjusted R squared values also contributes to the validation of the model. If a regression coefficient is low (<70%), the mathematical model is not good and, on the other hand, if its value is high (>90%), it means that other statistical criteria may be used. The adjusted R Square value estimates the required shrinkage in the coefficient of determination (R Square) value. An adjusted R Square value much lower than the R Square value indicates a regression equation over-fitted to the sample and of limited generalized ability.
2.2. Genetic algorithm (GA)
Genetic algorithm is an evolutionary algorithm which applies the idea of survival of the fittest amongst an interbreeding population to create a robust search strategy. Initially, a finite population of solutions to a specified problem is maintained. It then iteratively creates new populations from the old by ranking the solutions according to their fitness values and interbreeding the fittest to create new off-springs that are optimistically closer to the optimum solution to the problem at hand. It uses only the fitness value and no other knowledge is required for its operation (Simpson et al., Citation1994). It is a robust search technique different from the problem-solving methods used by more traditional algorithms which tend to be more deterministic in nature and get stuck up at local optima. As each generation of solutions is produced, the weaker ones fade away without producing offsprings, while the stronger mate, combining the attributes of both parents to produce new and perhaps unique offsprings to continue the cycle. Occasionally, the mutation is introduced into one of the solution strings to further diversify the population in search of a better solution. (Gen & Cheng, Citation2000).
To do optimization, a cost function or fitness function as it is usually called when genetic algorithms are used is needed. By a fitness function, we can select the best solution candidates from the population and delete the not so good specimens. Once the genetic representation and the fitness function also represented by the objective function (represented by the mathematical model) are defined, GA proceeds to initialize a population of solutions randomly, and then improves it through repetitive application of mutations, crossover, and selection operators.
Steps in GA
(i) Evaluate the fitness of every individual in the population. (ii) Select the best and fittest parents from the given population. (iii) Perform crossover operation by recombining the individuals from parents to form children (new generation). (iv) Mutate the new generation. (v) If the termination condition is not reached, go back to step 2, else terminate the operation, and return the best individual in the current population.
In this study, with the application of genetic algorithm (GA), the developed mathematical models for the responses were written as M-files and employed in the optimization of the responses as well as the control using the MATLAB software.
3. Results and discussion
The experiments were conducted according to the procedures adopted and the weld specimens were subjected to the various response tests. The results obtained are tabulated in Table .
Table 1. Design Matrix of Central Composite Design and Responses Obtained
3.1. Development of the mathematical modeling
With the use of “Design Expert” software, a second-order polynomial equation that fits the experimental data for each response (tensile strength and hardness) and describes the relevant model terms was obtained as shown in EquationEquations 2(2)
(2) and Equation3
(3)
(3) respectively.
y1 and y2 represent the output parameters, tensile strength, and hardness, and x1, x2, x3, x4 represent the input variables weld current, arc voltage, filler rod diameter, and gas flow rate, respectively.
3.2. Analysis of variance (ANOVA)
Analysis of Variance test was performed to test the significance of the model developed. The test as displayed in Tables and , shows that the models are significant having obtained F values of 12.69 and 8.51 for the tensile strength and hardness, respectively, at P-values less than 0.005.
Table 2. ANOVA Table for Validating the Tensile Strength Model
Table 3. ANOVA Table for Validating the Hardness Model
Tables – display the results of the analysis of variance test for the responses (tensile strength and hardness) and the goodness of fit test, respectively. A P-value less than 0.001 was obtained for the responses at an F-value of 12.69 and 8.51, respectively, and indication that the models are significant and that the variation in the model could only have been obtained as a result of the effect of the parameters. From the results, it was also observed that the following model terms, weld current, gas flow rate, and filler rod had the most significant effect on the model compared to the others judging from their P-values which are less than 0.005.
Table 4. Goodness of Fit Test
The R-squared (coefficient of determination) values of 0.9321 and 0.8981 as observed in Table , shows that 92.2% and 88.8% of the total variation in the responses (tensile strength and hardness) are explainable by the model, further validation of the model's ability to predict the optimal values of the selected variables. The Adj. R-Squared (adjusted coefficient of determination) values of 0.8845 and 0.8747 as observed in the Table as well are in reasonable agreement with the observed values of the R-squared with differences of 0.048 and 0.023, an indication that the model is 84.95% and 78.37% reliable. Adeq Precision measures the signal-to-noise ratio. A ratio greater than 4 is desirable. Adequate precision value of 12.092 and 10.441 as observed indicates an adequate signal, indicating that the model can be used to maximize the tensile strength and hardness value.
4. Optimization using genetic algorithm
The desired responses and control parameters were optimized by using the mathematical models developed in EquationEquations 2(2)
(2) and Equation3
(3)
(3) . The mathematical equations were considered as the objective functions, which were also taken as the fitness function. The variables were first coded to binary coding by writing the mathematical models as M-files and then optimized using the multi-objective genetic algorithm as the optimizing tool “gamultiobj” in MATLAB R2012. The following parameters were used in the execution of the optimization process: Population size: 60, Creation function: Feasible population, Selection: Tournament, Crossover probability: 0.8, Type of crossover: Single point, Mutation Function: Adaptive Feasible, Mutation probability: 0.01, Function tolerance: 1e-4 with the input variable range displayed in Table , applied as the constraints. The output of the successful operation of the above command at 186 iterations is displayed with 18 results in Table .
Table 5. Optimal Response Obtained Using Genetic Algorithm
The best optimization was obtained on the 186th generation of the genetic algorithm solver, as highlighted in Table . Observation shows that maximum weld strength 546.8 Mpa and hardness 159.1with optimum input parameters as follows: weld current 140 A, arc voltage 24.9 V, 20 l/min gas flow rate 20 l/min and filler rod diameter 2.4 mm. A plot of the Pareto front for the two objective functions is given in Figure , the plot function visualizes the performance of the solver at run time for the responses.
Figure 2. Pareto Front graph
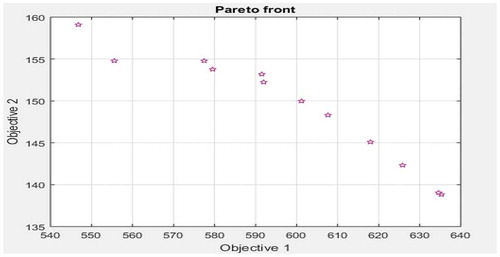
Figure , shows the representation of the Pareto optimal set in the objectives search space known as the Pareto front (PF). The graphics shows that a reasonable representation of the Pareto front has been obtained, with the points on the graph depicting each of the solutions obtained. The plot indicates that they are non-dominated solutions since there is no other solution that results in lower objective function values than these. According to Vijayan and Abhishek (Citation2018), in selecting the optimal solution, a knee point solution is a good choice if the Pareto front is convex, as this solution almost reaches the optimal value for each of the objectives. From the detail study of the graph, it can conclude that the optimum value of both response satisfies the condition corresponding to the knee point solution.
5. Confirmatory test
A confirmatory test of the results obtained from the genetic algorithm was performed by performing an experiment with the optimal input parameters. The results from the test gave a percentage error of 5%.
6. Conclusion
The combined optimal weld parameters of the weld quality of a mild steel GTAW welded plate has been successfully obtained using the multi-objective genetic algorithm (MOGA) optimization technique. With the variables coded to binary coding by writing the mathematical models developed using regress method, as M-files and multi-objective genetic algorithm were applied as the optimizing tool “gamultiobj” using MATLAB R2012. The optimal results were obtained on the 186th generation, at a maximum weld strength and hardness of 546.8 Mpa and 159.1, respectively, with optimum input parameters as follows; weld current 140 A, arc voltage 24.9 V, gas flow rate 20 l/min and filler rod diameter 2.4 mm. Confirmatory shows that the percentage error in experimental values and multiobjective genetic algorithm is 5% which is acceptable.
Additional information
Funding
Notes on contributors

Samuel O. Sada
The author Samuel Oro-oghene Sada is a Lecturer in the Department of Mechanical Engineering at the Delta State University, Abraka, Nigeria. He obtained his first degree in Mechanical Engineering from the Federal University of Technology, Minna, Nigeria, an M.Eng and MPhil (Industrial Engineering) and Ph.D in design and Manufacturing Engineering from the University of Benin, Nigeria. He is a member of the Nigeria Society of Engineers and a Registered Engineer with the Council for the Regulation of Engineering in Nigeria (COREN).
In the past few years he has taught and dproject supervision of undergraduate engineering students in the area of design and manufacturing. His areas of research includes; mechanical designs, design and manufacturing processes, the application of modelling and simulation techniques in the optimization of process parameters etc. The author has applied some of these techniques in providing solutions to certain welding and machining related challenges.
References
- Anil, P. M., & Patel, N. B. (2015). Parametric optimization of TIG welding on UNS S31603 using genetic algorithm. International Journal of Advance Engineering and Research Development, 2(5).
- Benyounis, K. Y., Olabi, A. G., & Hashmi, M. S. J. (2005). Effect of laser welding parameters on the heat input and weld-bead profile. Journal of Materials Processing Technology, 164–165C, 971–11.
- Correia, D. S., Concalves, C. V., Sebastiao, S. C., & Ferraresi, V. A. (2005). Comparison between genetic algorithms and response surface methodology in GMAW optimization. Journal of Materials Processing Technology, 160(1), 70–76. https://doi.org/10.1016/j.jmatprotec.2004.04.243
- Deb, K. (2001). Multi-objective optimization using evolutionary algorithms. John Wiley and Sons, Ltd.
- Elangovan, S., Venkateshwaran, S., & Prakasan, K. (2012). Experimental investigations on optimization of ultrasonic welding parameters for copper to brass joints using response surface method and genetic algorithm. International Journal of Advanced Engineering Research and Studies, I(III), 55–64.
- Gaitonde, V. N., Karnik, S. R., Achyutha, B. T., & Siddeswarappa, B. (2008). Genetic algorithm-based burr size minimization in drilling of AISI 316L stainless steel. Journal of Materials Processing Technology, 197(1–3), 225–236. https://doi.org/10.1016/j.jmatprotec.2007.06.029
- Gen, M., & Cheng, R. (2000). Genetic algorithm and engineering optimization. John Wiley & Sons, Inc.
- Groover, M. P. (2007). Fundamentals of modern manufacturing. Wiley.
- Ixtaina, Kah, P., Presso, M., Rosales, N., & Marin, G. H. (2015). Glare by Light Emitting Diode (LED) vehicle traffic signals. International Journal of Mechanical and Materials Engineering, 10(1), 1–10. https://doi.org/10.1186/s40712-014-0027-2
- Meran, C. (2006). Prediction of the optimized welding parameters for the joined brass plates using genetic algorithm. Journal Materials & Design, 27(5), 356–363. https://doi.org/10.1016/j.matdes.2004.11.004
- Mishra, S., & Debroy, T. (2007). Tailoring gas tungsten arc weld geometry using a genetic algorithm and a neural network trained with convective heat flow calculations. Materials Science and Engineering, 454–455, 477–486. https://doi.org/10.1016/j.msea.2006.11.149
- Myers, R. H., & Montogomery, D. C. (1995). Response surface methodology: Process improvement with steepest ascent, the analysis of response surfaces, experimental designs for fitting response surface. John Wiley and Sons Inc.
- NIST/SEMATECH. (2006). e-handbook of statistical methods.Retrieved from http://www.itl.nist.gov/div898/handbook/
- Praveen, P., & Yarlagadda, P. (2005). Meeting challenges in welding of aluminium alloys through pulse gas metal arc welding. Journal of Materials Processing Technology, 164, 1106–1112. https://doi.org/10.1016/j.jmatprotec.2005.02.224
- Sada, S. O. (2018). Optimization of weld strength properties of tungsten inert gas mild steel welds using the response surface methodology. Nigeria Journal of Technology, 37(2), 407–415. https://doi.org/10.4314/njt.v37i2.15
- Shafikh, M., & Sudheesh, R. S. (2013) Parameter optimization using genetic algorithm in gas metal arc welding of mild steel. Proceedings of international conference on materials for the future - innovative materials, processes, products and applications. ICMF.
- Simpson, A. R., Dandy, G. C., & Murphy, L. (1994). Genetic algorithms compared to other techniques for pipe optimization. Journal of Water Resources Planning and Management, 120(4), 423–443. https://doi.org/10.1061/(ASCE)0733-9496(1994)120:4(423)
- Sun, Z., & Karppi, R. (1996). The application of electron beam welding for the joining of dissimilar metals: An overview. Journal of Materials Processing Technology, 59(3), 257. https://doi.org/10.1016/0924-0136(95)02150-7
- Vijayan, D., & Abhishek, P. (2018). Multi objective process parameters optimization of friction stir welding using NSGA – II. IOP Conference Series: Materials Science and Engineering, 390, 012087. https://doi.org/10.1088/1757-899X/390/1/012087
- Winiczenko, R. (2015). Effect of Friction welding parameters on the tensile strength and microstructural properties of dissimilar AISI 1020-ASTM A536. International Journal of Advanced Manufacturing Technology, 84, 941–955.