
 ?Mathematical formulae have been encoded as MathML and are displayed in this HTML version using MathJax in order to improve their display. Uncheck the box to turn MathJax off. This feature requires Javascript. Click on a formula to zoom.
Abstract
A literature survey indicated that high impedance fault (HIF) detection methods employ simulation techniques using very low voltage signals generated using software such as PSCAD, and MATLAB, among others. While software platforms are used to derive satisfactory results, small fault current signals cannot be accurately tapped from high transformation ratio current transformers owing to the dominant load currents in real power systems. Therefore, a sensitivity analysis based on a power system background is considered essential. A set of well-known power system equations are used to analyse and select a parameter to tune this sensitivity, from several available parameters, such as source, transformer, line, neutral, and earth impedance. The analysis reveals that when the detection of HIF in the field is challenging, then fault or neutral impedance emerges as an important parameter for tuning the system. To achieve this, certain rigorous mathematical steps are derived to develop a suitable formulation for sensitivity analysis using differential calculus. Based on the analysis, the sensitivity results and tuning parameters are tabulated, and sensitivity dependency curves are plotted.
PUBLIC INTEREST STATEMENT
High impedance faults do not produce sufficient fault current to be detected by conventional overcurrent relays or fuses. Developing a suitable technique to detect high impedance faults with a reasonable degree of reliability is a safety challenge for engineers and power supply providers. Literature surveys spanning over 34 years of high impedance fault (HIF) detection methods indicate that research on this topic is underway. The detection of fallen live conductors in desert regions is critical to ensuring the safety of humans and livestock (camels) in the area. To understand the characteristics and magnitude of the current produced by the fallen conductors in the desert, under different situations, live line fault simulations were conducted by power supply providers. The author(1), who was involved as a lead engineer in conducting such tests, analysed the power system to identify methods to measure such low fault currents.
1. Introduction
High impedance faults do not produce sufficient fault current (Tengdin et al., Citation1996). For an extended period, it has been a challenge to detect high impedance faults with a reasonable degree of reliability. The state-of-the-art research surrounding this topic for a period spanning over 33 years has been summarised in (Ghaderi et al., Citation2017) published in 2017. Recent literature surveys on HIF detection (Costa et al., Citation2015; Chakraborty & Das, Citation2018; Cui et al., Citation2019; Gomes et al., Citation2017; Papathanassiou et al., Citation2007; Song et al., Citation2019) also indicate that studies concerning this area of interest are underway. The methods identified in the literature are mostly based on software tools such as MATLAB/SIMULINK and PSCAD (Papathanassiou et al., Citation2007), and hence, reflect satisfactory results for the identification of HIF. A study that discusses a new model for high impedance fault in electrical distribution systems presents a HIF (Emanuel arc model) simulated using ATP/EMTP. This analysis was performed for five different models of several amplitudes (9–90 A) of HIF current, providing results with high accuracy (Sedighi, Citation2014). We observed that the results are satisfactorily derived owing to the high amplitude currents selected, and such currents are detectable by the currently available protection relays. The study concerning a novel high impedance fault detection technique in distribution systems with distributed generators also considers PSCAD/EMTDC software used for generating data for different test cases, and the method is implemented using the MATLAB software. The magnitude of current in this study is in the range of several tens of amperes (Nayak et al., Citation2016). The research on high impedance fault identification and classification using a discrete wavelet transform and artificial neural networks (Hubana et al., Citation2018) indicates that there are no current and voltage measuring transformers used, and hence, no difficulty is faced while capturing real-time data. The research on high impedance fault detection in a medium voltage distribution network, using a discrete wavelet transform and adaptive neuro-fuzzy inference system (Veerasamy et al., Citation2018), considers the DWT and ANFIS networks for generating data for different test cases and the method is implemented using MATLAB the software. This also considers Emanuel two-diode arc model for HIF detection. No current and voltage measuring transformers are used in this model and no difficulty was faced in capturing real-time data. The study on high impedance fault detection and isolation in power distribution networks using support vector machines (Sarwar et al., Citation2019) considers the well-known arc model and the current amplitude selected is about 35 A, which is easily detectable.
Field survey and experience in existing electrical substations indicate that real-time current and voltage measurements, with sufficient quantity derived from medium voltage distribution systems, are essential in providing suitable and reliable methods for the detection of HIF. The presently available methods implemented by various protection relay manufacturers in use, in substations, in the United Arab Emirates desert regions are not sufficient for detecting a fallen live conductor on highly resistive desert soil (which does not permit adequate ground-fault current). Such HIF produces small ground-fault currents that cannot be accurately tapped from the high transformation ratio current transformers used in the lines due to the dominant load currents. Practically, the current transformation ratio is 400/1 for a 6 MVA real power transmission line in an 11 kV system.
Live line fault simulations were conducted by power supply providers to understand the characteristics and magnitude of the current produced by fallen conductors on the desert soil under different situations. The author(1) was involved as a lead engineer when these tests were conducted (Velmurugan, Citation2012) and were therefore motivated to analyse the power system parameters to find ways to transform such low fault currents for the purpose of detection. The authors, therefore, decided to focus on conducting a sensitivity analysis of single line to ground fault, in a medium voltage overhead line circuit, by varying the zero-sequence impedance (fault impedance or neutral circuit impedance) based on a set of power system EquationEquation (15)(15)
(15) . There were very few studies with direct references to sensitivity analysis applied in the area towards the detection of HIF. It has been observed that studies on the topic of sensitivity analysis are also limited. However, some papers have been found to deal with the sensitivity aspects of the network. The insights from (Gomes et al., Citation2017) lie in the involvement of signal processing aspects. However, these authors have not investigated the sensitivity analysis of the network. Another study (Hayward & Cruz-Hernandez, Citation1998) refers to sensitivity, where the main concern is the behaviour of a mass-spring-damper system. Therefore, based on the aforementioned references, the authors could not compare the engineering results for the works mentioned above with the results of the present paper.
This paper is divided into six sections. Section 2 describes a simple radial power system and a set of equations that are considered for the sensitivity analysis. Section 3 introduces the mathematical foundation of the sensitivity analysis. Section 4 provides rigorous mathematical steps for sensitivity analysis. Section 5 contains the sample results of the sensitivity analysis for a practical system, and Section 6 presents the conclusions.
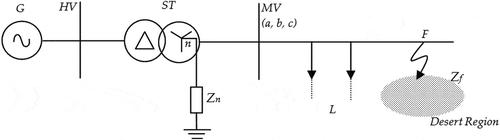
Figure 1. Single line representation
2. Set of equations for a simple radial power system
The single line representation of a simple radial power distribution system is shown in Figure . To feed MV loads (L) via the overhead lines in a desert region, a 33/11 kV Station Transformer (ST) with a 20 MVA capacity, employing a delta/star arrangement, and possessing a per unit impedance of 12% is used. For the analysis, the chosen values of the neutral earthing impedance “Zn” are 0.1, 63.5, and 635 Ω and the selected values of the fault impedance “Zf” are 0.1, 100, and 1000 Ω.
The sequence impedances of the lines and transformer are real-world values derived from a practical case and are tabulated in the relevant section. The power distribution capability of the overhead line to feed to various loads (L) is approximately 6 MVA at 11 kV. The rated load current is approximately 315 A. The current transformer ratio on the line at MV bus is 400/1 considering the line capability of 120% of 315 A. In desert regions, the resistivity values of soil are high and therefore, the ground-fault current due to a fallen conductor is minimal in many cases.
A single-phase to ground fault “Ifa” at “F” through fault impedance “Zf” and voltage across neutral “Vn” are represented in Figure to understand the reflections of fault current and voltages. This will aid the reader in visualising the potential rise across the transformer neutral with respect to the faulted phase and the flow of fault current through the fault impedance and the neutral. The three-phase representation provided in Figure is limited to the MV system since the earth’s fault current flow is only limited to the MV system owing to the delta formation of the HV windings. Having provided these explanations, the authors believe that Figures and are sufficient to proceed with the analysis using a set of well-known EquationEquations (1(1)
(1) )–(Equation4
(4)
(4) ) defined in standard textbooks (Kothari & Nagrath, Citation2008), (Grainger et al., Citation1994).
Figure 2. Representation of a single-phase to the ground fault of the MV system
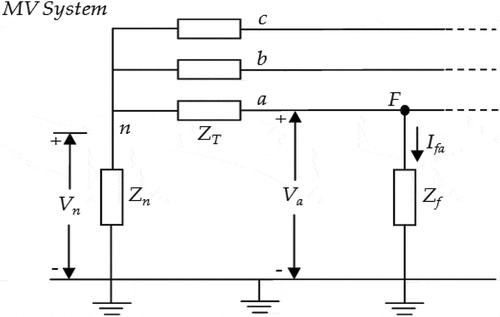
The fault current “Ifa,” healthy phase voltages “Vb,” “Vc”, and the voltage across neutral “Vn” in Figure are expressed by the following set of four EquationEquations (1(1)
(1) )–(Equation4
(4)
(4) ) and are considered for rigorous mathematical inspection in Section 4.
3. Sensitivity analysis
To provide fundamental explanations, the following details are provided considering two variables “x” and “y.” When a small change in x produces a large change in function y = f (x), then y is relatively sensitive to changes in x. The derivative f’(x) is a measure of this sensitivity (Weir et al., Citation2005), (Hayward & Cruz-Hernandez, Citation1998). The equation dy = f’(x) dx conveys the sensitivity of the output of “f” to change in input for different values of “x”. The larger the value of f’ at x, the greater the effect of a given change dx.
Sensitivity “S” of “y” with respect to “x” is defined as follows:
Note:
True change: and Estimated change:
; and thus, employs
. In the analysis,
is taken to be equal to dy under the condition that change in dx is very small, and its limit extends to zero.
If we consider a function of two variables as, then a small change in “u” (du) can be expressed using the partial differentiation technique (Weir et al., Citation2005) as
Similarly, applying differentiation to the power system, EquationEquations (1(1)
(1) )–(Equation4
(4)
(4) ) requires rigorous mathematical steps, which are presented in Section 4.
4. Rigorous mathematical steps for sensitivity analysis
4.1. Mathematical steps for sensitivity analysis of fault current “Ifa”
Differentiating “Ifa” with respect to “Zf”, EquationEquation (1)(1)
(1) will be
Let
Sensitivity of fault current “Ifa” with respect to “Zf” is defined as
Using EquationEquation (1)(1)
(1) for “Ifa” in EquationEquation (8)
(8)
(8)
From EquationEquation (9)(9)
(9) , we can observe that the sensitivity is higher when “Zn” is comparable with high fault impedance.
Note:
Assuming “Zf” is much higher than “Zn” (practically Z1, Z2, Z0 are small), then the sensitivity is closer to—1.
If “Zn” is 1/3rd of “Zf” then the sensitivity is −3/4. It shows that the sensitivity is increasing when “Zn” is increased.
4.2. Mathematical steps for sensitivity analysis for phase voltage “Vb”
Differentiating “Vb” with respect to “Zf”, EquationEquation (2)(2)
(2) will be
Where
Let
Solving for A1
Substituting D = Z1 + Z2 + Z0 + 3Zn + 3Zf in EquationEquation (12)(12)
(12)
Therefore
Solving for B1
Substituting D = Z1 + Z2 + Z0 + 3Zn + 3Zf in EquationEquation (15)(15)
(15)
Therefore
Similarly, solving for C1
Substituting D = Z1 + Z2 + Z0 + 3Zn + 3Zf in EquationEquation (18)(18)
(18)
Therefore
Adding EquationEquations (13)(13)
(13) , (Equation16
(16)
(16) ) and (Equation19
(19)
(19) ) to find
Applying EquationEquation (20)(20)
(20) and EquationEquation (2)
(2)
(2) to the sensitivity formulae defined in EquationEquation (5)
(5)
(5)
Substituting D = Z1 + Z2 + Z0 + 3Zn + 3Zf in EquationEquation (21)(21)
(21)
Therefore
Sensitivity of voltage “Vb” with respect to fault impedance “Zf” can be calculated for a range of “Zf” and keeping other parameters constant.
4.3. Mathematical steps for sensitivity analysis for phase voltage “Vc”
Differentiating “Vc” with respect to “Zf”, EquationEquation (3)(3)
(3) will be
where D = Z1 + Z2 + Z0 + 3Zn + 3Zf
Let
Solving for A2
Substituting D = Z1 + Z2 + Z0 + 3Zn + 3Zf in EquationEquation (25)(25)
(25)
Therefore
Solving for B2
Substituting D = Z1 + Z2 + Z0 + 3Zn + 3Zf in EquationEquation (28)(28)
(28)
Therefore
Similarly, solving for C2
Substituting D = Z1 + Z2 + Z0 + 3Zn + 3Zf in EquationEquation (31)(31)
(31)
Therefore
Adding EquationEquations (26)(26)
(26) , (Equation29
(29)
(29) ) and (Equation32
(32)
(32) )
Applying EquationEquation (33)(33)
(33) and EquationEquation (3)
(3)
(3) to the sensitivity formulae defined in EquationEquation (5)
(5)
(5)
Substituting D = Z1 + Z2 + Z0 + 3Zn + 3Zf in EquationEquation (34)(34)
(34)
Sensitivity of voltage “Vc” with respect to fault impedance “Zf” can be calculated for a range of “Zf” and keeping other parameters constant.
4.4. Mathematical steps for sensitivity analysis of neutral voltage “Vn”
Differentiating “Vn” with respect to “Zn”, EquationEquation (4)(4)
(4) will be
where D = Z1 + Z2 + Z0 + 3Zn + 3Zf
Applying EquationEquation (37)(37)
(37) and EquationEquation (4)
(4)
(4) to the sensitivity formulae defined in EquationEquation (5)
(5)
(5)
Similarly, differentiating “Vn” with respect to “Zf”, the EquationEquation (4)(4)
(4) will be
Applying EquationEquation (40)(40)
(40) and EquationEquation (4)
(4)
(4) to the sensitivity formulae defined in EquationEquation (5)
(5)
(5)
Substituting D = Z1 + Z2 + Z0 + 3Zn + 3Zf in EquationEquation (41)(41)
(41)
The focus of this manuscript remains in the zone of mathematical modelling of sensitivity of HIF system by deriving the above EquationEquations (7(7)
(7) )–(Equation42
(42)
(42) ).
The right-hand side of the EquationEquations (9)(9)
(9) and (Equation42
(42)
(42) ) is same. By this, it is inferred that the sensitivity of fault current S(Ifa) and the sensitivity of voltage across the neutral earthing impedance S(Vn) is same for any values of “Zf”.
The sensitivity value has both magnitude and angle. With reference to the HIF phenomena in a distribution system, the practical problem becomes exactly how to detect a high impedance fault. Hence, the magnitude of sensitivity is only supposed to be considered and analysed, the “angle” is not analysed in this paper. Sensitivity analysis has been used to transfer the concept of “parameter tuning” followed in control system applications. This use is backed by the experience-based knowledge imparted in practical power system work. In which parameter to be chosen are source impedance, transformer impedance, line impedance, neutral impedance, earth impedance.
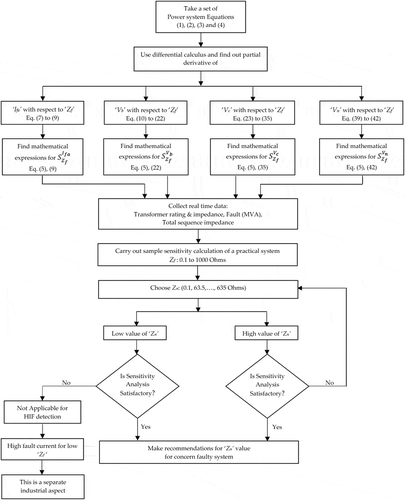
A sample sensitivity calculation of a practical system is presented in the following section 5. In order to understand the above mathematical steps, a flow chart is given in Figure .
4.5. Flow chart for mathematical steps and sensitivity analysis
Figure 3. Flowchart
5. Sample sensitivity calculation of a practical system (MV OHL)
The total sequence impedance for a practical system (Velmurugan, Citation2012) is given below in Table . A fault level of 571.56 MVA at the HV bus is considered for ground-fault current computations.
Table 1. Total sequence impedances (Z1, Z2, Z0) in a practical system
5.1. Neutral earthing impedance “Zn” values
To align with the IEEE Std. 142–1991 recommendation (IEEE Std. 142-), which allows a maximum fault current of 10 A for high resistance earthing, the neutral earthing impedance “Zn” is chosen as 635 Ω for analysis, and the selected value of 63.5 Ω is 10% of 635 Ohms. Other different values of “Zn” can be selected for analysis. Particularly, Zn = 0.1 Ω, which is a practical value for a neutral, directly grounded system. The fault impedance “Zf” value can be considered above 1000 Ω, but for the sake of presenting the results, the authors decided to limit this value.
5.2. Contribution of sensitivity analysis
Contributions of this analysis are broad and aim to (a) develop a suitable formulation for the sensitivity of the performance figures in a faulted power system and (b) fix a suitable tuning parameter in the case of a power system with a high fault impedance, subjected to a single phase to ground fault for controlling the sensitivity. Given the broad contributions of this analysis, the sample sensitivity calculations for a medium voltage overhead line system (MV OHL) are performed, and the results are presented in both tabular and graphical forms.
5.3. Sensitivity analysis of phase voltage “Vb”
EquationEquation (22)(22)
(22) is used for the analysis of the sensitivity of voltage “Vb” at the fault location. The sensitivity results S(Vb) for the phase voltage “Vb” are presented in Table and Figure . For a higher range of fault impedances, it can be observed that the sensitivity varies, based on the neutral earthing impedance. Notably, the sensitivity results S(Vb) are higher at a high neutral earthing impedance. Thus, a high neutral earthing impedance (resistance) is recommended for the detection of HIF. Measuring the voltage “Vb” is impractical at the fault location in real-time.
Figure 4. Sensitivity of phase voltage S (Vb) curve for various “Zn”.
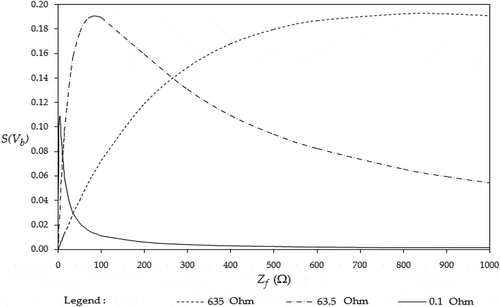
Table 2. Magnitude of the sensitivity of healthy phase voltage S(Vb)
5.4. Sensitivity analysis of phase voltage “Vc”
EquationEquation (35)(35)
(35) is used for the analysis of the sensitivity of voltage “Vc” at the fault location. The sensitivity results S(Vc) for phase voltage “Vc” are presented in Table and Figure . For a higher range of fault impedances, it can be observed that the sensitivity varies, based on the neutral earthing impedance. Notably, the sensitivity results S(Vc) are higher at a high neutral earthing impedance. Thus, a high neutral earthing impedance (resistance) is recommended for the detection of HIF. Measuring the voltage “Vc” is impractical at the fault location in real-time.
Figure 5. Sensitivity of phase voltage S (Vc) curve for various “Zn”.
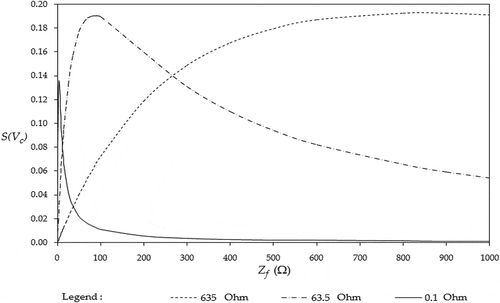
Table 3. Magnitude of the sensitivity of healthy phase voltage S(Vc)
5.5. Sensitivity analysis of fault current “Ifa” and neutral voltage “Vn”
EquationEquation (9)(9)
(9) is used for the analysis of the sensitivity of the fault current “Ifa” and EquationEquation (42)
(42)
(42) is used for the analysis of the sensitivity of the neutral voltage “Vn.” The sensitivity results S(Ifa) for the fault current “Ifa” and the sensitivity results S(Vn) for the neutral voltage “Vn” are exhibited in Tables – and Figure . For a higher range of fault impedances, it can be observed that the sensitivity varies based on the neutral earthing impedance. It should also be noted that the sensitivity results for S(Ifa) and S(Vn) are higher at high neutral earthing impedance. Therefore, a high neutral earthing impedance (resistance) is recommended for the detection of HIF. The neutral earthing impedance value should be selected carefully for a given system keeping in mind the protection requirements to avoid over voltages in the system. Measuring the fault current “Ifa” and neutral voltage “Vn” is practical and can be implemented at the site.
Figure 6. Sensitivity of fault current S (Ifa) and neutral voltage S (Vn) curves for various “Zn”.
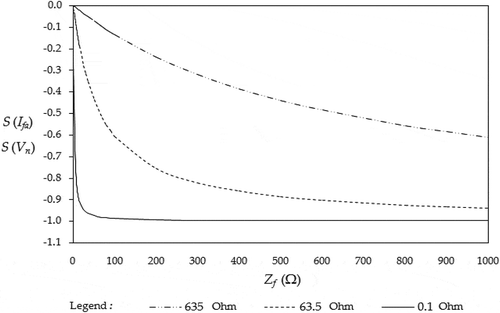
Sensitivity of fault current S(Ifa) and neutral voltage S(Vn) in the case of the neutral directly grounded system:
Table 4. Magnitude of the sensitivity of fault current S(Ifa)
Table 5. Magnitude of the sensitivity of neutral Voltage S(Vn)
It can be noted from Figure that the sensitivity of S(Ifa) and S(Vn) is poor when the fault impedance is high, say 15 Ω or more in the case of the neutral directly grounded system (refer 0.1 Ω curve in Figure ). This also suggests a high resistance grounded system for the detection of high impedance fault.
6. Conclusion
It has been observed on-site that a high impedance fault leads to a low value of fault current whose appearance is in the form of a weak flash or flow. Despite this, the controlling parameter must be known for which the sensitivity analysis is essential. Thus, a sensitivity analysis was performed to analyse the degree of severity of the high impedance fault. The concept of a mathematical function of several variables was employed to analyse the behaviour of the HIF, logically. The essence of this statement lies in the fact that a specific parameter needs to be selected to tune the sensitivity of the parameter from several available parameters (e.g., source, transformer, line, neutral, and earth impedance). The same sensitivity analysis can be used as a design tool to fix the value of the neutral earthing impedance and observe and optimise the voltages in the healthy phases by an expert power system engineer.
Based on the analysis, it can be concluded that HIF detection signals should be tapped from the neutral of the supply system with high neutral earthing impedance (resistance). It is also suggested that the high current transformation ratio for signal transformation from a real power system distribution lines should be avoided.
Abbreviations
| G | = | Generation |
| HV | = | High Voltage (33 kV) |
| HIF | = | High Impedance Fault |
| MV | = | Medium Voltage (11 kV) |
| ST | = | Station Transformer |
| L | = | LV Load via step down transformer |
| F | = | Fault |
| OHL | = | Overhead line |
| DWT | = | Discrete wavelet transform |
| ANFIS | = | Adaptive neuro-fuzzy inference system |
| EMTP | = | Electromagnetic transient program |
| ETAP | = | Electrical transient and analysis program |
| PSCAD | = | Power system computer-aided design |
| MATLAB | = | Matrix laboratory |
| Nomenclature | = | |
| = | An operator | |
| = | Fault impedance | |
| = | Line impedance | |
| = | Line voltages | |
| = | Neutral earthing impedance | |
| Ω | = | Ohm |
| = | Sequence impedances | |
| = | Single phase to ground fault current | |
| = | Sensitivity of parameter “y” with respect to parameter “x” | |
| = | Source impedance | |
| = | Transformer impedance |
Author Contributions
Dr A. B. Chattopadhayay proposed sensitivity analysis on P. Velmurugan’s topic of detection of HIF in the desert region. Rigorous mathematical steps for sensitivity analysis using differential calculus are carried out. Sample sensitivity calculations are carried out by P. Velmurugan using practical data.
Conflicts of Interest
The authors declare no conflict of interest.
Additional information
Funding
Notes on contributors

P. Velmurugan
Mr. P. Velmurugan is currently a Research Scholar at BITS-Pilani, U.A.E Campus. His area of research includes Detection of High Impedance Fault (DoHIF).Author possesses an extensive experience of over 33 years in Power Generation, Transmission and Distribution including System studies (Power Flow, Fault Analysis, Graded Protection and Unit Protection setting Calculations, Harmonic Analysis, Motor Starting, Substation Earthing, and Stability analysis) using CYME, EDSA, EMTP and/or ETAP software. In 2014, he worked as Lead Power system Engineer in a rare kind of project in UAE. He has got vast experience in the area of power system protection and power system grounding.
References
- Chakraborty, S., & Das, S. (2018). Application of smart meters in high impedance fault detection on distribution systems. IEEE Transactions on Smart Grid, 10(3), 3465 - 3473. https://doi.org/10.1109/TSG.2018.2828414
- Costa, F. B., Souza, B. A., Brito, N. S. D., Silva, J. A. C. B., & Santos, W. C. (2015). Real-time detection of transients induced by high impedance faults based on the boundary wavelet transform. IEEE Transactions on Industry Applications, 51(6), 5312–5323. https://doi.org/10.1109/TIA.2015.2434993
- Cui, Q., El-Arroudi, K., & Weng, Y. (2019). A feature selection method for high impedance fault detection. IEEE Transactions on Power Delivery, 34(3), 1–16. https://doi.org/10.1109/TPWRD.2019.2901634
- Ghaderi, A., Ginn, H. L., III, & Mohammadpour, H. A. (2017, February). High impedance fault detection: A review. Electric Power Systems Research, 143(1–15), 376–388. https://doi.org/10.1016/j.epsr.2016.10.021
- Gomes, D. P. S., Ozansoy, C., & Ulhaq, A. (2017). High-sensitivity vegetation high impedance fault detection based on signal’s high-frequency contents. IEEE Transactions on Power Delivery, 33(3), 1398 - 1407. https://doi.org/10.1109/TPWRD.2018.2791.1986
- Power System Analysis, Grainger, J. J., & Stevenson, W. D., Jr. (1994). McGraw-Hill series in electrical and computer engineering, International Edition.
- Hayward, V., & Cruz-Hernandez, J. M. (1998). Parameter sensitivity analysis for design and control of force transmission systems. ASME Journal of Dynamic Systems, Measurement, and Control, 120(2), 241–249. https://doi.org/10.1115/1.2802415
- Hubana, T., Saric, M., & Avdakovic, S. (2018). High-impedance fault identification and classification using a discrete wavelet transform and artificial neural networks. Elektrotehniški Vestnik, 85(3), 109–114. https://www.researchgate.net/publication/326175613
- IEEE Std. 142-1992. IEEE recommended practice for grounding of industrial and commercial power systems. IEEE Industry Applications Society.
- Kothari, D. P., & Nagrath, I. J. (2008). Power system Engineering (2nd ed.). Tata McGraw-Hill Publications.
- Nayak, P. K., Sarwagya, K., & Biswal, T. (2016, December). A novel high impedance fault detection technique in distribution systems with distributed generators. IEEE conference paper. https://doi.org/10.1109/NPSC.2016.7858855
- Papathanassiou, S., Tsili, M., Georgantzis, G., & Antonopoulos, G. (2007). Enhanced earth fault detection on MV feeders using current unbalance protection. CIRED 2007.
- Sarwar, M., Mehmood, F., Abid, M., Khan, A. Q., Gul, S. T., & Khan, A. S. (2019). High impedance fault detection and isolation in power distribution networks using support vector machines. Journal of King Saud University Engineering Sciences, 1–12. https://doi.org/10.1016/j.jksues.2019.07.001
- Sedighi, A. R. (2014, August). A new model for high impedance fault in electrical distribution systems. International Journal of Scientific Research in Computer Science and Engineering, 2(4), 6–12.
- Song, X., Gao, F., Chen, Z., & Liu, W. (2019). A negative selection algorithm-based identification framework for distribution network faults with high resistance. IEEE Access, 7, 109363–109374. https://doi.org/10.1109/ACCESS.2019.2933566
- Tengdin, J., Westfall, R., Stephan, K. 1996. High impedance fault detection technology. IEEE power system relaying committee working group D15 report.
- Veerasamy, V., Abdul Wahab, N. I., Ramachandran, R., Mansoor, M., Thirumeni, M., & Othman, M. L. (2018, November). High impedance fault detection in medium voltage distribution network using discrete wavelet transform and adaptive neuro-fuzzy inference system. Energies, 11(1–24), 3330. https://doi.org/10.3390/en11123330
- Velmurugan, P. (2012, March 17). Test reports on trial earthing in AADC network. TWINVEY electric consultancy.
- Weir, M. D., Hass, J., & Giordano, F. R. (2005). Thomas’ Calculus (7th ed.). Pearson Education.