
 ?Mathematical formulae have been encoded as MathML and are displayed in this HTML version using MathJax in order to improve their display. Uncheck the box to turn MathJax off. This feature requires Javascript. Click on a formula to zoom.
Abstract
The paper describes development of a multi-criteria decision support system (MCDSS) to improve the quality of school education. It is proposed to apply interpretable machine learning models for making decisions on improving the quality of education in secondary schools. Existing DSS are based on the expert judgement, which can be subjective. In addition, the large amount of data and features makes manual analysis difficult. Our approach is referred to as MCDSS with “black boxes” explainer, it consists of three stages. First, we develop the target indicators that measure the quality of education. A set of four features of quality of education (Q-Edu) has been developed. Secondly, we build regression models that link the data of the national educational database (NEDB) with target indicators. Thirdly, we use machine learning model interpreters to develop recommendations. The disadvantage associated with the difficulties of interpreting the results of models is overcome by SHAP (SHapley Additive exPlanations), which is used as a basis for developing recommendations for what features of educational institution could be altered in order to improve quality indicators. Using the described process, we, in particular, revealed the positive impact of the location of the school, ratio of experienced teachers, sports, technical and art studios on Q-Edu indicators. The ratio of experienced teachers and, at the same time, young teachers younger than 25 year positively affects the number of significant student achievements. The proposed universal approach reduces the subjectivity and laboriousness of parameter significance determination in MCDSS.
PUBLIC INTEREST STATEMENT
Secondary education is a state-guaranteed free education level, which is an important link in the formation of personality. One of the task is to ensure equal access to quality education, regardless of regional location, language of instruction and socio-economic status of the family. In this regard, it is necessary to make decisions to improve the quality of education both in general and in a separate school. We offer a decision support system that uses data from the national and international rating agencies and national educational database (NEDB).
To make a decision, we proposed 4 target parameters called Q-Edu, which describe academic achievements and learning outcomes.
These Q-Edu are associated with input NEDB data using a non-linear regression model. We use SHAP (Shapley Additive exPlanations) to evaluate the effect of NEDB parameters in the model. The explanations received are the basis for making informed decisions to improve the quality of education.
1. Introduction
In 2015, at the UNESCO World Education Forum, more than 180 countries, including Kazakhstan, adopted a new concept for the development of education until 2030. The essence of this new concept is reflected in the fourth UN goal in the field of sustainable development “Quality education for all”—to provide inclusive and equitable quality education and promote lifelong learning opportunities for all (UNESCO, (Citationn.d.)). To achieve the Sustainable Development Goal-4, it is necessary to accomplish 7 tasks: universal primary and secondary education, early childhood development and universal pre-school education, equal access to technical/vocational and higher education, appropriate skills for decent work, gender equality and inclusiveness, universal youth literacy, education for sustainable development and global citizenship. Countries around the world should make every effort to achieve this goal in the field of sustainable development by 2030. The new concept of education was reflected in the strategic documents on the development of education in Kazakhstan.
Currently in Kazakhstan there are more than 7 thousand schools with 3.2 million pupils and 340 thousand teachers. For the timely identification of problems, educational monitoring is carried out in the National Educational Database (NEDB). The NEDB currently contains over 10 million data records for all schools.
Due to the fact that the database has accumulated a significant amount of information, it became possible to use machine learning (ML) methods for data analysis.
ML methods provide solutions to problems that are difficult to formalize and can be applied to support decision-making. One of the problems of ML is the difficulty of evaluating the impact of individual features on the predicted result. The problem is solved by using interpretable machine learning algorithms (Biran & Cotton, Citation2017; Lundberg & Lee, Citation2017; Ribiero et al., Citation2016).
In this paper, we consider the possibility of using interpretation algorithm as part of the multi-criteria decision support system (MCDSS) for quality management of secondary education.
Our approach, which may be referred to as MCDSS based on the explanation of “black boxes” (MCDSS&BBE), consists of the following key steps:
Development of the indicators of the quality of education (Q-Edu);
Development of machine learning models in which Q-Edu indicators are target variables, and NEDB and national testing center (NTC) data are input features.
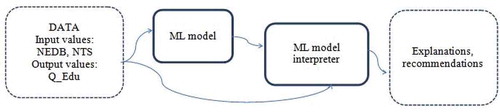
The stages lies at the basis of our research are shown on the Figure .
Figure 1. Flowchart of the research.
The main contributions of the paper are:
we offer a system of indicators to assess the quality of secondary education;
we propose to use a non-linear regression model linking these indicators to the features of secondary education institutions;
we have developed a method to use machine learning model interpreters as part of MCDSS.
The following sections constitute our efforts presented in the paper.
Section 1. We consider related works and drawbacks of traditional MCDSS.
Section 2. In this section, we describe the set of indicators of Q-Edu, built on the basis of several key criteria and indicators of rating agencies that determine the level of education of school graduates.
Section 3. We consider the approach to building MCDSS for school quality management using the aforementioned Q-Edu system.
Section 4. We describe the data used in the research. The calculation of 4 indicators of the quality of education is also considered in detail.
Section 5. This section is devoted to the results obtained and their discussion.
Section 6. Conclusion with a summary of results and discussion of future research directions.
2. Related works
Our work is motivated by the ever-growing importance and relevance of ML, MCDSS and systems of explaining the work of “black boxes” of ML, which we discuss in Section 4.
ML is widely used in the educational field. For example, paper (Ola & Pallaniappan, Citation2013) offers a model for evaluation of instructors’ performance to help school administration in decision-making, optimize students’ academic achievements and improve the education level. Various data mining and machine learning algorithms to predict student academic performance are considered in (Ogor, Citation2007). The paper (Beggrow et al., Citation2014) studies the performance of machine learning algorithms in evaluation quality of students’ written explanation on a complex topic. The work (Singh & Lal, Citation2013) focuses on the using machine learning techniques to assess MOOCs which can be a useful tool to achieve better learning outcomes.
Methods of machine learning include two main groups of algorithms (Muhamedyev, Citation2015): supervised learning and unsupervised learning (cluster analysis). In particular, the use of cluster analysis methods, among which can be listed isometric mapping (ISOMAP) (Tenenbaum et al., Citation2000), locally linear embedding (LLE) (Roweis & Saul, Citation2000), t-distributed stochastic neighbor embedding (t-SNE) (Maaten & Hinton, Citation2008), kernel component analysis (KPCA) (Schölkopf et al., Citation1998), and multidimensional scaling (MDS) (Borg et al., Citation2003), allow to assess the regional imbalance in the quality of education, “overestimate” or “underestimate” of grades, identify organizations with abnormal values of features, etc.
However, the accumulated data can be used not only to identify various imbalances, anomalies, etc., but also to develop systems of multi-criteria analysis and decision support (multiple-criteria decision support system (MCDSS) (Mardani et al., Citation2015; Scott et al., Citation2015).
Traditionally, MCDSS use knowledge of experts that are consolidated to form a solution. The methods of obtaining knowledge include: AHP (analytical hierarchy process) (Saati & Andreychikova, Citation2015), PAPRIKA (Potentially all pairwise rankings of all possible alternatives) (Hansen & Ombler, Citation2008), PROMETHEE (Preference Ranking METHod for Enrichment of Evaluations) (Brans & Vincke, Citation1985), TOPSIS (method for the solution) (Lai et al., Citation1994), ELECTRE (Figueira et al., Citation2005). The solutions listed above are used to form the solution, as well as Weighted Linear Combination (WLC), Ordered Weighted Averaging (OWA) (Yager, Citation1988), Bayesian networks (Abaei et al., Citation2017; Mukhamediev et al., Citation2019), fuzzy logic (Charabi & Gastli, Citation2011), Analytical Network Process (ANP) (Köne & Büke, Citation2007), etc.
Despite the solid theoretical ground for MCDSS, using the knowledge of experts, there is a inherit subjectivity in the decision-making process. In addition, with the increase in data volumes and the number of features taken into account, the complexity of expert assessment itself increases significantly. For example, the AHP technique requires , pairwise comparisons for n features, which can significantly complicate the work with n > 100.
An additional disadvantage of the existing MCDSS is that for many tasks, a proprietary combination of the above-mentioned methods is being developed. This makes it difficult or impossible to compare MCDSS with each other. For example, work (Baykasoglu & Durmusoglu, Citation2014) deals with the task of selecting a primary school. A special MCDSS based on Fuzzy Cognitive Map (FCM) and ANP has been developed. Forty-five education experts and 300 parents were involved in forming the selection criteria. Nine basic criteria and 44 sub-criteria for decision making were formed. Job (Kabak & Dağdeviren, Citation2014) uses MCDSS based on ANP-PROMETHEE to solve the problem of selecting a university by a student. Twenty-two factors are considered, each of which is further described by 18 sub-factors.
These shortcomings make it necessary to look for other decision-making support methods that would be less sensitive to the opinions of experts and could process large amounts of data with a large number of heterogeneous features. Supervised learning method provide this opportunity. However, until now, the use of machine learning models encountered the problem of interpretability, the inability of many algorithms to give explanations to the result obtained. Only recently obtained results in the development of explanatory systems (Lundberg & Lee, Citation2017; Ribiero et al., Citation2016) allow not only to apply them to assess the weight of machine learning model features, but also, in our opinion, to use them in the decision support process.
We propose to train a mode, and then to use interpretations of the results to make recommendations for decision making support.
The proposed approach mostly over comes the above-mentioned disadvantages of MCDSS. First, it reduces subjectivity and laboriousness of definition of importance of parameters as the specified process is carried out automatically. Second, it describes what we consider to be a fairly versatile scheme for making recommendations based on a large amount of heterogeneous data.
To the best of our knowledge, a similar approach has not been proposed in existing literature.
3. Q-Edu indicators
To apply machine learning methods, a system of target features is needed, the values of which could be used to train models. In our system, we believe the main task of the secondary school is education quality, which can be assessed in various ways based on the available objective data.
In Kazakhstan data collection in the field of education is mostly centralized, and most of the data is stored in NEDB. NEDB contains data on more than 20 thousand educational organizations:
location, type, internal order;
material support (library, food, heating, repair, room space, etc.);
staff (count, rank, experience, etc.);
contingent (language of education, children with special needs, gender and ethnic composition, etc.);
availability of school education (clubs, transport, food, etc.);
learning outcomes (academic performance).
The source of data on the final results of training and the distribution of scholarships is the National Testing Center (NTC).
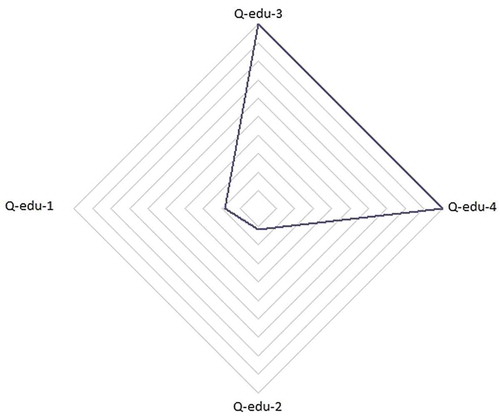
Given the available data, we have proposed 4 indicators of the quality of education Q-Edu:
Q-Edu-1—The percentage of graduates who received a scholarship for the top specialties in the top universities;
Q-Edu-2—The number of elite achievements (golden medal (Altyn Belgi), victories in national and international competitions);
Q-Edu-3—Percentage of graduates with a passing score in the process of the unified national testing (UNT);
Q-Edu-4—Percentage of graduates who continue their education after graduation.
Q-Edu-1 and Q-Edu-2 features are designed to determine the top schools, due to the fact that Q-Edu-1 better reflects the final outcome of the education, Q-Edu-2 shows positive activity and dedication of students during their studies. The Q-Edu-3 and Q-Edu-4 features are aimed to asses average or “regular” schools, due to the fact that for average schools the fact that graduates overcame the UNT threshold score and continued their education are crucial indicators.
Figure shows the Q-Edu features for one of the schools in Kazakhstan.
Figure 2. Q-Edu features for one of the schools in Kazakhstan.
For the calculations of Q-Edu-1, the following were used: National ranking of universities of Kazakhstan for 2018 (eGov, (Citationn.d.)), International QS EECA rating (Symonds, Citation2019), passing points for a scholarship by profession for 2018 (Passing points for a scholarship for specialties for 2018, 2019). The use of data from two rating agencies allows, in our opinion, to increase the degree of objectivity in the selection of higher education institutions, in which graduates continue to study.
The proposed Q-Edu set of indicators allows to approach the development of MCDSS based on machine learning models.
4. The approach to the development of MCDSS on the quality management of school education
Traditionally, MCDSS are built in such a way that an important part of them is the knowledge extraction system (1) and the consolidation of feature estimates to obtain an overall assessment of the analyzed object (2).
The use of machine learning methods allows to train a domain model and evaluate the object (in our case, an educational institution) based on its features. That is, steps (1) and (2) will be performed automatically, and the interpretation of individual features impact on the predicted results may be used for decision making.
To create a regression model Q-Edu indicators are used as target features.
The general scheme of work consists of two steps (Figure ):
First, we build a non-linear model based on supervised learning method (ML model), in which we take into account the maximum possible number of features. As such a model, a regression was built using Gradient Boosting. Target features are Q-Edu-1,2,3,4.
Secondly, we estimate the weight of the contribution of the features to the result achieved by the model as a whole and by the individual school (ML model interpreter or “black boxes” explainer).
That is, the model is interpreted to explain the current quality of the school, and recommendations can be made based on this interpretations—which features of the school could be altered in order to improve its quality indicators.
Figure 3. MCDSS&BBE workflow schema.
The problem of assessing the influence of various features in machine learning models is highly relevant (Biran & Cotton, Citation2017). In particular, there are examples of training models, when the features of the current data set led to the correct classification results for a specific case with an absolutely incorrect recognition model (Ribiero et al., Citation2016). The mentioned work describes the task of recognizing texts of atheistic and religious content, when it turned out that the model correctly distinguished the former from the latter, but interpretation of the model demonstrated that the model is actually inadequate and overfitted on the data.
Let’s consider a simple case of interpreting model results when the response of the model is the sum of the feature values (set X) multiplied by the model coefficients (set ) (or a linear regression model):
, where
,
,
—linear regression model hypothesis function.
The linear regression model is easily interpretable, since the weight of the i-th feature is determined by the coefficient .
However, in the case of complex non-linear dependencies and significant correlation of features, such a simple interpretation is difficult. In this case, the model may be referred to as “black box”, that is, a kind of closed system that receives data at the input, perform some hidden, implicit computations and outputs the result. What is being done inside the “black box”, how the model has linked the input data with the result remains incomprehensible.
In contrast to the “black” box, we can call the “white” box of machine learning a model in which the patterns of obtaining the result are completely known. Accordingly, a “gray” box is a model in which the indicated patterns are partially known.
To turn a black box into white or gray, that is, for understanding how individual features affect model prediction in regression and classification problems, useful tools are: Treeinterpreter for decision trees, LIME (Local Interpretable Model-agnostic), DeepLIFT, similar to it Layer-Wise Relevance Propagation and the most recent method described in 2017—SHAP (SHapley Additive exPlanations).
Information about LIME is given in (Ribeiro et al., Citation2016; Understanding Model Predictions with LIME, Citation2018). There is a project on Github (Lime, Citation2019). Applications of the method are described in (Local Interpretable Model-Agnostic Explanations (LIME): An Introduction, Citation2019, A Complete Machine Learning Walk-Through in Python: Part Three Interpreting a machine learning model and presenting results, Citation2018). LIME does not depend on a machine learning model and can be applied to any model which results can be represented as probability (for example, softmax). In short, the essence of the method lies in the fact that the model assumes a linear dependence of the classifier’s output on changes in the features of an object in a small range. A linear interpretable model is trained on small perturbations of the features of the object being evaluated (“noise” is added), achieving a good approximation of the original model in this small range. Noise is created differently for different types of tasks, for example, by adding noise to continuous functions, deleting words or hiding parts of images. However, this relative simplicity of the LIME interpreter is the cause of its main disadvantage. For complex, difficult to interpret models, linear approximations may be inadequate, even if a small area around the feature values is analyzed. In such cases, LIME may make erroneous recommendations.
In turn, SHAP (Lundberg & Lee, Citation2017; Shap, Citation2019) is qualitatively different from the simple search for correlations, in view of the fact that it uses the model to gain knowledge of non-linear and non-monotonic interdependencies of features influencing the final result. The method assigns a value of importance to each feature influence on each object. To calculate this effect, the model f(S∪{i}) is trained with this feature and the other model f(S) is trained with the excluded feature. Then the predictions of these two models are compared at the current input signal f(S∪{i} (xS∪{i}))—fS(xS), where xS represents the values of the input features in the set S. Since the effect of eliminating a feature depends on other features in the model, this difference is calculated for all possible subsetsS⊆n\{i}. Then the weighted average of all possible differences is calculated:
This is the assessment of the importance (influence) of the features on the assessment of the model. This approach, based on game theory, according to the conclusions of the authors of the algorithm, provides a common interpretation and suitability for a wide range of machine learning methods.
SHAP, combined with a non-linear regression model that links more than 200 features with Q-Edu targets, was used in the development of an MCDSS&BBE to improve the quality of school education.
5. Data
For calculations, we used data for the 2017–2019 academic years. Taking into account the available variables in the databases of the NEDB and the NTC, about 200 features of general secondary education were identified, including about 10, obtained as a result of special processing of initial features (feature engineering).
The best specialties were selected from the list of passing points for a scholarship in the field of specialties for 2018, which were considered specialties with a passing grade for receiving a scholarship from 100 to 140 according to the UNT. As a result, 47 best specialties were selected (Top specialties list 2018, 2019).
Based on the processed data, 4 features of the quality of education (Q-Edu) were calculated.
Q-Edu-1 was calculated twice: using data from the national ranking of the best universities in Kazakhstan (Q-Edu-1-IQAA) and 10 universities from the international QS EECA rating (Q-Edu-1-QS).
For the calculation of Q-Edu-1-IQAA, according to the national rating, the Independent Agency for Quality Assurance in Education selected universities with high marks (from 89 out of 100%) on three features:
the first feature reflects the academic activities of the university, the maximum value is 70%, the data provided by the university are used, they are checked and included in the calculation, as well as data obtained from independent sources;
the second feature reflects the expert assessment of the university’s reputation; the maximum value is 15%; experts are determined by the agency;
the third feature reflects the university’s assessment by employers, the maximum value of 15%.
Similarly, the first 10 Kazakhstani universities were selected to calculate Q-Edu-1-QS in the international QS EECA ranking, which determines the top 300 universities in the developing countries of Europe and Central Asia. The following features were used in selecting universities:
academic reputation based on large international surveys has a maximum weight of 30%;
employer reputation, maximum weight 20%;
teacher to student ratio based on the number of students taught by one teacher, maximum weight 10%;
the ratio of scientific articles published in the database of scientific articles Scopus and teachers, maximum weight 10%;
university cooperation with other universities of the world, maximum weight 10%;
fame on the Internet, based on a rating from Webometrics, which reflects the degree of popularity of the university on the Internet, maximum weight 5%;
number of doctors of science (PhD) at the university, maximum weight 5%;
citation of scientific articles based on the Scopus database, maximum weight 5%;
the last two features represent the ratio of foreign teachers and students and the total number of teachers and students at the university, the maximum weight is 2.5% for foreign teachers and 2.5% for foreign students.
As a result, 7 universities were selected from the National ranking of the best universities of Kazakhstan and 10 universities from the international QS EECA rating.
Universities from the National ranking:
KazNU named after al-Farabi
ENU named after L.N. Gumilyov
KBTU
Satbayev university
KarSTU
KarEU of Kazpotrebsoyuz
KazNPU named after Abay
Universities from the international ranking are listed in order of their ranking:
KazNU named after al-Farabi
ENU named after L.N. Gumilyov
Satbayev university
KBTU
KazNAU
SKSU after M.Auezov
KazNPU named after Abay
KarSU named after E.A. Buketov
KarSTU
EKSTUnamed after D. Serikbayev
Further in the paper, Q-Edu-1-IQAA is referred to as Q-Edu-1.
6. The results and discussion
On the basis of available data and calculated Q-Edu-1, 2, 3, 4 quality indicators, machine learning models were built and trained to predict quality features. As a result of the experiments, a gradient boosting model was applied as implemented in the scikit-learn package (Scikit-learn: machine learning in Python, Citation2019). Built models consisted of 100 trees, each with a maximum depth of 5.
As a result, 4 models were built, each for its own Q-Edu feature, with coefficients of determination of 0.98, 0.84, 0.77, 0.94 for Q-Edu-1, 2, 3,4, respectively.
Then using SHAP, the model’s features were ranked in terms of their weight in the process of getting the result.
Figure 4. The influence of factors on the feature Q-Edu-3 part 1/2 (Proportion of graduates who scored a passing score on the UNT).
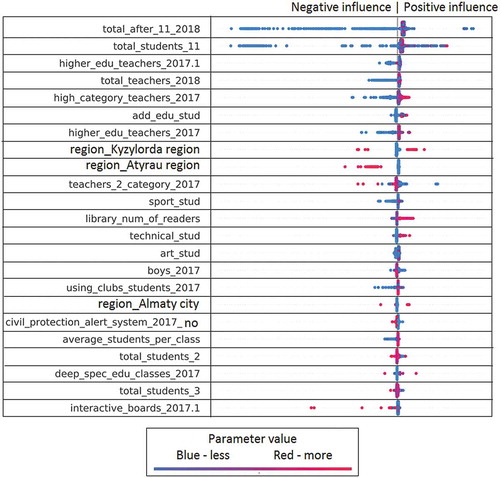
For example, in Figure , each line corresponds to a specific feature (features explanation in the Appendix 1 (Symagulov, Citation2019)). Features are sorted by significance (SHAP value) in descending order. Each point represents a separate school. Its position along the horizontal axis shows how negative (left) or positive (right) this factor influenced the Q-Edu-3 indicator of this school. At the same time, the color of the dot indicates the value of the factor—the red dots have a high value of this factor (higher than the average value in the sample), and the blue color, respectively, a low value. For categorical/binary features, the color of the dots means respectively belonging to a category or the presence/absence of a feature.
Consider, for example, the “Region_Almaty city” feature, which means the location of a school in the Almaty region. Belonging to this region has a positive effect on the Q-Edu-3 feature in the trained model, and, accordingly, the location of the school in another region in some cases leads to a small negative impact.
We see that the location of the school (region_XXX) affects the quality of education. This reflects a regional imbalance (Figures , , , , and ). We can clearly see the positive impact of higher category teachers and the negative impact of a large number of second category teachers on Q-Edu-3 (Figure ). The results show that there are more readers in the library (library_num_of_readers) (Figure ), sports (sports_stud) (Figure ), technical (technical_stud) (Figure ), art (art_stud) (Figure ) and other clubs (other_stud) in schools of good quality. At the same time, the additional educational clubs (add_edu_stud) are poorly related to Q-Edu (Figure ).
Involvement of teachers of the highest category (high_category_teachers), few teachers of the 2nd category (teachers_2_category) (Figure ), experienced teachers (experience_teachers_20+_years) and young teachers (age_teachers_under_25) (Figure )—are positive factors influencing the number of elite achievements (gold medal (AltynBelgi), victories in national and international competitions (Figure ) and an increase in the Proportion of those who scored a passing score on the UNT (Q-Edu-3). Interestingly, a large number of computers (Total_comp) (Figure ) and the language of education do not change the Q-Edu indicators.
It should be noted that a high degree of influence does not automatically mean the existence of cause-effect relationships, but only indicates that the model uses certain feature as the most suitable for statistically inferring target indicator. In other words, features with high significance allow models built on the basis of decision trees to get the greatest gain in information entropy.
For example, a large amount of free_hot_food (Figure ) is usually in schools where Q-Edu-4 (Percentage of who continues their education after graduation) is low. Similarly, hot_food (Figure ) has a negative effect on Q-Edu-3 (Proportion of graduates who scored a passing score on the UNT). It can be assumed that improving these indicators will improve the quality of education. However, the identified pattern only reflects the fact that students from low-income families are less likely to continue their studies at universities. Another example is the school density (school_density_in_3 km), the high value of which negatively affects Q-Edu-4 (Figure ). This can be explained by the fact that in case of high school density, competitive environment leads to only a few schools attract most of the best students.
Thus, one of the limitations of the presented model is the need for a semantic interpretation of patterns revealed during modeling.
Figure 5. The influence of factors on the feature Q-Edu-3 part 2/2 (Proportion of graduates who scored a passing score on the UNT).
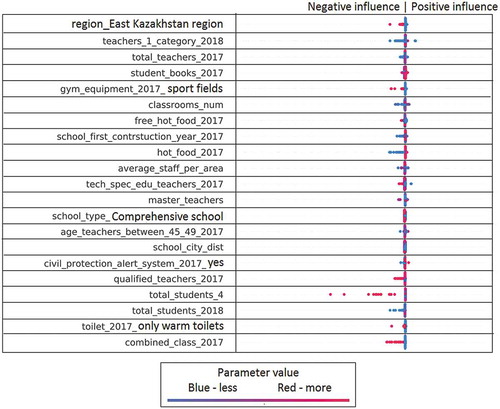
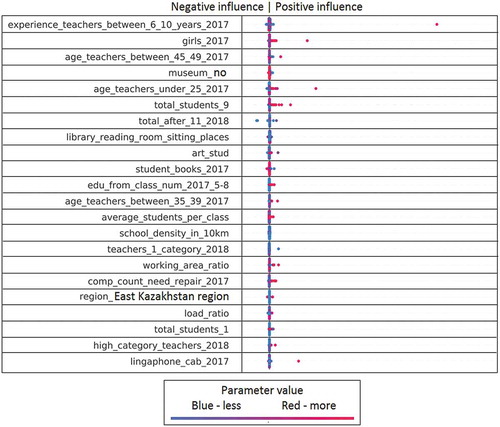
Figure 6. The influence of factors on the feature Q-Edu-4 part 1/2 (Percentage of graduates who continue their education after graduation).
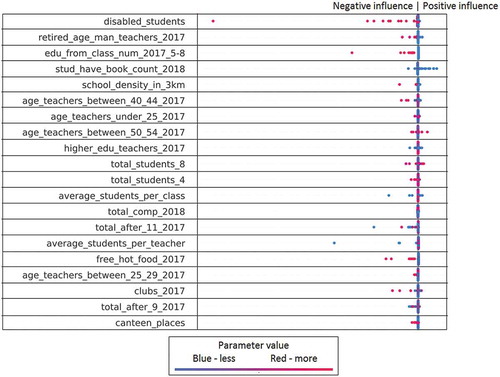
Figure 7. The influence of factors on the feature Q-Edu-4 part 2/2 (Percentage of graduates who continue their education after graduation).
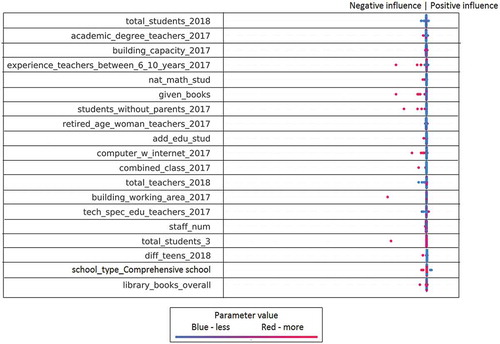
Figure 8. Influence of factors on the feature Q-Edu-1 part 1/2 (Percentage of graduates who received a scholarship for the best specialties at the best universities).
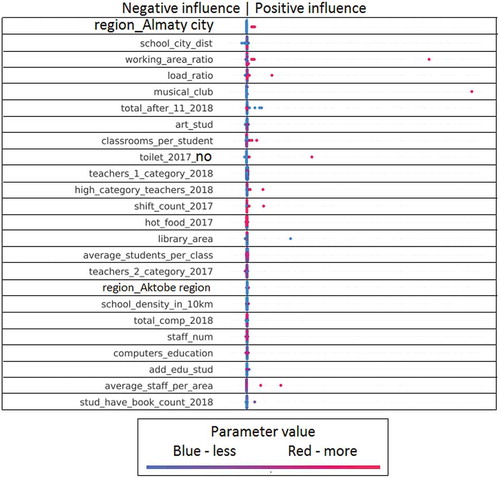
Figure 9. The influence of factors on the feature Q-Edu-1 part 2/2 (Percentage of graduates who received a scholarship for the best specialties at the best universities).
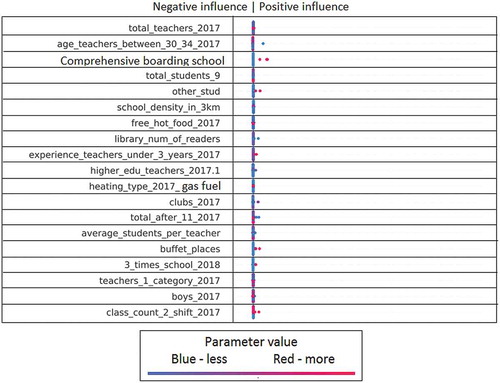
Figure 10. The influence of factors on the feature Q-Edu-2 part 1/2 (Number of elite achievements (gold medal (AltynBelgi), victories in national and international competitions)).
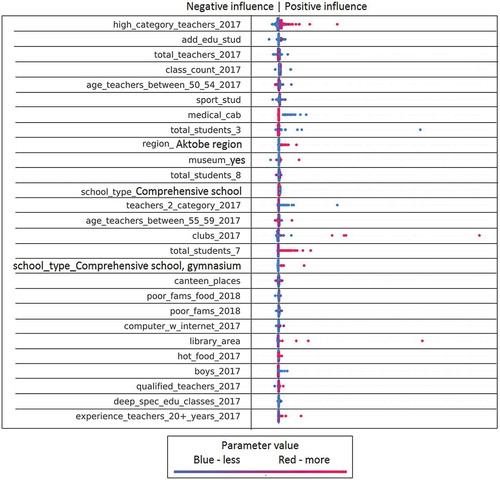
Figure 11. The influence of factors on the feature Q-Edu-2 part 2/2 (Number of elite achievements (gold medal (Altyn Belgi), victories in national and international competitions)).
The above graphs reflect the degree of influence of individual features on the results of the regression model.
Consider the possibility of interpreting the results of assessing the quality features of individual schools.
Figure shows an example of the interpretation of the Q-Edu-2 feature (the proportion of students with special achievements, such as victories in republican and international competitions and the title of Altyn Belgi) for some school X. In this figure, the output value values are 0.01—this is the prediction of the model. It should be noted that for the feature Q-Edu-2, the indicator 0.01 is quite high—it means that 1 percent of students have such special achievements. Most schools, in the data set available, have a Q-Edu-2 feature close to or equal to zero.
The red blocks on the left indicate those factors that influenced the increase in the prediction of the model, and the blue blocks on the right—to decrease. Decoding is given for the most important criteria—the increase was influenced by the number of students participating in additional educational activities (add_edu_stud) and the number of teachers of the highest category (high_category_teachers). The decrease, respectively, was affected by the density of schools within a radius of 3 kilometers (school_density_in_3 km) and the distance to the nearest major city (school_city_dist).
For normalization of features, StandardScaler from the scikit-learn package was used, thus, the values of the features should be interpreted as the distance in normal deviations from the expectation. That is, the indicator for high_category_teachers (1.742) is very high—1.742 standard deviations more than the average for all schools.
Figure 12. The effect of features on the Q-Edu-2 feature of school X.
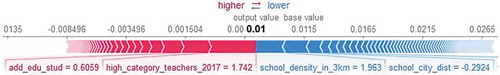
Figure 13. The effect of features on the Q-Edu-4 feature of school Y.
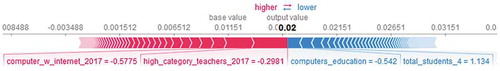
Consider another school Y in Figure . It has a comparable with the previous school feature Q-Edu-4, and we see that the most important feature affecting the increase in this feature is the same—the number of teachers with the highest category. However, it affects significantly less, due to the lower value (−0.298 against 1.742). In other words, although this feature is below average, it remains important. The same can be said about the feature of Internet access—they are somewhat less than the national average (−0.57). At the same time, the limiting factor is the low number of computers in schools used in the educational process (computers_education).
A sufficiently high value of Q-Edu-2 may indicate that this school has a high potential for special achievements among students. At the same time, the analysis of the schedule allows to identify specific limiting factors (computerization) and those factors, the improvement of which may be the most effective (access to the Internet, the share of teachers of the highest category).
Thus, with the help of such visualization, it is possible to both analyze individual schools for various features and make recommendations for improving the situation. It should be noted that the influence of individual features on individual schools can differ greatly from the average effect of the feature across the entire sample, since the SHAP, when interpreting, takes into account the internal non-linear interdependencies between the features. For example, for one school, the proportion of students studying in classes with a language bias may affect the features of the quality of education differently depending on the contingent/region/teaching staff.
7. Conclusion
An important disadvantage of the existing multi-criteria decision support systems is that the basis of their work is very subjective expert assessment. The second drawback is that in cases where there are sufficiently large amounts of data and a significant number of features describing the objects of analysis, the use of classical MCDSSs becomes very difficult due to the significant growth (for some exponential methods) of the amount of work to gain knowledge from experts. It can be argued that the best results will be given by machine learning models. Machine learning models are represented by two large groups of algorithms: unsupervised learning and supervised learning. The former allows clustering, while the latter classify and form regression models. At the same time, the main problem when applying models of supervised learning is the difficulty of interpreting the results of their work. In other words, after receiving the result of the assessment, we often cannot explain how it was obtained. For this reason, models of this kind are considered to be “black boxes”, where the conclusion is formed according to laws unknown to the external observer. The use of such models in decision support systems is difficult. However, significant advances associated with the development of interpreters for complex classifiers, that allow turn the “black” boxes into “gray” boxes. The use of Lime and SHAP interpreters makes it possible to assess the influence of individual features of the model on the overall result of the classification or regression.
As a consequence, we can use the interpreters as the core of MCDSS. To realize this opportunity, a set of four Q-Edu features was developed as part of the MCDSS project on education quality management in secondary schools: Q-Edu-1—Percentage of graduates who received a scholarship for the top specialties at the top universities, Q-Edu-2—Number of elite achievements (gold medal, victories in national and international competitions), Q-Edu-3—the proportion of graduates who earned a passing score in the process of a unified national testing, Q-Edu-4—The percentage of graduates who continued their studies. The main source of data for calculating features was the national educational database (NEDB), which contains information on more than 20 thousand educational institutions of Kazakhstan. Additionally, to calculate the values of Q-Edu-1, lists of higher educational institutions of the national and international rating agencies for 2018 were used, information on passing points for a scholarship in prestigious specialties. Using the obtained features, regression models were trained on more than 200 features of educational institutions to predict target indicators Q-Edu.
The development of recommendations for individual educational institutions, as well as the assessment of the significance of features within the model, was carried out using the SHAP (SHapley Additive exPlanations) algorithm.
The obtained results demonstrate the possibility of using machine learning models in combination with this interpreter as the basis of the MCDSS education quality management system in secondary schools.
In fact, the article proposes an end to end approach to data-driven decision making support. This approach assumes that the entire available set of features and the generated set of targets is used.
The main contributions of the research are:
we proposed a system for assessing the quality of secondary education that uses objective indicators of student performance and higher education institution rankings;
we used a non-linear regression model linking target indicators to a large set of secondary education institution features;
we suggested using interpreters of machine learning models to explain the results of modeling and support decision making.
The main limitation of the method, as in the case of deep learning, is that it requires a large data set. Otherwise, traditional MCDSS methods that is not so critically dependent on the amount of raw data should be applied. Another limitation of the presented MCDSS model is the need to interpret the patterns identified in the modeling process.
In the future research, the number of Q-Edu indicators can be increased in the course of research with specialists in the field of secondary education. In addition, the Q-Edu can be used to form an integrated assessment of an educational institution. The third important task of further research is to assess the yearly dynamics of change in Q-Edu.
Additional information
Funding
Notes on contributors
R. Muhamedyev
R. Muhamedyev (PhD) (shown in the photo) currently holds the positions of professor at Satbayev University (SU) and leading researcher at the Institute of Information and Computational Technologies MES RK (IICT). His research interests include machine learning (ML), natural language processing, decision support systems, scientometrics.
K. Yakunin
K. Yakunin is PhD student of SU and leading programmer-engineer at the IICT. His research interests include ML, data processing, etc.
YA. Kuchin
YA. Kuchin is PhD student of Riga Technical University and programmer-engineer at the IICT.
A. Symagulov
A. Symagulov (M.Sc.) is programmer-engineer at the IICT.
T. Buldybayev
Timur Buldybayev is currently the Director of the Department of Applied Research and Development of the Information Analytical Center. His research interest focuses on social sciences and big data.
S. Murzakhmetov
S. Murzakhmetov (M.Sc.) is a programmer at the IICT.
A. Abdurazakov
A. Abdurazakov is PhD student of SU. His research interest focuses on the use of ML in education.
References
- Abaei, M. M., Arzaghi, E., Abbassi, R., Garaniya, V., & Penesis, I. (2017). Developing a novel risk-based methodology for multi-criteria decision making in marine renewable energy applications. Renewable Energy, 102, 341–19. https://doi.org/10.1016/j.renene.2016.10.054
- Symagulov, A. (2019). Appendix 1 Features of the regression model. https://osf.io/zugdb
- Baykasoglu, A., & Durmusoglu, Z. D. (2014). A hybrid MCDM for private primary school assessment using DEMATEL based on ANP and fuzzy cognitive map. International Journal of Computational Intelligence Systems, 7(4), 615–635. https://doi.org/10.1080/18756891.2014.960220
- Beggrow, E. P., Ha, M., Nehm, R. H., Pearl, D., & Boone, W. J. (2014). Assessing scientific practices using machine-learning methods: How closely do they match clinical interview performance? Journal of Science Education and Technology, 23(1), 160–182. https://doi.org/10.1007/s10956-013-9461-9
- Biran, O., & Cotton, C. (2017, August). Explanation and justification in machine learning: A survey. In IJCAI-17 Workshop on Explainable AI (XAI), 8(1), 8-13.
- Borg, I., Groenen, P. J. F., & Jo., J. E. M. (2003). Modern multidimensional scaling: Theory and applications. Journal of Educational Measurement, 40(3), 277–280. https://doi.org/10.1111/j.1745-3984.2003.tb01108.x
- Brans, J. P., & Vincke, P. (1985). Note—A preference ranking organisation method: (The PROMETHEE method for multiple criteria decision-making). Management Science, 31(6), 647–656. https://doi.org/10.1287/mnsc.31.6.647
- Charabi, Y., & Gastli, A. (2011). PV site suitability analysis using GIS-based spatial fuzzy multi-criteria evaluation. Renewable Energy, 36(9), 2554–2561. https://doi.org/10.1016/j.renene.2010.10.037
- Koehrsen, W. (2018). A Complete Machine Learning Walk-Through in Python: Part Three Interpreting a machine learning model and presenting results. https://towardsdatascience.com/a-complete-machine-learning-walk-through-in-python-part-three-388834e8804b
- Figueira, J., Mousseau, V., & Roy, B. (2005). ELECTRE methods. In Multiple criteria decision analysis: State of the art surveys (pp. 133–153).
- Hansen, P., & Ombler, F. (2008). A new method for scoring additive multi-attribute value models using pairwise rankings of alternatives. Journal of Multi-Criteria Decision Analysis, 15(3–4), 87–107. https://doi.org/10.1002/mcda.428
- UNESCO. (n.d.). The Incheon Declaration and Framework for Action for the Fourth Sustainable Development Goal. https://en.unesco.org/gem-report/sdg-goal–4
- Kabak, M., & Dağdeviren, M. (2014). A hybrid MCDM approach to assess the sustainability of students’ preferences for university selection. Technological and Economic Development of Economy, 20(3), 391–418. https://doi.org/10.3846/20294913.2014.883340
- Köne, A. Ç., & Büke, T. (2007). An analytical network process (ANP) evaluation of alternative fuels for electricity generation in Turkey. Energy Policy, 35(10), 5220–5228. https://doi.org/10.1016/j.enpol.2007.05.014
- Lai, Y. J., Liu, T. Y., & Hwang, C. L. (1994). Topsis for MODM. European Journal of Operational Research, 76(3), 486–500. https://doi.org/10.1016/0377-2217(94)90282-8
- Ribeiro, M. (2019). Lime. Retrieved October 19, 2019, from https://github.com/marcotcr/lime
- Ribeiro, M., Singh, S., Guestrin, C. (2019). Local Interpretable Model-Agnostic Explanations (LIME): An Introduction. https://www.oreilly.com/learning/introduction-to-local-interpretable-model-agnostic-explanations-lime
- Lundberg, S. M., & Lee, S. I. (2017). A unified approach to interpreting model predictions. In Advances in Neural Information Processing Systems, 4765–4774.
- Maaten, L. V. D., & Hinton, G. (2008). Visualizing data using t-SNE. Journal of Machine Learning Research, 9(Nov), 2579–2605.
- Mardani, A., Jusoh, A., Zavadskas, E. K., Cavallaro, F., & Khalifah, Z. (2015). Sustainable and renewable energy: An overview of the application of multiple criteria decision making techniques and approaches. Sustainability, 7(10), 13947–13984. https://doi.org/10.3390/su71013947
- Muhamedyev, R. (2015). Machine learning methods: An overview. Computer Modelling & New Technologies, 19(6), 14–29.
- Mukhamediev, R. I., Mustakayev, R., Yakunin, K., Kiseleva, S., & Gopejenko, V. (2019). Multi-criteria spatial decision making supportsystem for renewable energy development in Kazakhstan. IEEE Access, 7, 122275–122288. https://doi.org/10.1109/ACCESS.2019.2937627
- eGov. (n.d.). National ranking of the best universities of Kazakhstan. https://egov.kz/cms/en/articles/2Fbestuniinkz30
- Ogor, E. N. (2007, September). Student academic performance monitoring and evaluation using data mining techniques Electronics, robotics and automotive mechanics conference (CERMA 2007) (pp. 354–359). IEEE.
- Ola, A., & Pallaniappan, S. (2013). A data mining model for evaluation of instructors’ performance in higher institutions of learning using machine learning algorithms. International Journal of Conceptions on Computing and Information Technology, 1(1).
- Univision. (2019). Passing points for a scholarship for specialties for 2018. (in Russian). Retrieved October 10, 2019, from https://univision.kz/prohodnye-bally-na-grant-2018.html
- Symonds, Q. (2019). QS EECA international rating. Retrieved October 10, 2019, from https://www.topuniversities.com/university-rankings/eeca-rankings/2018
- Ribeiro, M. T., Singh, S., & Guestrin, C. (2016, August). “ Why should i trust you?” Explaining the predictions of any classifier. In Proceedings of the 22nd ACM SIGKDD international conference on knowledge discovery and data mining (pp. 1135–1144).
- Ribiero, M. T., Singh, S., & Guestrin, C. (2016). Local interpretable model-agnostic explanations an introduction. O’Reilly.
- Roweis, S. T., & Saul, L. K. (2000). Nonlinear dimensionality reduction by locally linear embedding. science, 290(5500), 2323–2326. https://doi.org/10.1126/science.290.5500.2323
- Saati, T. L., & Andreychikova, O. N. (2015). Ob izmerenii neosyazayemogo. Podkhod k otnositel’nym izmereniyam na osnove glavnogo sobstvennogo vektora matritsy parnykh sravneniy. Cloud of Science, 2 (1), 5–39. (in Russian).
- Schölkopf, B., Smola, A., & Müller, K. R. (1998). Nonlinear component analysis as a kernel eigenvalue problem. Neural Computation, 10(5), 1299–1319. https://doi.org/10.1162/089976698300017467
- Scikit-learn. (2019). Scikit-learn: machine learning in Python. https://scikit-learn.org
- Scott, J., Ho, W., Dey, P. K., & Talluri, S. (2015). A decision support system for supplier selection and order allocation in stochastic, multi-stakeholder and multi-criteria environments. International Journal of Production Economics, 166, 226–237. https://doi.org/10.1016/j.ijpe.2014.11.008
- Lundberg, S. (2019). Shap. https://github.com/slundberg/shap.
- Singh, S., & Lal, S. P. (2013, December). Educational courseware evaluation using machine learning techniques. In 2013 IEEE conference on e-learning, e-Management and e-Services (pp. 73–78). IEEE.
- Tenenbaum, J. B., De Silva, V., & Langford, J. C. (2000). A global geometric framework for nonlinear dimensionality reduction. science, 290(5500), 2319–2323. https://doi.org/10.1126/science.290.5500.2319
- Symagulov, A. (2019). Top specialties list 2018. https://osf.io/gyv5a
- Hulstaert, L. (2018). Understanding Model Predictions with LIME. https://www.datacamp.com/community/tutorials/understanding-model-predictions-lime
- Yager, R. R. (1988). On ordered weighted averaging aggregation operators in multicriteria decisionmaking. IEEE Transactions on systems Man, and Cybernetics, 18(1), 183–190. https://doi.org/10.1109/21.87068