
 ?Mathematical formulae have been encoded as MathML and are displayed in this HTML version using MathJax in order to improve their display. Uncheck the box to turn MathJax off. This feature requires Javascript. Click on a formula to zoom.
Abstract
The digitalization of industries is at the heart of today’s global economy. However, there seems to be confusion about the most effective methods for initiating this transformation, and even more so for the manufacturing Small and Medium-sized Enterprise (SME). In a context of labor shortages, globalization and access to goods, services and skills everywhere and at any time thanks to the Internet, the need to stand out from the competition becomes a crucial issue. This research attempts to evaluate and identify the most effective ways to facilitate the digitalization in a context of manufacturing SMEs. Thanks to the measure of the digital performance and an 80-hour experience-based methodology using a questionnaire and field interviews, the determining factors of influence of the digital transformation could be raised. This paper uses a model of digital performance and hypothesis testing to try to identify the business practices and the 4.0 technologies that have the greatest effect on the performance of manufacturing SMEs. The results then intents to guide the efforts both in academia and in the field concerning digitalization of SMEs.
PUBLIC INTEREST STATEMENT
The digitalization of industries is at the heart of today’s global economy. However, there seems to be confusion about the most effective methods for initiating this transformation, and even more so for the manufacturing Small and Medium-sized Enterprise (SME). In a context of labor shortages, globalization and an everywhere access to goods, services and skills, the need to stand out becomes a crucial issue. This research attempts to evaluate and identify the most effective ways to facilitate the digitalization of manufacturing SMEs. With the measure of digital performance, the main factors of influence of the digital transformation were raised. This paper uses a model of digital performance and hypothesis testing to identify the business practices and the 4.0 technologies that have the greatest effect on the performance of manufacturing SMEs. The results then intents to guide the efforts both in academia and in the field concerning digitalization of SMEs.
1. Introduction
The digitalization of industries is a growing topic in the media, scientific papers, trade fairs and conferences. Although more and more authors agree on what digitalization means, few put effort into the most effective ways for a company to execute its digital transformation. This observation is even more true with regard to the Small and Medium-sized Manufacturing Enterprises (SMME). With the shortages of labor experienced in western countries in the recent years, the globalization of industries and the e-commerce, the need to be successful and to stand out is more important than ever. Manufacturing SMEs are therefore seeking the most efficient and effective methods and means to improve their organizational performance and stand out from the competition. The concepts of Industry 4.0 and of the digital transformation seem to offer this opportunity to SMEs. The question remains: What are the most effective ways to facilitate the digital switchover in a context of SMEs? In other words, what are the parameters of Industry 4.0 accessible to SMEs, which have the greatest influence on the performance of this type of organization?
Following our previous work, we found that in Quebec, Small and Medium-sized Manufacturing Enterprises (SMME) are slow to begin their digital transformation (Gamache et al., Citation2017). The lack of resources, but also of expertise in the field of digital seem to limit the actions that can take the SMME at the level of the digitalization of their process. In 2011, when the Fraunhofers announced the government’s policy of Industry 4.0, this revolution was intended to become a catalyst for the industry by providing tailored support for large manufacturing companies. In Quebec, more than 95% of the industrial sector is made up of small and medium-sized businesses. As a result, companies often do not have the financial means or sufficient human resources to go through the same steps as large companies to digitalize. Some digital tools, practices and management methods are now available and increasingly accessible to businesses. It is then possible that certain business practices or technological tools accelerate the transition to a digital environment in a context of SMME, notably due to their affordability and ease of integration, but which also have a significant impact on their performance.
Depending on the type of business, industry and product type, the influencing factors that most affect the digital performance may differ, but are there any common and significant factors that can make a difference and provide some guidelines to execute a digitalization? This paper then aims to evaluate the most significant factors of influence of Industry 4.0 for the improvement of the digital performance of SMMEs in Quebec.
2. Literature review
During our previous works, an exploration of the literature was carried out to define the state of knowledge concerning Industry 4.0, the main characteristics of the Quebec SMMEs as well as the main digital tools and business practices that currently exist to facilitate the transition of companies to Industry 4.0 (Gamache & Abdul-Nour, Citation2018). The current review aims to identify the means of a digitalization in order to draw a picture of the business practices and of the digital tools which are most frequently associated with Industry 4.0 and to digital transformation. The results of this approach are then used to evaluate the most relevant business practices and technological tools in an SME context. Based on the organizational performance presented by Zaeid et al. (Citation2015), the concept of digital performance is also studied. This indicator is useful for evaluating the progress of a company towards a “4.0” environment and ultimately for optimal actions and real added value for SMEs.
The search engines SCOPUS, Science Direct, Springer and Google have been used to target different documents such as books, scientific papers, research reports, websites, conferences and videos on Industry 4.0, digitalization, agile manufacturing, economics, automation, management and leadership to cover the subject as a whole. This section will deal first with the digital transformation, then with digital performance, and finally with the process of evaluating the digital transformation.
2.1. Digital transformation
The digital transformation can be defined by the method the digital technologies are integrated into its business practices (Ducrey and Vivier, Citation2017). It represents the method of transition to Industry 4.0 for businesses. By searching for keywords “Digital transformation”, the SCOPUS database provides 591 results. Among these results, some keywords return regularly. Table presents the keywords that emerge from this research.
Table 1. Keywords associated with digital transformation
In Table , it is possible to distinguish two types of elements, namely: (1) technological tools and (2) business practices. The Internet of Things, cloud computing and big data, for example, are tools that help a business achieve a goal. On the other hand, innovation, strategic planning, information management and knowledge management are business practices. A more advanced review of these two types of elements resulting from the digital transformation is presented in Figures and (Abbal, Citation2014; Avasant, Citation2016; Bauer et al., Citation2015; BCG, Citation2015; Blanchet, Citation2016; Bledowski, Citation2015; Caylar et al., Citation2016; CGI, Citation2016; CIGREF, Citation2015; Curry et al., Citation2016; Ducrey et Vivier, Citation2017; Dworschak and Zaiser, Citation2014; Ghobakhloo, Citation2018; Hermann et al., Citation2016; Hess et al., Citation2016; Impuls, Citation2016; Kaggermann et al., Citation2013; Kohli and Grover, Citation2008; Leurent et al., Citation2019; Lueth, Citation2015; McKinsey Digital, Citation2015; Merkofer, Citation2014; Ministère de l'Économie, de la Science et de l'Innovation (MESI), Citation2016; Moeuf, Citation2018; Pellerin et al., Citation2016; Pelletier, Citation2018; Portal, Citation2015; Porter and Heppelmann, Citation2014; Productique Québec, Citation2016; Qin et al., Citation2016; Sangmahachai, Citation2015; Tortorella and Fettermann, Citation2018; Weinman, Citation2015). Figure presents the distribution of technological tools often associated with the digital transformation while Figure presents the business practices, allowing, to a certain extent, the implementation of a digital transformation. The reference documents are presented in the references at the end of the paper.
Figure 1. Tools associated with digital transformation.
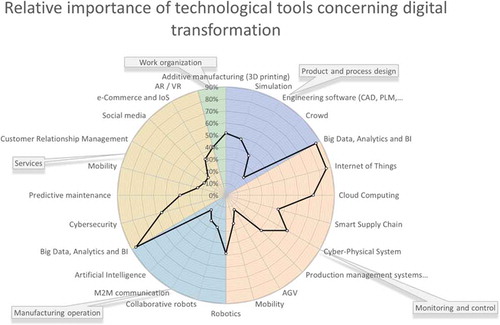
Figure presents two main elements of interest, namely (1) the relative importance given to the various tools of the digital transformation in the literature and (2) the grouping of digital tools proposed by Blanchet (Citation2016).
In this review, it is possible to notice that tools such as Big Data and Analytics, Business Intelligence, Internet of Things, Cloud Computing, additive manufacturing, Cyber-Physical Systems and cybersecurity are in more than 50% of the consulted references. Simulation and engineering software, intelligent supply chain management tools, production management systems, robotics and cobotics, predictive maintenance, e-commerce and virtual and augmented reality are all discussed in at least 25 % of cases. The other tools seem less addressed in the literature but still show some interest in various papers.
Blanchet (Citation2016) proposes a grouping of the tools resulting from the digital transformation according to their place of application. The grouping is as follows:
Product and process design;
Monitoring and control;
Manufacturing operations;
Services;
The organization of work.
The interest of the Blanchet group is mainly based on the need to reduce to the objective when choosing a digital technology. A company that seeks to improve the monitoring and the control of its plant will then opt for digital tools belonging to this group.
As raised by several authors, the acquisition of a technology is not enough to carry out a digital transformation. A transformation involves implementing or modifying one’s way of doing things. We will then talk about business practices. Figure shows the relative importance granted by the authors to business practices related to digital transformation.
Figure 2. Business practices of digital transformation.
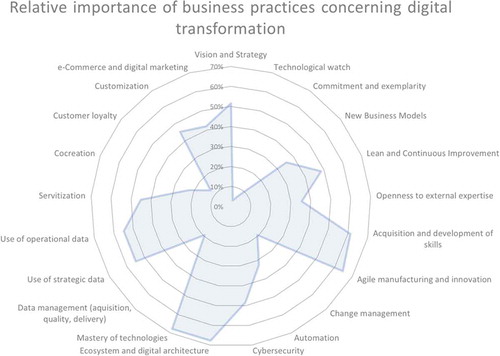
Figure shows that the most important business practices in the digitalization literature are the vision and strategy, the acquisition and development of skills, the agility and the innovation, the ecosystem and digital architecture, the integration and the mastery of digital tools as well as the strategic and operational use of data. These practices are raised in more than 50% of the works consulted. The practices concerning the new business models, the use of lean and continuous improvement, the external collaboration, the cybersecurity, the servitization, the customization and the e-commerce are being covered in at least the third of the consulted papers. Finally, while showing less importance, other business practices that returned in few occurrences are the co-creation and open innovation, the commitment and the exemplarity, the automation, the data management, the change management, the customer’s loyalty and the technological watch activities. All in all, besides the fact that authors cover these technological tools and business practices or not, no study were found that prioritized one from the other. This is in part, what this paper aims to do.
2.2. Digital performance
The notion of digital transformation evokes the transition from one state to another. As a result, it becomes necessary to evaluate the change through the use of a relevant indicator that monitors the impact of the business decisions and guides the actions to improve the indicator.
In this sense, Zaeid et al. (Citation2015) address the topics of organizational performance and managerial innovation to improve one’s business competitiveness. The authors use Jacquet’s definition (Jacquet, Citation2011), which states that the organizational performance is composed of several criteria that vary according to their action potentials and the objective to be achieved. They define managerial innovation as “the use [of a set] of new strategies, managerial practices, procedures and organizational structures […] with the aim of improving the efficiency and effectiveness of organizational processes.” According to the authors, managerial innovation covers business practices, knowledge management, and relationships with external organizations. In particular, they establish a link between organizational performance and managerial innovation by demonstrating that the organizational performance results from a competitive advantage generated by innovation activities. In other words, organizational performance is made up of a combination of criteria such as business practices, strategies, processes, knowledge management methods and the establishment of internal and external relationships for the purpose of achieving a specific goal.
Based on the organizational performance of Zaeid et al. (Citation2015) and the objective of this research, the term “digital performance” has been prioritized and is defined here by the measure to evaluate the progress of the execution of a digital transformation according to the good management practices in a digital environment. The decomposition of the digital performance thus makes it possible to orient more specifically the priorities, the investments and the vectors of value in a company according to the strategic orientation, the stakes, the internal and external context and the available resources, such as humans and technologies.
The HUB Institute (Ducrey & Vivier, Citation2017) has also developed a model in 2017 to help businesses execute their digital transformation. According to the authors, six main dimensions must be addressed in relation to the business strategy. These dimensions are as follows:
Leadership;
Culture and organization;
Technology management;
Data management;
Measurement system (decision-making process);
Customer experience.
The leadership determines the direction of the company, its knowledge of the market and the evolution of the environment. The culture and the organization represent the means implemented to foster innovation, continuous improvement, acceptance of change, acquisition of skills, etc. The technology management addresses the notions of digital maturity, cybersecurity, and the use of digital technologies to achieve business goals. Data management represents the capture, the storage, the processing and the quality of the data used in the business. The measurement system represents how to use the data to facilitate the decision-making process. Finally, the customer experience represents the methods used to personalize and improve the offer and the relations with the customer.
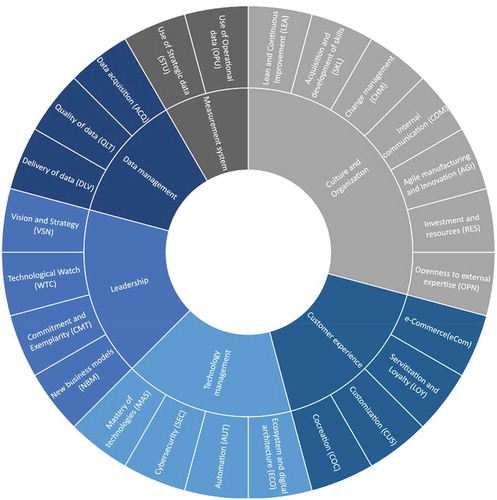
Based on the management practices presented in Figure and the Ducrey and Vivier’s model (Ducrey & Vivier, Citation2017), a digital performance assessment model is proposed in Figure . The elements of this model are briefly defined right after.
Figure 3. Digital performance model.
2.2.1. Leadership
In the digital performance model presented in this research, the leadership is defined by the process a person employs to guide, orient and influence a group of people to achieve a shared vision.
2.2.1.1 Vision and strategy
The vision of a company represents a description of a future and desirable state of the organization and/or its environment.
The digital strategy here represents the improvement of products and processes through the use of digital technologies and the opportunity to develop a brand-new business model. A good digital strategy must incorporate a long-term vision, a business model review and a digital plan to achieve business objectives.
2.2.1.2 Technological watch
The technological watch is the set of techniques aiming at systematically organizing the collection of technological information, the analysis, the dissemination and the exploitation of this information useful for the growth and development of the company. It is the observation and analysis of research relating to the scientific and technical achievements, products, manufacturing processes, materials and present and future economic impacts they cause.
2.2.1.3 New business models
A business model describes the principles according to which an organization creates, delivers and captures value. The new digital technologies can improve one’s offer and relationship with the customer.
2.2.1.4 Commitment and exemplarity
Organizational commitment is defined by the strength with which the individual working in a company identifies with an organization. This commitment is characterized by three elements: (1) a strong belief and a total acceptance of the goals and values of the organization; (2) a proven willingness to exert considerable effort on behalf of the organization.; (3) a strong desire to continue to be part of the organization’s workforce. The exemplarity represents the implementation of the commitment.
2.2.2 Culture and organization
Organizational culture is a specific way a business has to respond to problems. It characterizes the company and distinguishes it from others in its values, its approach to problems and how to react to current situations.
2.2.2.1 Change management
Change management refers to the whole approach that goes from the perception of an organizational problem to the definition of a framework of actions that allows the elaboration, the choice and the implementation of a solution under optimal conditions of success.
2.2.2.2 Agile manufacturing and innovation
Agile manufacturing is an organization’s ability to create value and delight its client, while promoting and adapting—in time—to changes in its environment.
Innovation represents the implementation of a product, whether it is a good or a service, a new or significantly improved process, a new method of marketing or a new organizational method in the practices of the organization.
2.2.2.3 Investment and available resources
The investment in digital technologies includes the process of determining a budget, identification of problems and possible solutions, the choice of technological solutions, the implementation, the monitoring and the risk management.
2.2.2.4 Acquisition and development of skills
Talent management is the set of practices related to the acquisition, the development and the promotion of an organization’s talents such as: selection and recruitment; performance management; training and development; succession management; career management; and compensation, in order to foster the retention of an organization’s talents.
2.2.2.5 External openness and collaboration
Collaborative work refers to cooperation between several actors or organizations to achieve a common goal. Cooperating is primarily the sharing of values, projects, knowledge, resources and tools. It is also based on the willingness and the ability to cooperate.
2.2.2.6 Lean and continuous improvement
Lean is a management method that aims to improve the performance of the company through the development of all employees. The method makes it possible to search for the ideal operating conditions by making personal work, equipment and sites work together in order to add value with the least waste possible.
2.2.2.7 Internal communication
Internal communication is a set of principles, actions and practices designed to foster ownership, cohesion, to encourage everyone in better communicating and to promote joint work.
2.2.3 Measurement system
The measurement system here represents the repeated action of using technology data and resources to assess an organization’s performance.
2.2.3.1 Operational use of data
Operational data use is the ability to use data well in day-to-day business decisions.
2.2.3.2 Strategic use of data
Strategic use of data represents the ability to use data well in management and long-term decisions.
2.2.4 Technology management
Technology management represents the collection of techniques, skills, methods and processes used in the production of goods or services or in the accomplishment of objectives. It mainly refers to the tools presented in Figure , but also to the techniques used to connect these tools, to integrate them, to master them and to generate value.
2.2.4.1 Ecosystem and architecture
Digital ecosystems are composed of multiple independent entities such as machines, software and applications. Together, these elements create an interdependent system that shares and communicates information to achieve one or more common missions.
2.2.4.2 Mastery of technologies
The mastery of technologies includes the integration, the connection, the knowledge and the control of the equipment in order to ease the sharing of data between equipment, machines, systems, and independent players of the value chain and to insure the optimal use of the technologies.
2.2.4.3 Cybersecurity
IT security occurs at many levels. Security can affect both internal storage and cloud services as well as inter and intra enterprise communications. Cyber security includes the development, the planning and the implementation of security procedures to prevent breaches, information leaks and piracy risks.
2.2.4.4 Intelligence, autonomy and automation
An autonomous process means that a piece of equipment can be guided by sensors and actuators autonomously during production, in real time, and according to the conditions of the moment. Decision making is done using algorithms that evaluate performance and state of production measurements, causing the pieces of equipment to take action to meet the objectives set by the algorithms.
2.2.5 Data management
Data management is operated in a business by acquiring, controlling, protecting, delivering and improving the quality of the data and information assets of the company. The latter can be broken down into three elements, namely: collection, integrity (and quality) and delivery of the data.
2.2.5.1 Collection of data
Data acquisition means the analysis, the design, the implementation, the deployment and the maintenance of the data systems as well as the mechanisms for capturing and transferring data in an operating system.
2.2.5.2 Integrity and quality of data
Data quality means that the data provided to employees allows analysis and decision-making based on valid information. Data integrity is represented by all activities that maintain the context, the consistency, the standardization and the sharing of accurate, up-to-date and relevant information.
2.2.5.3 Data delivery
Data delivery is represented by the state of the data at the time of use. The data provided to employees must be directly usable without additional manipulation.
2.2.6 Customer experience
Customer experience represents the efforts to provide more than one product to the customer, in terms of design, associated service, and communication throughout the product lifecycle.
2.2.6.1 Customization
The use of data and information technology enables the development of new business models and creates new value for the customer. The active participation of customers in the product development process also meets their specific needs and requirements. Customization means offering the customer an individual approach that meets specific needs.
2.2.6.2 Engagement and loyalty
Engagement marketing is a process of involving the consumer in the process of creating a new product or service. Two possibilities are open to the company in this process:
The consumer is directly consulted to participate in the creation of this new product.
The consumer freely makes positive or negative comments about an information platform about the brand or product. This information is then retrieved by the company, which takes it into account when creating a new product.
2.2.6.3 Cocreation and open innovation
Co-creation and open innovation represent the use of partners or crowds via, for example, crowdsourcing and open innovation to develop new products and processes that meet the real expectations of customers.
2.2.6.4 E-Commerce and SMAC
the e-Commerce is mainly online sales. The SMAC represents the use of platforms and social media that allow to keep direct contact with its customers, improve their retention and improve the products and services offered.
The digital performance concept proposed in this research represents the indicator that combines the 24 business practices from the literature and grouped according to the model of the HUB Institute.
2.3. Digital performance assessment approach
The authors have shown that a digital transformation involves both business practices and the acquisition of digital tools. However, management practices and digital needs are not identical within the departments of the same organization. Porter’s work (Porter, Citation2008) details all of the business processes that are found in a business. The evaluation of the digital performance must then be done by considering the different realities lived in a company to ensure a thorough and complete analysis of the needs of the company. The business processes identified by Porter are presented in Figure .
Figure 4. The typical business processes of a company according to Porter.
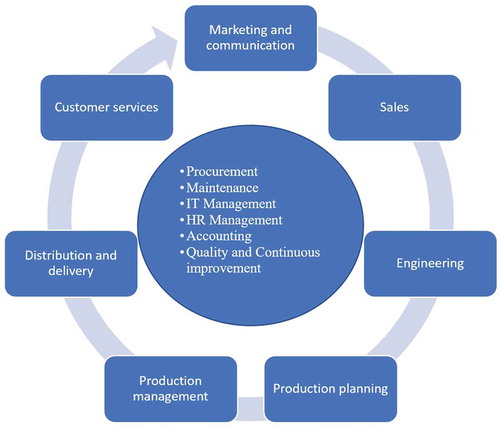
The presence of the various departments in a company, the intrinsic difference that distinguishes them and the opportunities to develop a competitive advantage in each of them shows that it is relevant to consider them when evaluating the digital performance. In this paper, the approach used to measure digital performance then takes into account the various business processes of the organization. This makes it possible to assess the differences in terms of digital needs, business practices and specific issues, and avoid undermining the evaluation of 24 business practices in different realities.
The literature review demonstrated that the digital transformation of businesses involves both the application of good management practices and the acquisition of the right digital tools. The digital performance, based on the organizational performance, is therefore defined by the implementation of the good business practices to improve its performance both at the organizational and operational levels. The digital performance is composed of 6 dimensions: leadership, culture and organization, technology, data management, measurement system and customer experience. Each of these dimensions is itself broken down into a multitude of criteria (business practices), all raised by literature around the theme of digital transformation. Finally, in order to ensure a comprehensive understanding of a company that wants to go digital, Porter’s work helped to break down the digital performance according to the different realities that can be experienced in companies. The next step in the current research is therefore to test the model in the field to determine the most relevant and significant components of the digital performance for small and medium-sized manufacturing companies.
3. Methodology
The literature review was conducted along with a project with the Quebec’s government in order to introduce Industry 4.0 in Quebec SMEs. Around the table were experts from 5 organizations specialized in digitalization of the industries (UQTR, Productique Québec, CRIQ, STIQ and CEFRIO). A first model of digital performance and a questionnaire were developed and validated in 15 companies. With the comments of these 15 companies, the model and the questions were adapted to better answer to the specific needs of the SMEs. A second model was then proposed and validated in 21 different enterprises. Having reached a sufficient level of satisfaction from the companies, the Quebec’s government adopted the model and now uses it all across the province as a way to help SMEs go to Industry 4.0.
For this paper, a total of 14 companies were interviewed to evaluate their digital performance. These companies were part of the 21 of the second validation. The final model is the one presented in the literature review. The experiments were performed in two stages:
Questionnaires with 109 pre-set questions, organized by business process, and the 24 digital performance business practices, were sent to businesses via an Online Survey link. Questions were answered on a Likert scale graduated from 0 to 4, depending on the respondent’s acceptance of a statement. Up to 14 respondents per company were solicited to cover the 14 business processes studied. In the case where a respondent covered more than one business process, the latter responded to the number of questionnaires associated with his or her duties.
Subsequently, three days of interviews with semi-structured questions provided nuances to the questionnaire responses and helped to put into context the answers provided. The SIPOC approach (Supplier—Input—Process—Output—Customer) was used to guide the interviews. This approach highlights the interrelationships between business processes, determining the tasks, the issues, the individual and common objectives and the specific needs.
This research attempts to evaluate three hypotheses:
Hypothesis 1: Business practices of digital performance have an impact on the digital performance of Quebec SMMEs.
Hypothesis 2: The business process has an impact on the digital performance of Quebec SMMEs.
Hypothesis 3: The choice of digital tools has an impact on the digital performance of Quebec SMMEs.
Technological tools, business practices and business processes in companies are all parameters that can influence the digital performance of an organization. It is therefore interesting to evaluate the relative impact of each of these elements, but also to evaluate which one or these of them have the most positive impact on the performance of Quebec PMEMs.
In addition to the PowerBI software for data analysis, the Minitab software was used for statistical analysis. Hypothesis tests on two means evaluated the relative impact of business practices, processes and tools on the digital performance of the companies in the sample. It is important to mention, however, that the questionnaires sent to the companies and the interviews did not cover the list of the digital tools used in businesses. As a result, the statistical study was based on the recurrence of the tools proposed in the digital plans and their relationship with the business practices and the business processes.
3.1. Execution of the experiments
The evaluation of the digital performance of each company took about 80 hours and consisted of 5 steps: Project launch, self-diagnosis, face-to-face interviews, planning and coaching.
3.1.1. Launching
The launch of the project corresponds to the step of making contact with the company. This step includes a period of information and examples that help the company understand the scope and limitations of the project. The launching stage lasts about half a day and allows to present the concept of Industry 4.0, the overall approach of the project, but also the digital transformation of the company. The diagnostic process is explained, and an example of self-diagnosis is carried out with the main project respondents. Finally, the half-day includes a factory visit that allows the evaluator to understand the reality of the plant of the company.
3.1.2. Self-diagnosis
Questionnaires of 20 to 50 questions are sent to the various respondents of the companies. In total, 109 different questions are asked. Several questions are asked to different respondents in order to highlight interdepartmental differences at the sight of the same statement. It takes about 30 minutes per business process to respond to the self-diagnosis.
The questions of self-diagnosis are answered on an online questionnaire and the data are compiled in a web database. This step ensures that the company takes ownership of the questions and starts thinking about the concepts of digital performance, but also allows the evaluator to have a representative idea of the company in relation to digital before the days of interviews.
3.1.3. Interviews
Upon receiving the results of the self-diagnosis, face-to-face interviews with the various managers of the company are conducted. Interviews can be done individually or in teams, depending on the degree of involvement of the respondents in the business processes studied. This stage lasts approximately 3 days and is attended by 2 evaluators. The pair was preferred to provide a more complete overview of the business through the combination of expertise, and also to evaluate different business processes in parallel if needed. The digital performance indicators are questioned during this day, ensuring the validity of the information provided in the self-diagnosis. The interviews are conducted with the SIPOC methodology to cover the interrelationships between business processes and allow open discussion to bring out nuances related to the self-diagnosis questionnaire.
3.1.4. Recommendations and planning
A period of approximately 7 days is required following the interviews to analyze the data and write the presentation report. The results of the self-diagnosis and interviews allow to objectively measure the dimensions of the digital performance and to detect the strengths and opportunities for improving the company. Linking strengths and potential improvements with business issues and business objectives lead to a list of recommendations. These recommendations are presented during the closing half-day of the process.
3.1.5. Accompaniment
The purpose of the intervention is to get the company to take action. This is why the closing day of the project presents the resources to contact to acquire more information on the solutions to be implemented, on the available financing and on the possibilities of accompaniment during the implementation projects.
3.2. Questions development
The questions concerning each component of the digital performance have been developed from the literature. Each individual component was subjected to a literature review to determine how the authors usually evaluate this component.
Based on the Likert scale, the questionnaire contains questions evaluated on a scale of 0 to 4. The value of 1 means that a worker works for this activity in a traditional way. For example, this process can be handled completely manually or supported by Excel-type tools. The value of 4 is the maximum achievable and means that a respondent functions for the activity in an integrated, connected and real-time manner, ie uses up-to-date and real-time data to make effective decisions. The values of 2 and 3 respectively represent the use of several non-integrated tools and the use of an integrated, but not automated, management software package. The value of 0 means the absence of the business practice. Figure shows a scale adapted from Pellerin et al. (Citation2016) for measuring the digital performance.
Figure 5. Scale adapted from CEFRIO (2016).
For each question developed, the value from 0 to 4 allows the evaluator to give an objective and quantitative assessment for each evaluation element. The calculation was based on the maturity model developed by Jobin and Lagacé (Citation2014) and go as follows:
Where,
Where,
LDS = Score for Leadership Dimension
CLT = Score for Culture and Organization dimension
TEC = Score for Technology dimension
DTA = Score for Data Management dimension
MSR = Score for Measurement System dimension
EXP = Score for Customer Experience dimension
VSN = Score for business practice Vision and Strategy
WTC = Score for business practice Technological Watch
NBM = Score for business practice New Business Models
ENG = Score for business practice Commitment and Exemplarity
CHM = Score for business practice Change Management
AGI = Score for business practice Agile manufacturing and Innovation
RES = Score for business practice Investment and Available Resources
SKL = Score for business practice Acquisition and Skills Development
OPN = Score for business practice External openness and Collaboration
LEAN = Score for business practice Lean and Continuous Improvement
COMM = Score for business practice Internal communication
ECO = Score for business practice Ecosystem and Architecture
MAST = Score for business practice Mastery of technologies
SECU = Score for business practice Cybersecurity
AUTO = Score for business practice Intelligence, autonomy and automation
COL = Score for business practice Data collection
QLT = Score for business practice Integrity and Quality of Data
DLV = Score for business practice Data Delivery
OpDT = Score for business practice Strategic Use of Data
StDT = Score for business practice Operational Data Usage
CUS = Score for business practice Customization
FID = Score for business practice Engagement and Loyalty
COCR = Score for business practice Cocreation and Open Innovation
eCOM = Score for e-Commerce and SMAC business practice
The overall average provides a general view to compare its digital performance over time and across firms. The more specific indicators guide the sources of potential improvement specific to each dimension. They facilitate the development of an improvement action plan and the direction of efforts. It is likely that a firm has greater control over certain dimensions. This method of evaluation then makes it possible to measure the level of digital performance and avoid concentrating the efforts where the gains have only little impact for the organization as a whole.
4. Experiments and results
4.1. Sample description
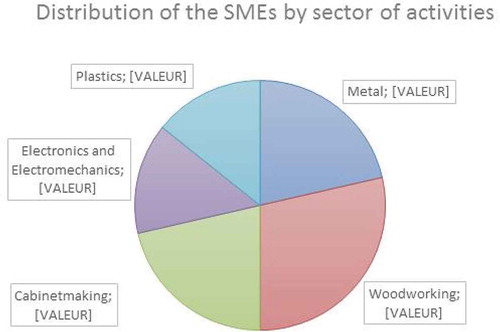
The digital performance evaluation process began in Quebec in early 2017 when the Ministry of Economy and Innovation (MEI) gave to different organizations the mandate of implementing a tool for measuring the digital performance. Since its deployment, the participating manufacturing companies have been receiving a grant from the government to cover the costs incurred by the process. However, to participate in such a project, companies must first demonstrate that they have made a strategic planning and have a certain level of organizational maturity. The 14 companies participating in this project operate in various sectors such as plastics, metal, electronics and electromechanics, woodworking as well as manufacturing of cabinets and components of wood. Figure shows the distribution of enterprises by sector of activity.
Figure 6. Enterprises presented by sector of activity.
4.2. Results
Table shows the results for each dimension for the 14 companies.
Table 2. Results per dimension
4.2.1. General analysis
From the results presented in Table , it is possible to see that the average of the digital performance of the 14 companies is 2.18, while the median is 2.15, the standard deviation is 0.37 and the coefficient of variation of 17%.
Based on the performance scale shown in Figure , an average of 2.18 for business digital performance means that the sample has a disciplined, but poorly integrated and not real-time digital performance level. This explains, for instance, the presence of multiple Excel files and other software used in parallel with the ERP system, if such a type of software is used. Out of 14 companies, 6 received above average scores, while 8 were below, demonstrating a slightly higher impact of companies with higher digital scores.
A normality test showed that the data follow a normal distribution. In addition, 11 out of 14 companies received a digital performance value within a standard deviation around the average and only one company had a digital performance greater than two standard deviations. The coefficient of variation of 17% shows in this sense a certain homogeneity in the data. This homogeneity, all the more discernible at the level of Leadership, can be explained in particular by the criteria for selecting companies for the digital performance evaluation process, since the SMEs participating must have put in motion a strategic planning and concrete actions in continuous improvement.
If two groups are formed based on their position around the average, either above or below, it is possible to compare the most digitalized companies to those with a lower score in digital performance. Table presents the results of this analysis.
Table 3. Average and impact of the dimensions depending on the mean
As can be seen from Table , there is a significant difference in the digital performance values between the two groups at 95% confidence level. Culture and organization, the use of technologies, data management are the dimensions with a significant impact to 95% on the digital performance. The measurement system has not been shown to be significant but tends to increase the overall digital performance score. Leadership and customer experience have not been shown to have a significant impact on the digital performance of companies.
Since the companies participating in the study have made the demand for digital performance analysis themselves and had to carry out a strategic planning, there is a certain level of basic leadership already in place in the companies evaluated. This finding may then partially explain why there is no significant impact from leadership. In terms of customer experience, digital performance does not seem to affect this dimension, especially since the digital tools used in companies differ from one strategy to another. Indeed, many B2 C-based companies often prioritize web marketing tools over production, while those operating in B2B use more production automation tools and neglect web marketing. Businesses in B2B are often more automated and more digitalized, but this distinction was not raised in the questionnaires and so there may be companies with both strategies in the two groups studied here.
In Table , it can be seen that the dimension with the highest average score is culture and organization, while those with the lowest scores are customer experience and data management. Scores associated with culture and organization demonstrate the family culture and the low hierarchy often found in small and medium-sized enterprises. However, the results of Tables and show that, although culture and organization is the highest dimension in almost all the companies in the sample, a structured and participatory culture of improvement and innovation seems to improve significantly the digital performance of the companies.
The customer experience was not shown significant between the two groups of companies, especially since the score is low for almost all the companies in the sample, regardless of the digital performance value. This leads to the observation that the companies studied do not give as much importance to the customer experience as to the other dimensions in terms of their digital transformation. Data management is the second lowest on average with a score of 2.05. The significant distinction between the two groups shows that proper data management has an impact on the digital performance of the companies. However, being on average one of the weakest dimensions among the companies in the sample, there is average management at the level of acquisition, processing, dissemination and quality of the data, a lack of integration between systems and the lack of real time. Only one company in the sample had a score above 3 (SME13). The latter did have quality and up-to-date data, but lacked integration for some processes and did not know how to analyze the data to make better decisions. The score associated with measurement system for this company was also lower than that of data management.
Leadership, technology management and the measurement system all have average scores around 2.15. These dimensions then show a disciplined level with a beginning of integration between the processes. Most companies had an ERP system, but the majority also used parallel systems to address ERP deficiencies or lack of training. A score around 2.15 shows a management instinct with a beginning of structure, but without being fully integrated.
The following analysis focuses more on research hypotheses, that is, determining the influence parameters of digital performance in terms of business practices, business processes, and digital tools.
4.2.2. Validation of the hypotheses
4.2.2.1. Analysis by business practices
Table presents the results of the 24 business practices for the 14 companies. However, for analytical reasons, the results in the calculations have been grouped into 2 levels, depending on whether the business practice score is strictly below 2.5 or above or equal to this value.
Table 4. Results by business practice
First, it is possible to see in Table that technological watch, agile manufacturing and innovation, investment and available resources, external openness, internal communication, cybersecurity and data acquisition are the business practices with the highest average scores among the 14 companies. In contrast, vision and strategy, ecosystem and architecture, automation, data delivery and quality, customization, retention and e-commerce are the business practices with average scores the lowest. Compared with the analysis made earlier, four of the strongest business practices are in the Culture and Organization dimension, while three of the weakest are in the Data management dimension and two others in the Customer Experience dimension, explaining then the relative strengths and weaknesses of the main dimensions.
This Table shows that, on average, the companies in the sample keep abreast of the latest digital trends through technology watch activities, implement innovation and agile processes, invest in digitalization, use external assistance, implement internal communication tools, collect data and are well aware of the issue of cybersecurity. On the other hand, they lack a clear vision at the digital level, do not integrate their systems in a clear architecture, are not very automated, do not exploit the opportunities of the customer experience and must continually manipulate the data to make them good quality and analyze them.
One-dimensional hypothesis tests performed with Minitab have highlighted the results presented in Table . This shows the relative impact of each dimension and business practice on the digital performance. It is possible to see the average values for each level, the number of companies per level for each dimension and business practice as well as the p-value that allows to see if the factor has a significant impact or not. The tests were made with a 95% confidence level.
Table 5. Hypothesis testing on the dimensions and the business practices
Looking at the values of p-value from Table , leadership, culture and organization, technology management, customer experience and measurement system have significant impacts on the digital performance of companies. In terms of business practices, commitment and exemplarity, change management, agile manufacturing and innovation, acquisition and development of skills, use of Lean and continuous improvement, internal communication, the development of an ecosystem and digital architecture, the integration, connection and mastery of digital tools, automation, cybersecurity, data quality, customization capacity and the operational and strategic use of data all have a significant positive impact on the digital performance of the companies. Simply put, Table shows the relative impact from the exploitation of each dimension and business practice by a firm. For example, the development of a sophisticated digital strategy, high levels of digital investment, or participation in all digital showrooms will not have a significant impact on a company’s digital performance. On the contrary, a highly committed management, the use of quality data and good change management will have a significant impact on the digital performance of a company.
Table also shows the difference between the two levels of the hypothesis tests. By assessing the absolute values of the differences in significant business practices, it can be seen that commitment and exemplarity, acquisition and development of skills, digital architecture, automation, data quality and e-commerce offer the greatest potential for increasing the score of digital performance.
Finally, this section validates Hypothesis 1 in the research methodology that states that some of the model’s business practices affect the digital performance. This section also outlines the business practices that have the greatest impact on companies’ digital performance, and thereby facilitate their digital transformation.
4.2.2.2. Analysis by business process
Table shows the results of the digital performance separated by the 14 processes for the 14 companies.
Table 6. Results by business process
It can be seen in Table that on average, the strongest processes among the 14 companies are management, sales, accounting, and quality and continuous improvement. On the other hand, processes with the lowest digital performance scores are production management, customer services and procurement. The average scores of the 14 processes are nevertheless all between the value of 2.00 and 2.50, showing that, on average, each process operates in a disciplined, more or less integrated way and without the use of real-time data. However, while process averages are relatively stable, company-specific results range from 1.10 to 3.70, demonstrating strong variance between processes.
Table presents the results of the hypothesis tests for the 14 processes. The values used for the calculations come from Table . These values have nevertheless been grouped into two levels, ie level 0 when the value in a cell is less than 2.5 and level 1 if the value is greater than or equal to 2 5.
Table 7. Hypothesis testing on the processes
Table shows that management, marketing and communication, production planning, production management, distribution, customer services, IT management and accounting have a significant positive impact on digital performance at a confidence level of 95%. Sales, engineering and procurement, on the other hand, do not have a significant impact, but tend to improve the digital performance of the companies in the sample. Only maintenance, HR management and quality and continuous improvement did not show any impact on the digital performance value of the companies in the sample. It is also possible to see in Table that customer service, marketing and communication, distribution, production planning, IT management and management are the processes that, when raised above 2.5 digital performance, offer the greatest potential for increasing digital performance.
Finally, this section validates Hypothesis 2 in the research methodology that states that certain business processes in companies affect the digital performance. This section includes the processes that most influence the digital performance of companies, but also those that are most and least regularly digitalized in companies.
4.2.2.3. Analysis by technological tools in the digital plan
As mentioned in the methodology, no list of digital tools in place in companies was made during the digital performance assessments, especially since few tools of the 4.0 were used as such. Companies were counting on the approach proposed in this research to guide their future investments. Figure , however, shows the frequency of digital tools proposed in the digital plans presented to companies.
Figure 7. Recurrence of tools in the digital plans.
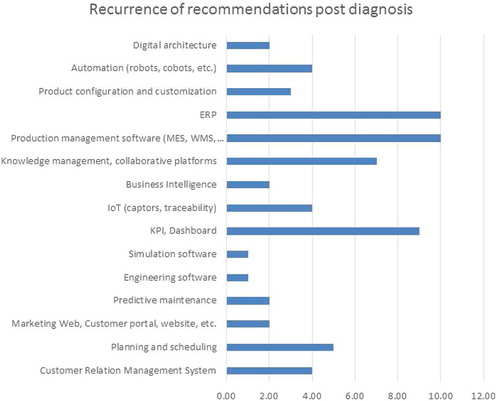
Several statistical tests have been made to try to establish relationships between the tools proposed in the digital plans and the value of the digital performance of the companies concerned. The only conclusion that came out significant at 95% of these tests is that companies with an ERP system generally have a higher digital performance of about 23% compared to the other companies. Indeed, companies that already own and control integrated management systems generally seek to go further at the level of digitalization and are therefore, more often more digitally performant. On the other hand, companies looking to digitalize, but who do not master ERP systems are often not integrated both in their departments and tools in place. Recommendations around ERP systems and dashboards were common. In addition, Figure 7 shows that the implementation or the review of the ERP system, the implementation of a production management system, the implementation of significant performance indicators and dashboards in real time and the acquisition of a knowledge management system and internal collaboration are recommendations that come at least in half of the cases. Recommendations related to automation, the Internet of Things, production planning and customer relationship management are proposed in almost 30% of cases.
In addition, in order to draw a parallel with the business practices and processes that negatively affect the digital performance of the companies studied, it is possible to establish the link between the use of the tools proposed in the digital plans and the impact targeted by the tool. Table shows in this sense the relationship between digital tools and business practices and processes that have been raised during the study.
Table 8. Relationship between the technological tools and the business practices and processes
As Table shows, digital tools attempt to respond to business practices of digital performance or processes that are problematic in companies. Although the direct impact of the tool is not measured, the frequency of recommendation of tools in the digital plans and their relationship to the business practices and the deficient processes in the companies shows that these tools offer high potential for improvement of the digital performance in the companies.
Finally, this section does not validate hypothesis 3 in the research methodology which states that certain tools significantly affect the digital performance of companies. The recurrence of the needs of businesses related to digital tools, however, does not hastily reject hypothesis 3. The companies in the sample seem to converge in terms of the needs they experience in everyday life and which limit them in relation to their passage to digital. This section has highlighted the tools most often raised in companies to enable them to achieve their business objectives and overcome their strategic and operational challenges.
5. Conclusion
In conclusion, it has been possible through this research to evaluate and determine the most significant factors of influence that facilitate the digital transformation in Quebec’s manufacturing SMEs. After discussing on digital transformation, digital performance and digital transformation assessment process, it was possible to state three hypotheses according to which the business practices, the business processes and the digital tools used each have a significant impact on the digital performance of the companies, and therefore, on their digital transformation. A methodology based on questionnaires, a 3-day interview per company and hypothesis testing made it possible to show that the SMMEs in the sample are disciplined companies, and initiating the integration of their systems and departments, but lacking information in real time.
Similarly, in France, Moeuf et al. (Citation2018) showed comparable results where SMEs did not yet implement many of the 4.0 technologies, even more so when they demanded a complete transformation of their businesses. Most of the technologies implemented were the ones related with monitoring of production processes and with the improvement of flexibility. Cloud computing, IoT and RFID technologies were also observed, mainly due to their accessibility and low cost. For the companies that did own 4.0 technologies, the authors noted the lack of mastery, skills and integration that would enable the companies to fully exploit the advantages of the technologies.
In this paper, we found that management commitment and exemplarity, skills’ acquisition and development, digital architecture, task and process automation, data quality and e-commerce are the business practices that seem offer the greatest potential for increasing the digital performance. Concerning the business processes, management, IT management, production planning, customer services, marketing and distribution appear to be the processes with the greatest impact on the digital performance of companies. Finally, a good use of an ERP system, the implementation of a MES, the implementation of significant performance indicators and dashboards in real time and the acquisition of a knowledge management system are the digital tools that are most frequently raised as needed in the companies of the sample. In other words, SMMEs are seeking for information in real time before any need for automation, just as showed by Moeuf et al. (Citation2018).
The main limitations raised in this research are the size of the sample studied and the lack of measurement of the real impact of the technological tools on the companies’ digital performance. A more comprehensive assessment of the tools in the SMEs would allow to target those that offer the most benefits. Nevertheless, the results that emerge from this research have made it possible to guide the choice of technologies required for the SMMEs in view of executing a digital transformation. A longitudinal study with the sample would also be interesting to validate the impact of the approach, the number of projects and the progress of the projects that have been put in place and the gains made by the digital tools implemented.
It is however interesting to note that, after a few months following the interviews, many of the companies have implemented some digital transformation projects. The quantitative results were not yet measured but will most certainly be another step in the progression of this research. Still, the Quebec’s government adopted the methodology and now uses it all across the province to help companies digitalize, which demonstrates the robustness of the approach proposed in this paper.
All in all, the current research project offers interesting considerations on the digital transformation of Quebec manufacturing SMEs and it will be interesting to dig deeper in this direction.
Additional information
Funding
Notes on contributors
Sébastien Gamache
The authors have been working in Quebec SMEs for years now. They have met and worked with more than 250 different enterprises, all of which tended to improve their efficiency and flexibility. In the last 4 years, They worked with the Government and many other actors in the field of Industry 4.0 to help SMEs evolve in a 4.0 environment. This research paper is the beginning of many improvement projects. With the support of the Government, the authors first aimed at measuring the progress of manufacturing SMEs in digital transformation. That brought to insights on the real issues in SMEs concerning digital transformation as well as the actions that offer the most potential. The goal now focuses on putting in place the business practices and the adequate technologies to reach a higher level of performance. This will then help SMEs to better respond to the requirements of mass customization.
References
- Abbal, F. (2014). Industrie 4.0 Les leviers de la transformation. Gimélec. http://www.gospi.fr/IMG/pdf/industrie_4.0_les_leviers_de_la_transformation2014-gimelec-min.pdf
- Avasant. (2016). Digital enterprise transformation: rebooting business services for the new global economy. CreateSpace Independent Publishing Platform.
- Bauer, H., Baur, C., Camplone, G. et al. (2015). Industry 4.0 how to navigate digitization of the manufacturing sector, 1, 36. McKinsey Archive. https://www.mckinsey.com/~/media/mckinsey/business%20functions/mckinsey%20digital/our%20insights/getting%20the%20most%20out%20of%20industry%204%200/mckinsey_industry_40_2016.ashx
- BCG The Boston Consulting Group. (2015). Industry 4.0. the future of productivity and growth in manufacturing industries. Avril 2015. [En ligne]. consulté le juin 4, 2018. Boston Consulting Group. https://www.zvw.de/media.media.72e472fb-1698-4a15-8858-344351c8902f.original.pdf
- Blanchet, M. (2016). Industrie 4.0, Nouvelle donne industrielle, nouveau modèle économique (Lignes de repères). ISBN 978-2-36609-043-7. Lignes de repères.
- Bledowski, K. (2015). The internet of things: Industrie 4.0 vs. the industrial internet. MAPI Foundation. https://mapifoundation.org/economic/2015/7/23/the-internet-of-things-industrie-40-vs-the-industrial-internet
- Caylar, P. L., Noterdaeme, O., Naik, K., & Company, M. (2016). Digital in industry: From buzzword to value creation, 1(9). https://www.mckinsey.com/business-functions/mckinsey-digital/our-insights/digital-in-industry-from-buzzword-to-value-creation
- CGI. (2016). Industrie 4.0. Pour une entreprise hautement concurrentielle. [En ligne]. consulté le juin 4, 2018. CGI. https://www.cgi.com/sites/default/files/white-papers/manufacturing_industry-4_white-paper-fr.pdf
- CIGREF. (2015, Octobre). L’agilité dans l’entreprise. Modèle de maturité. [En ligne]. consulté le juin 4, 2018. CIGREF. http://www.cigref.fr/wp/wp-content/uploads/2015/11/CIGREF-2015-Agilite-dans-l-entreprise-Modele-de-Maturite.pdf
- Curry, E., Cavanillas, J. M., & Wahlster, W. (2016). New horizons for a data-driven economy: A roadmap for usage and exploitation of big data in Europe. Springer.
- Merkofer, P., (2014). (Industry 4.0 challenges and solutions for the digital transformation and use of exponential technologies).
- Ducrey, V., & Vivier, E. (2017). Le guide de la transformation digitale. Eyrolles, Hub Management.
- Dworschak, B., & Zaiser, H. (2014). Competences for cyber-physical systems in manufacturing – First findings and scenarios (Vol. 25).
- Gamache, S., & Abdul-Nour, G. (2018). (Étude du potentiel de l’Industrie 4.0 quant à la transformation de la PME manufacturière québécoise: Une analyse littéraire et expérimentale). ISTE OpenScience.
- Gamache, S., Abdul-Nour, G., & Baril, C. (2017, October 11-13). Toward Industry 4.0: Studies and practices in Quebec SMEs. CIE47 proceedings, Lisbon/Portugal.
- Ghobakhloo, M. (2018). The future of manufacturing industry: A strategic roadmap toward Industry 4.0. Journal of Manufacturing Technology Management, 29(6), 910–31. https://doi.org/10.1108/JMTM-02-2018-0057
- Hermann, M., Pentek, T., & Otto, B. (2016). Design principles for Industrie 4.0 scenarios (Vol. 2016). IEEE Computer Society.
- Hess, T., Matt, C., Benlian, A., & Wiesbock, F. (2016). Digital transformation is a high-priority management challenge1. MIS Quarterly Executive, 15(2), 123-140. https://www.coursehero.com/file/30953975/Options-for-Formulating-a-Digital-Transformation-Strategypdf/
- Impuls. (2016). Industry 4.0 readiness. [En ligne]. consulté le mars 11, 2017. IMPULS. https://www.industrie40-readiness.de/?lang=en
- Jacquet, S. (2011). Management de la performance: Des concepts aux outils. GREG. http://www.creg.ac-versailles.fr/des-concepts-aux-outils
- Jobin, M.-H., & Lagacé, D. (2014). La démarche lean en santé et services sociaux au Québec: Comment mesurer la maturité?. Dans Gestion, 39(3), 116. Automne. doi: 10.3917/riges.393.0116. https://www.cairn.info/revue-gestion-2014-3-page-116.htm
- Kagermann, H., Wahlster, W., & Helbig, J. (2013). Securing the future of German manufacturing industry - Recommendations for implementing the strategic initiative Industrie 4.0 (Final report of the Industrie 4.0 working group). Plattform Industrie 4.0.
- Kohli, R., & Grover, V. (2008, Janvier). Business value of IT: An essay on expanding research directions ton keep up with the times. Journal of the Association for Information Systems, 9(1), 23–29. Article 2. https://doi.org/10.17705/1jais.00147
- Leurent, H., Betti, F., & Narayan, J. (2019). (Fourth industrial revolution beacons of technology and innovation in manufacturing).World Economic Forum.
- Lueth, K. L. (2015). Will the industrial internet disrupt the smart factory of the future. IoT Analytics. https://iot-analytics.com/industrial-internet-disrupt-smart-factory/
- McKinsey Digital. (2015). Industry 4.0. how to navigate digitization of the manufacturing sector. McKinsey&Compagny.
- Ministère de l’Économie, de la Science et de l’Innovation (MESI). (2016). Plan d’action en économie numérique. Stratégie numérique du Québec (Gouvernement du Québec 2016). Bibliothèque et Archives nationales du Québec. ISBN: 978-2-550-75695-8.
- Moeuf, A., Pellerin, R., Lamouri, S., Tamayo-Giraldo, S., & Barbaray, R. (2018). The industrial management of SMEs in the era of Industry 4.0. International Journal of Production Research, 56(3), 1118. https://doi.org/10.1080/00207543.2017.1372647
- Pellerin, R., Rivest, L., & Danjou, C. (2016). Prendre part à la révolution manufacturière? (Du rattrapage technologique à l’Industrie 4.0 chez les PME). CEFRIO.
- Pelletier, C. (2018, Mars). Présentation sur l’industrie 4.0. Travaux fondés sur Baltzan et Welsh (2015) et Laudon et Laudon (2016) (Chambre de commerces et d’industries de Trois-Rivières). CCITR.
- Portal, P. L. M. (2015). PLM as enabler for industry 4.0. [En ligne]. consulté le mars 27, 2017. NTT Data. http://www.plmportal.org/en/ntt-data-plm-as-enabler-for-industry-4-0.html
- Porter, M. (2008). Competitive advantage: Creating and sustaining superior performance. Simon and Schuster.
- Porter, M. E. E., & Heppelmann, J. L. (2014, Novembre). How smart, connected products are transforming competition. Harvard Business Review, 11(92), 64-88. https://hbr.org/2014/11/how-smart-connected-products-are-transforming-competition
- Productique Québec. (2016). Feuille de route Industrie 4.0. Ministère de l'Économie et de l'Innovation.
- Qin, J., Liu, Y., & Grosvenor, R. (2016). A categorical framework of manufacturing for Industry 4.0 and beyond. Procedia CIRP, 52, 173–178. Elsevier. https://doi.org/10.1016/j.procir.2016.08.005
- Sangmahachai, K. (2015). Revolution to Industry 4.0. Kasetsart energy and technology management center.
- Tortorella, G. L., & Fettermann, D. (2018). Implementation of Industry 4.0 and lean production in Brazilian manufacturing companies. International Journal of Production Research, 56(8), 2975. https://doi.org/10.1080/00207543.2017.1391420
- Weinman, F. (2015). Digital disciplines: Attaining market leadership via the cloud, big data, social, mobile, and the internet of things. Wiley.
- Zaeid, R. M. B., Affes, H., & Hikkerova, L. (2015). Sources externes de connaissances, Innovation organisationnelle et Performance organisationnelle. Gestion 2000, 32(5), 81–98. https://doi.org/10.3917/g2000.325.0081