
 ?Mathematical formulae have been encoded as MathML and are displayed in this HTML version using MathJax in order to improve their display. Uncheck the box to turn MathJax off. This feature requires Javascript. Click on a formula to zoom.
Abstract
This project is primarily aimed at determining the effect of phase inversion on oil-water dispersion from a three-phase mixture comprising of an oil-water emulsion at different oil percentages and air at varying liquid and gas flowrates through a horizontal pipe. Parameters affected by phase inversion were investigated such as liquid-side pressure drop, viscosity and flow regimes. The liquid-side pressure drop was estimated and predicted from existing as well as developed correlations. The results obtained were tabulated and represented graphically. Viscosity measurements were taken at different oil percentages. At inversion, the mixture’s continuous phase switched from water to oil as indicated by the increase in viscosity and pressure drop. A significant change in pressure drop was noted for all correlations used beyond the point of phase inversion. The viscosity of the liquid phase was tried to be related with oil percentage empirically to get a Reynolds’s no of laminar or turbulence. However, that did not influence the prediction significantly. It was also found that tghe occurrence of phase inversion affected the flow regimes of the mixture causing a shift from a plug dominant flow to a more slug-type flow pattern.
PUBLIC INTEREST STATEMENT
Simultaneous flow of four phases, namely, water, crude oil, gas and sand are not uncommon during oil exploration. Pipeline emulsions flow is inescapable for upstream oil production system in transporting mixtures of crude oil and water. The mixing, turbulence as well as agitation through wellbores, expansion or contraction, valves, pumps etc. will emulsify either the oil phase or water phase. Investigation of the flow regimes for three phase flow system, emerged to be as two-phase flow, namely, the air phase and oil dispersed in water phase, termed as oil-water emulsion phase or simply emulsion phase, is aimed by the researchers in The University of The West Indies (UWI).
1. Introduction
The phase multiphase flow defines the flow at least two phases, at the same time. This flow occurs mostly in the petroleum industry. As a result, the understanding of the flow mechanics is significant. Emulsions can be seen in the industry. For example, when oil is being produced and processed, crude oil can be seen accompanied by water and naturally occurring emulsifiers. The oil is always accompanied with water when it is produced from the reservoir and drawing near to the completion of the reservoir’s lifetime, there will be even more water produced. This is particularly true in cases when a natural water aquifer is a driving force for the reservoir. This situation encourages water-in-oil emulsions to occur. In a situation, where water increases and act as a continuous phase, it would be oil-in-water dispersion. The change of continuous phase from oil to water or water to oil is termed as phase inversion (Chakrabarti et al., Citation2006). Nevertheless, most research has been limited to batch processes and in flow systems, research would have been influenced by facts of research gathered from stirred vessels (Norato et al., Citation1998; Selker & Sleicher, Citation1965; Zaldivar et al., Citation1995). Most of the equations to predict inversion are empirical in nature (Arirachakaran et al., Citation1989; Yeh et al., Citation1964) and the only analysis by Brauner and Ullmann (Citation2002) has tried estimating this point of phase inversion by minimizing the system-free energy, in conjunction with a simulation for the prediction of drop size in droplet dispersions (Chakrabarti et al., Citation2006). Chesters and Issa (Citation2004) presented a model that would illustrate the development of phase inversion processes in two-fluid systems. This model was formed inside the borders of the two-fluid model for dispersed flows, by applying Computational Fluid Dynamics (CFD) methods. Inversion has been mainly identified experimentally via visual observations (Chakrabarti, Citation2014; Chakrabarti et al., Citation2009; Russell & Charles, Citation1959), assessment of effective conductivity of the dispersion (Angeli & Hewitt, Citation2000; Vigneaux et al., Citation1988) as well as prediction of the pressure gradient (Taitel & Dukler, Citation1976). Nevertheless, no conclusions were able to be drawn mainly because of the complexity of flow imagery at high flow velocities. The study by Hapanowicz and Troniewski (Citation2002) shows, the pressure gradient of water dispersed in oil flow regime displays substantial differences when compared to estimations of the homogeneous flow model and, in the study, it is put forward that suitable viscosity corrections can make predictions better. Additionally, they tried including effects of flow regime in the investigation of holdup as well as pressure drop for liquid-liquid flow. Pal (Citation1993) suggested that the decrease in pressure gradient of the dispersed flow as compared to the lone phase may be due to the drag depletion phenomena where the drag reduction is higher in case of oil continuous flow (Selker & Sleicher, Citation1965). He attributed this phenomenon to the effect of droplet breakdown and drop-coalescence on the instability of dispersion due to turbulence (Lovick & Angeli, Citation2004). It goes without saying that more studies are needed so that a better knowledge of phase inversion can be gained. Recently most of the work focussed on the novel detection or physical challenges of pure phases (Agarwal & Dondapati, Citation2020; Drummond et al., Citation2020; Li et al., Citation2020; O’Donovan & Grimes, Citation2020; Rafałko et al., Citation2020; Shi et al., Citation2020) but no research were done on dispersed or emulsified phases.
However, in the present study, the change of flow regime with respect to varying oil percent is observed. This is unique and nowhere is it reported. The flow pattern change with viscosity is more significant for the inverted phase. This is a novel.
2. Experimental procedure
A diagram of the flow system used in this investigation is depicted in Figure . The outlets of the manometer containing Carbon tetrachloride as manometric fluid are connected to the pipe and set apart at a distance of 1.5 m. Thus, pressure measurements are obtained using the bottom liquid phase. The oil (at 1 atm. Pressure and 32°C, surface tension = 31dynes/cm, μ = 52cP, ρ = 907.78 kg/m3) and water are mixed in the tank. Soybean oil was decided as the oil of choice in order to evade environmental hazard involved with utilizing petroleum oil. At the same time, high viscosity during flow would be able to be examined, just like in the case, if crude oil was used. The pipe is 5 m in length and 50 mm in internal diameter. The whole test section of the pipe as well as the view section is of transparent acrylic material which is 1 m in length. The bypass valve, V2, and the control valve, V1, are regulated to manage and change the flow rate of the liquid. The liquid flow rate is measured using the flow meter. The dispersion is recycled to the tank. The air from a compressor is sent to the flow system and its flow rate measured using a flow meter. Because of 90 psig discharge pressure of the compressor, the air flow rate is controlled by a bypass valve leading to atmosphere, keeping a low positive pressure (4 psig) in the test section and finally, it is exhaled to the atmosphere.
Figure 1. Test rig for multiphase flow; (a) schematic, (b) photograph.
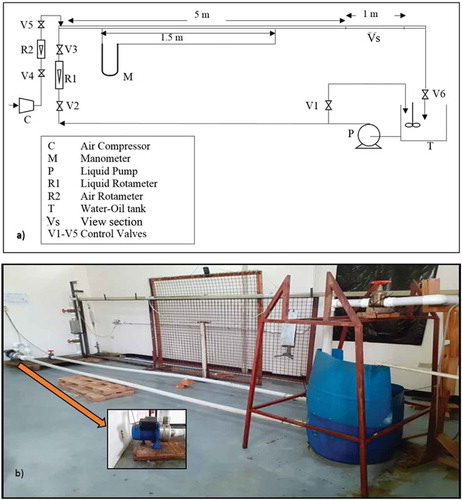
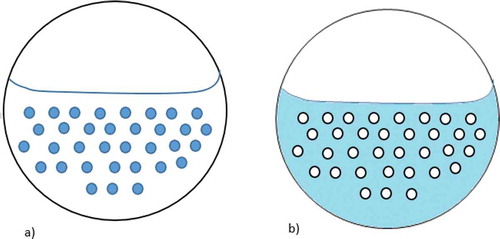
Flow regimes are seen in the see-through tube of the pipe. A Sony HDR-CX240 camera video records the flow regimes. The gas velocity range is from 0.05 to 0.6 m/s. The experimental runs are performed for liquid velocities up to 1.25 m/s. This whole method is conducted for a range of oil cuts from 0 to 0.9. The viscosity of different dispersions of various oil cuts are measured using a Brookfield DV-E viscometer. At these oil cuts, the continuous phase changes from water to oil. Figure depicts the cross-sectional view of a) air with water continuous phase and b) air and water dispersed phase.
Figure 2. (a) water-continuous and (b) oil-continuous phase in a pipe.
3. Results and discussion
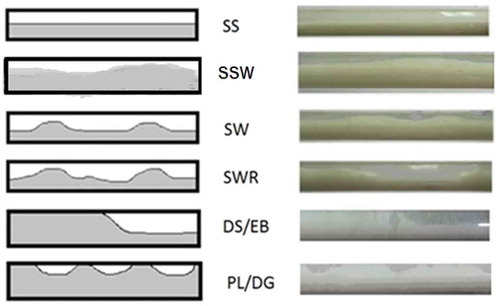
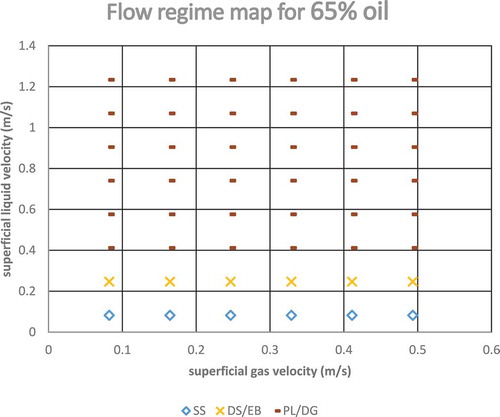
The flow patterns observed at the various oil percentages at different phase velocities (superficial velocity of air ranging from 0.05 to 0.6 m/s and superficial velocity of liquid mixture ranging from 0.05 to 1.25 m/s, given in Figure ) are of four types. The stratified smooth (SS), and stratified-wavy small' (SSW) flow patterns were observed in lower phase velocities. This small signifies small wave height or amplitude. Additionally, the stratified wavy (SW) as well as the stratified wavy with ripples (SWR) were also seen (Edwards et al., Citation2018). For higher liquid velocities (superficial velocity of air maintained up to 0.5 m/s and superficial velocity of liquid mixture controlled up to 1.25 m/s, given in Figure ) flow patterns observed are dispersed slug/elongated bubble (DS/EB) and plug/dispersed gas (PL/DG). The flow regime was classified as DS/EB when the liquid occupied the entire pipe and, intermittently, long air bubbles occupied the top of the pipe. The flow regime was classified as PL/DG when the liquid occupied the entire pipe and, periodically, small air bubbles would occupy the top of the pipe (Figure ). For higher phase velocities SSW and SWR are not used to designate flow pattern, in lieu of that SW has been used.
Figure 3. Flow patterns observed; Stratified smooth (SS), stratified-wavy small (SSW), stratified wavy (SW), stratified wavy with ripples (SWR), dispersed slug/elongated bubble (DS/EB) and plug/dispersed gas (PL/DG).
In this work no emphasis is given to find the inversion point, however, the work is done to check the effects of phase inversion on flow pattern or pressure drop and liquid hold up (ratio of liquid-volume retained in the pipe to the pipe volume). Two different oil cuts are tried for this purpose, 40%, where water is a continuous phase and 65% where oil is a continuous phase. Figures and represent the flow patterns at this two different cuts. The change in flow pattern can be considered to be a result of the higher resulting viscosity when the oil cut becomes higher. The higher viscosity leads to a dampening effect on the unstable flow. The presence of the air phase flowing is not sufficient to cause its shear effects to prevail over gravitational as well as viscous effects of the liquid phase. So from 40% to 65% oil cut elongated bubble region becomes narrow to give a bigger area of plugs.
Figure 4. Flow regime map at 40% oil cut.
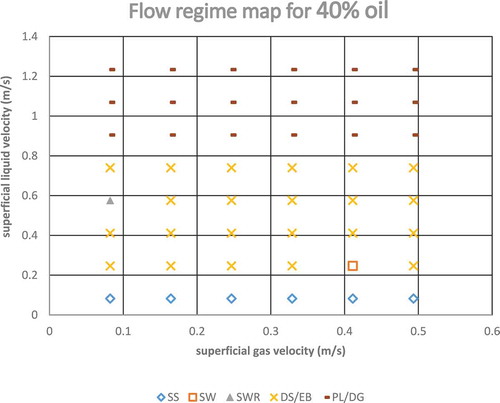
Figure 5. Flow regime map at 65% oil cut.
These observations, noted concerning the flow patterns are the effect of oil and water forming a dispersion, the oil dispersed in water or vice versa as small drops. Oil and water come together under the condition of the mixture being allowed to be stirred in the tank T. The dispersion can be considered to be in a state of equilibrium because oil and water had not become completely separate. The cause of this can be vigorous agitation of the dispersion in the tank, resulting the droplets not coming together subsequently to move through the flow system. The air-oil-water flow may be considered to have acted like two-phase gas-liquid mixture, and therefore weighted average liquid properties can be applied. Within the liquid phase, it moves from water continuous to oil continuous phase. However, the variation of viscosity is not considered a property which is additive (Edwards et al., Citation2018). Furthermore, viscosities for various oil cut were employed to do the balance of momentum equations expressed (EquationEquations 1(1)
(1) –Equation11
(11a)
(11a) ) by Taitel and Dukler (Citation1976). These equations are explained by Edwards et al. (Citation2018). Better result has not occurred in doing this for validation of the transition in flow pattern for various oil cuts. Variation of velocity gradient regarding viscosity must be examined even more. For the prediction of pressure drop or liquid holdup, Taitel and Dukler (Citation1976) theory is extended for calculation.
With referencing the Figure & , simultaneous flow of gas, oil and water, is under consideration. Ideally water, being denser than oil, takes up the bottom of the pipe, oil is flowing through the middle, with gas flowing at the top of the pipe for pure stratified and separated flow. However, for the present study, only two phases are visible, gas phase and liquid phase, an emulsion of oil and water. The momentum balance with respect to the individual phases is expressed as:
As either oil or water is in dispersion in the bottom phase, the liquid is treated as a single-phase (Figure ). Physical properties of liquid are considered as additive properties of water and oil excluding viscosity. Viscosity is estimated using EquationEquation (11)(11a)
(11a) (Edwards et al., Citation2018). Momentum balance for the liquid phase is:
The symbol A denotes the cross-sectional area, represents the density, P signifies pressure and
is the inclination angle and is used as positive for upward inclination. When the flow is downward +
should be used in EquationEquations (1
(1)
(1) –Equation3
(3)
(3) ). The subscripts W, O, G and L denote water, oil, gas and oil + water-emulsion, respectively. In this scenario, three shear stresses are required to be found;
, shear stress that acts on the wall wetted by the liquid SL;
, shear stress that acts on the wall wetted by the gas SG;
, shear stress that acts on the liquid and gas interface Si.
EquationEquation (8)(8)
(8) can be used to estimate friction factors, fL, fG and fi. C = 0.046, n = 0.2 if the flow is turbulent, and C = 16, n = 1 in the case of the flow being laminar. Reynolds number, using hydraulic diameters, is expressed as
The expression of liquid viscosity is in cP of (Edwards et al., Citation2018)
where y = percentage of oil.
In the case of interfacial gas-liquid shear stress, we utilized a constant value of fi = 0.014. However, if the value of fG is greater than fi, then fi = fG is applied.
When pressure drop is eliminated from EquationEquations (3(3)
(3) ) and (Equation4
(4)
(4) ), EquationEquation (12)
(11b)
(11b) is yielded.
EquationEquation (12)(12)
(12) is worked out to obtain the pressure drop and holdup.
In Figures & experimental flow patterns are compared. In this current work, the water and oil together act like a single-phase and therefore is like a two-phase system (Edwards et al., Citation2018). To begin the numerical estimation of pressure drop and holdup, the volumetric flow rate of liquid and gas is required.
Theories are deduced on the basis of two-phase, gas-liquid system. Nevertheless, in the case of liquid phase being a mixed/dispersed one, the impact on stratification has not been elucidated in previous works. With varying oil cuts or in refined way, with the variation in viscosity of the liquid, a variety of flow patterns are observed in the stratified regime. This is novel.
Within the experimental range of velocity, estimating pressure drop (Figure ) and liquid holdup (Figure ) are not as faultless as SS flow regime for a water-air flow scenario (Brauner et al., Citation1996; Breggs & Brill, Citation1973; Taitel & Dukler, Citation1976). Breggs and Brill (Citation1973) theory of slug flow is added to get a better prediction. However, it is not the case for all ranges. The cause of this may again be attributed to the change in flow regime occurring with various oil proportion. In some instances, prediction went over ± 31% and can be the result of abrupt variation in viscosity of the liquid as well as deviation from ideality.
Figure 6. Liquid holdup and prediction.
Figure 7. Pressure drop and prediction.
4. Conclusions
In this investigation, the liquid is an oil-dispersion in water as well as an inverted water dispersion. The addition of more oil to the liquid-phase causes a sparging effect on the flow pattern transition, most considerably from stratified to plug/slug flow. In addition to the flow regime, liquid hold up and pressure drop are also compared with previous research and present prediction of stratification. As the stratification and deviation are not ordered in the present study, experimental data are deviated largely from prediction up to ±31%. This deviation is also resulted from lower or higher flow rates of liquid, not occupying the whole pipe cross-section in the absence of air flow. Addition of oil in the oil-water liquid-phase increases the map-area of plug/slug flow pattern. However, this phenomenon is not consistent right through. The shift is more significant for the inverted phase. This investigation is done mostly by visual observation as well as normal video camera and image processing. However, the change of flow regime with respect to varying oil percent is unique and nowhere is it reported. It is recommended to have high-speed camera, conductivity probe or optical probe for flow pattern detection in a finer way.
Nomenclature
A Cross-sectional area (m2)
C Constant, in EquationEquation (8)(8)
(8)
D Pipe diameter and hydraulic diameter (m)
f Friction factor
g Acceleration due to gravity (m s−2)
L Length of the tube (m)
n Constant, in EquationEquation (8)(8)
(8)
p Pressure (N/m2)
Re Reynold’s number
S Perimeter of the tube (m)
U Superficial velocity of a phase (m s−1)
x Distance in pipe towards the direction of flow (m)
y Oil fraction in liquid phase
Greek letters
Upward inclination angle (o)
Viscosity (kg. m−1s−1)
Density of a phase (kg m−3)
Shear stress (kg m−1 s−2)
Subscripts and superscripts
G Gas
i Interface
L Liquid (W+O)
O Oil
W Water
Additional information
Funding
Notes on contributors
Laura Edwards
Laura Edwards is a research student at The University of the West Indies, St Augustine, Trinidad and Tobago within the Chemical Engineering Department. Her Current research work is mainly based upon the flow of oil, gas and water through pipelines. Investigation of the flow regime effects on hydrodynamics of various multiphase flow conditions in different geometrical orientation is being done by her. Ms. Edwards acquired BSc as well as MSc in Chemical & Process Engineering from the aforementioned University.
References
- Agarwal, R., & Dondapati, R. S. (2020, June 5). Numerical investigation on hydrodynamic characteristics of two-phase flow with liquid hydrogen through cryogenic feed lines at terrestrial and microgravity. Applied Thermal Engineering, 173, 115240. https://doi.org/10.1016/j.applthermaleng.2020.115240
- Angeli, P., & Hewitt, G. F. (2000). Flow structure in horizontal oil-water flow. International Journal of Multiphase Flow, 26(7), 1117–10. https://doi.org/10.1016/S0301-9322(99)00081-6
- Arirachakaran, S., Oglesby, K. D., Malinowsky, M. S., Shoham, O., & Brill, J. P. (1989, March 13-14). An analysis of oil/water flow phenomena in horizontal pipes. SPE Paper 18836, SPE Prod. Operating Symp., Oklahoma (pp. 155–167).
- Brauner, N., Rovinsky, J., & Moalem Maron, D. (1996). Determination of the interface curvature in stratified two-phase systems by energy considerations. International Journal of Multiphase Flow, 22(6), 1167–1185. https://doi.org/10.1016/0301-9322(96)00046-8
- Brauner, N., & Ullmann, A. (2002). Modelling of phase inversion phenomenon in two-phase pipe flow. International Journal of Multiphase Flow, 28(7), 1177–1204. https://doi.org/10.1016/S0301-9322(02)00017-4
- Breggs, H. D., & Brill, J. P. (1973). A study of two-phase flow in inclined pipes. Journal of Petroleum Technology, 25(5), 607–617. https://doi.org/10.2118/4007-PA
- Chakrabarti, D. P. (2014). Prediction of phase split in horizontal T‐junctions: Revisited. Chemical Engineering & Technology, 37(10), 1813–1816. https://doi.org/10.1002/ceat.201300848
- Chakrabarti, D. P., Das, G., & Das, P. K. (2006). The transition from water continuous to oil continuous flow pattern. AIChE Journal, 52(11), 3668–3678. https://doi.org/10.1002/aic.10988
- Chakrabarti, D. P., Das, G., & Das, P. K. (2009). Liquid-liquid two-phase flow through an orifice. Chemical Engineering & Technology, 196(9), 1117–1129. https://doi.org/10.1080/00986440902897459
- Chesters, A. K., & Issa, R. (2004). A framework for the modelling of phase inversion in liquid-liquid systems. Paper No. 271, 5th Int Conf Multiphase Flow, ICMF’04, Yokohama, Japan, May 30-June 4.
- Drummond, K. P., Weibel, J. A., & Garimella, S. V. (2020, June). Two-phase flow morphology and local wall temperatures in high-aspect-ratio manifold microchannels. International Journal of Heat and Mass Transfer, 53, 119551. https://doi.org/10.1016/j.ijheatmasstransfer.2020.119551
- Edwards, L., Jebourdsingh, D., Dhanpat, D., & Chakrabarti, D. P. (2018). Hydrodynamics of air and oil–water dispersion/emulsion in horizontal pipe flow with low oil percentage at low fluid velocity. Cogent Engineering, 5(1), 1494494. https://doi.org/10.1080/23311916.2018.1494494
- Hapanowicz, J., & Troniewski, L. (2002). Two-phase flow of liquid–liquid mixture in the range of the water droplet pattern. Chemical Engineering and Processing: Process Intensification, 41(2), 165–172. https://doi.org/10.1016/S0255-2701(01)00127-1
- Li, F., An, C., Duan, M., & Su, J. (2020, January 1). Combined damping model for dynamics and stability of a pipe conveying two-phase flow. Ocean Engineering, 195, 106683. https://doi.org/10.1016/j.oceaneng.2019.106683
- Lovick, J., & Angeli, P. (2004). Experimental studies on the dual continuous flow pattern in oil-water flows. International Journal of Multiphase Flow, 30(2), 139–157. https://doi.org/10.1016/j.ijmultiphaseflow.2003.11.011
- Norato, M. A., Tavlarides, L. L., & Tavlarides, L. L. (1998). Phase inversion studies in liquid‐liquid dispersions. The Canadian Journal of Chemical Engineering, 76(3), 486–494. https://doi.org/10.1002/cjce.5450760319
- O’Donovan, A., & Grimes, R. (2020, July 1). Two-phase flow regime identification through local temperature mapping. Experimental Thermal and Fluid Science, 115, 110077. https://doi.org/10.1016/j.expthermflusci.2020.110077
- Pal, R. (1993). Pipeline flow of unstable and surfactant‐stabilized emulsions. AIChE Journal, 39(11), 1754–1764. https://doi.org/10.1002/aic.690391103
- Rafałko, G., Mosdorf, R., & Górski, G. (2020, April). Two-phase flow pattern identification in minichannels using image correlation analysis. International Communications in Heat and Mass Transfer, 113, 104508. https://doi.org/10.1016/j.icheatmasstransfer.2020.104508
- Russell, T. W. F., & Charles, M. E. (1959). The effect of the less viscous liquid in the laminar flow of two immiscible liquids. The Canadian Journal of Chemical Engineering, 37(1), 18–24. https://doi.org/10.1002/cjce.5450370105
- Selker, A. H., & Sleicher, C. A., Jr. (1965). Factors affecting which phase will disperse when immiscible liquids are stirred together. The Canadian Journal of Chemical Engineering, 43(6), 298–301. https://doi.org/10.1002/cjce.5450430606
- Shi, S., Wang, D., Qian, Y., Sun, X., & Tentner, A. (2020, June). Liquid-phase turbulence measurements in air-water two-phase flows using particle image velocimetry. Progress in Nuclear Energy, 124, 103334. https://doi.org/10.1016/j.pnucene.2020.103334
- Taitel, Y., & Dukler, A. E. (1976). A model for predicting flow regime transitions in horizontal and near horizontal gas‐liquid flow. AIChE Journal, 22(1), 47–55. https://doi.org/10.1002/aic.690220105
- Vigneaux, P., Chenais, P., & Hulin, J. P. (1988). Liquid-liquid flows in an inclined pipe. AIChE Journal, 34(5), 781–789. https://doi.org/10.1002/aic.690340508
- Yeh, G., Haynie, F. H., Jr., & Moses, R. E. (1964). Phase-volume relationship at the point of phase inversion in liquid dispersions. AIChE Journal, 10(2), 260–265. https://doi.org/10.1002/aic.690100224
- Zaldivar, J. M., Alos, M. A., Molga, E., Hernandez, H., & Westerterp, K. R. (1995). The effect of phase inversion during semibatch aromatic nitrations. Chemical Engineering and Processing: Process Intensification, 34(6), 529–542. https://doi.org/10.1016/0255-2701(95)04110-9