
 ?Mathematical formulae have been encoded as MathML and are displayed in this HTML version using MathJax in order to improve their display. Uncheck the box to turn MathJax off. This feature requires Javascript. Click on a formula to zoom.
Abstract
The assessment of service quality has received increasing attention over the past few decades. The SERVQUAL model is an instrument that is commonly used to quantify the quality of a service. It divides “service quality” into five dimensions: tangibles, responsiveness, reliability, assurance, and empathy. SERVQUAL, however, is not intended to be instantly implemented into every industry or business sector, as items belonging to each dimension need to be adjusted to suit the characteristics of the industries assessed. This study aims to apply the SERVQUAL dimensions to the beverage transportation industry. This is done firstly by compiling assessment items from the relevant literature. The selected items are then modified to suit the beverage logistics industry and classified into the five dimensions. The validity of the items is confirmed by the item-objective congruence index and through interviews of industry experts. A pilot study is conducted to test the items’ reliability using the Cronbach’s alpha values. The revised version of the questionnaire can be used as an effective instrument for assessing the quality of services of the beverage transportation providers. The proposed instrument is then applied in a survey of sampled customers of a case study company. Gap analysis, quadrant analysis, point allocation, and the weighted sum methods are used to analyse the company’s service quality. The importance of the five SERVQUAL dimensions is also investigated through the survey, and the results show that “reliability” is the most important aspect for retailers and wholesalers in the beverage industry.
PUBLIC INTEREST STATEMENT
The assessment of service quality is a critical component of understanding customer satisfaction and initiating plans for improvement of a company. SERVQUAL is a framework that is used to evaluate service quality in many sectors. However, a literature review reveals that SERVQUAL has not been applied to the beverage transportation sector, which continues to grow steadily and contributes greatly to the global economy. This paper develops an assessment instrument of service quality based upon SERVQUAL that is suitable for the beverage transportation sector and investigates the importance of several service dimensions that influence customer satisfaction.
1. Introduction
Currently, to select a third-party logistics service provider (LSP), most entrepreneurs do not only focus on price, but consider many other factors, particularly the ability to provide a good service (Banomyong & Supatn, Citation2011; Ramanathan & Karpuzcu, Citation2011). Service quality is one of the critical factors that influences customer satisfaction and purchasing decision (Kahnali & Esmaeili, Citation2015). It critically influences market expansion and increases in market share (Neo et al., Citation2004). Canciglieri Junior et al. (Citation2019) reviewed the literature on service quality management and found that more than half of the reviewed publications specify that “customer satisfaction” is the main approach of quality management of the service business. Service quality, which strongly correlates with customer satisfaction, is generally defined as the compatibility of a customer’s experience of receiving a certain service with his or her prior expectations (Canciglieri Junior et al., Citation2019; Parasuraman et al., Citation1994, Citation1988). This concept is the basis for the well-known service quality assessment framework “SERVQUAL”. The original framework of SERVQUAL suggests that practitioners assess service quality using five dimensions: (i) Tangible (service provider’s physical equipment and facilities, personnel, and communication devices); (ii) Responsiveness (service provider’s willingness to help the customers and promptness); (iii) Reliability (service provider’s capability to provide reliable, accurate, and punctual services as promised to the customers); (iv) Assurance (service provider’s ability to attract customers’ trust and confidence in their professional knowledge and mindset); and (v) Empathy (service provider’s understanding of customers’ needs and difficulties, and the ability to treat them with empathetic attention; Kadłubek & Grabara, Citation2015; Kahnali & Esmaeili, Citation2015). Items in each dimension ask customers to rate their expectations (before using the services) and perception (after using the services) using a Likert scale. The gap between customers’ expectations and perceptions can then be analysed to determine service quality performance and areas for improvement.
During the past decade, SERVQUAL has been applied to assess the quality of logistics services in several areas, such as a pharmaceutical distribution company in Turkey (Ramanathan & Karpuzcu, Citation2011), a warehousing services company in Iran (Kahnali & Esmaeili, Citation2015), LSPs in Da Nang city (Limbourg et al., Citation2016), and freight forwarding companies in Serbia (Kilibarda et al., Citation2016). Customers of different types of logistics services are highly likely to have different requirements and expectations. According to Whitley (Citation1992) and Goyal et al. (Citation2013), business systems are likely to vary among different industries and countries, and research findings from a particular area are not generalisable to a case of another industry or country until an empirical validation has been conducted. This implies that the list of items for each SERVQUAL dimension needs to be revised to make the items appropriate and applicable to the specific characteristics of a business process. To date, no previous study has applied SERVQUAL to a beverage transportation service.
Globally, the beverage industry continues to grow steadily, as the volume of drinks consumed in the world increased by around 300 billion litres from 2008 to 2017 (Yongpisanphob, Citation2019). In Thailand, the beverage industry plays a significant role in contributing to the national economy (Bootdachi & Khaochaimaha, Citation2015). This industry is also related to many other sectors, such as plastic and sugar manufacturing. In 2017, there were almost 800 beverage manufacturers registered with the Department of Industrial Works in Thailand; 88% of them produced non-alcoholic drinks while the rest were registered as alcoholic drink producers (Yongpisanphob, Citation2019). Thailand is a newly industrialised country in which the logistics industry has been rapidly growing over the past decade. This might be partly influenced by the 2008 Roadmap for the Integration of Logistics Service, which facilitates the free flow of LSPs among Southeast Asian countries (Bootdachi & Khaochaimaha, Citation2015). Thailand is also generally viewed as one of the Asia-Pacific hubs of product distributions. The physical distribution service is generally characterised by encounters between people delivering products and their customers, and also by procedures for placing the order, conducting transactions, and handling discrepancies (Neo et al., Citation2004). Beverages in Thailand are commonly transported by truck, and special care is required in transporting beverage products to avoid damage and hygiene issues. Seasonal fluctuations of demand are another challenge for the beverage industry, and this also affects logistics planning and services. Beverage LSPs need to be flexible in the services provided and need to be able to handle sudden changes in satisfactory ways.
The purpose of this study is therefore to develop a list of assessment items under the five dimensions of SERVQUAL that can be suitably applied to the assessment of the beverage transportation service quality, particularly for the Thai beverage manufacturers and LSPs, as well as countries whose logistics operations are mainly conducted by truck. In addition, since some dimensions of the service quality do not contribute equally to the overall satisfaction of a customer, and their influence tends to be different according to supply chain positions and business sectors (Sohn et al., Citation2017), this study also aims to understand what the critical dimensions of beverage LSPs are and what companies should prioritise to improve their businesses using customer perspectives. It is not sensible for a firm to put efforts into improving areas that the customers do not value (Silva et al., Citation2014).
This paper is organized as follows. After the introduction, Section 2 provides a review of studies that have employed SERVQUAL to address logistics service quality and presents a first draft of the assessment items as determined from the literature review. Section 3 then describes the research methodologies. Section Section 4 gives the revised version of the items and confirms validity and reliability, suggesting that these are the appropriate instruments for assessing beverage transportation service quality. 5 then applies the proposed framework to a single case study. Section 6 shows the analysis of the degree of importance of each SERVQUAL dimension. The conclusion is in the last section.
2. Applications of SERVQUAL in the logistics industry
A review of academic articles that used SERVQUAL to assess the quality of logistics services shows that many studies have modified the dimensions of SERVQUAL to suit the characteristics of a sector. For instance, Limbourg et al. (Citation2016) developed items for assessing the service quality of local LSPs in Da Nang city. They proposed 24 items to be included in the five SERVQUAL dimensions. Similarly, Kilibarda et al. (Citation2016) identified 22 items to assess the service quality of freight forwarding companies in Serbia. A confirmatory factor analysis was employed to test and verify the structure of each of the five SERVQUAL dimensions, and the Cronbach’s alpha values were computed to test the reliability of these items. Kadłubek and Grabara (Citation2015) also proposed another 22 items to assess the service quality of 147 cargo motor transport companies in Poland. For each company, two customers were sampled to participate in a survey study. Neo et al. (Citation2004) studied the quality of logistics service by applying SERVQUAL to a warehousing service company in Singapore. Various performance measures for logistics operations were gathered from the literature review and then classified into the five dimensions of SERVQUAL. Each performance measure was then broken down into several service attributes (or items). Quadrant analysis was adopted to separate the quality into four quadrants using two dimensions—customer’s expectation and firm’s performance—to identify the appropriate actions for improvement for the case study of the company.
Various studies proposed additional dimensions for the SERVQUAL model. For example, Kahnali and Esmaeili (Citation2015) employed the concept of “gap analysis” to assess and compare service quality provided by two branches of a customs warehousing company in Iran. Instead of using the typical five dimensions of SERVQUAL, their study categorised service characteristics for the warehousing services into nine dimensions: tangible, timelines, availability, costs, reliability, flexibility, assurance, empathy, and responsiveness. Similarly, Ramanathan and Karpuzcu (Citation2011) modified the SERVQUAL dimensions to apply to the pharmaceutical wholesaling business, and proposed seven dimensions: reliability, responsiveness, flexibility, availability, assurance, personnel contact quality, and tangibles. In Thailand, Banomyong and Supatn (Citation2011) identified 24 items to reflect the service quality of freight LSPs, and those items were categorised into six dimensions: reliability, assurance, tangibility, empathy, responsiveness, and cost. The impact of those items on the shippers’ decision to select an LSP were then examined through a logistics regression analysis.
Some studies have combined the SERVQUAL model with other marketing tools to analyse the quality of services in depth. For example, Hartono et al. (Citation2017) proposed the integration of SERVQUAL, the Kano model, Kansei Engineering, and the quality function deployment to study the quality of logistics services. They identified 26 attributes that were categorised in the five dimensions of SERVQUAL, and the attributes were then used to assess the quality of a hyperlocal transport service companies (that used motorcycles) in Indonesia. This study also proposed a method to determine the importance of each attribute: multiplying the satisfaction score (derived by the gap analysis) with the Kano weight and the Kansei score. This is similar to a study conducted by Baki et al. (Citation2009), which integrated SERVQUAL attributes with the Kano model and quality function deployment to propose a new solution for analysing the service quality of companies offering cargo services in Turkey. Gajewska and Grigoroudis (Citation2015) determined the importance, or the weights, of logistics services attributes using a survey of customers in the road refrigerated transport sector. The rank reciprocal method was used to convert ordinal data into the weights. Silva et al. (Citation2014) analysed and compared customer satisfaction levels of service quality of a medium-size beverage distributor in Brazil, classifying 492 customers into many segments and retail categories. Service quality attributes were identified and put into nine categories: contact personnel’s quality; order’s attended quantities; information’s quality; order procedures; accuracy of the order; orders’ condition; order’s quality; manner of treating problems and complaints; and punctuality.
After a literature review of studies assessing the quality of logistics services in various countries, industries, or operations, several service attributes (or items) that were expected to be appropriate and practical for the characteristics of beverage transportation were identified. Items that were irrelevant to road freight transport were not considered. The collected items were then placed under each of the five typical dimensions of SERVQUAL, as shown in Table .
Table 1. Service quality assessment items collected and synthesized from the literature (draft version)
3. Methodology
This section is divided into three parts. Section 3.1 describes the development of the instrument that is used to assess the quality of beverage transportation services. Section 3.2 presents the process used to analyse the service quality of a case study company, while Section 3.3 describes the process used to analyse the importance of each SERVQUAL dimension.
3.1. The development of the assessment instrument
After determining the assessment items belonging to each of the five SERVQUAL dimensions, it is necessary to check whether these items are valid and reliable. Therefore, the next step is to conduct validity testing to ensure that each item measures the service quality for beverage transportation and to check whether the items are written ambiguously (including whether they are understandable for customers). There are two steps to validity testing. The first is interviewing three experts (two are managers of the case study company, which distributes beverages in Thailand, and another one is an academic lecturer in logistics management). The experts were asked whether the questions were appropriate for this industry and understandable to customers and asked to suggest appropriate revisions. The second step relies on the item-objective congruence (IOC) index. Six experts—four academic lecturers (three from the area of logistics engineering and management and one from the marketing field) and two managers from the case study company—were asked to independently assign a rating of 1, 0, or -1 to each question (1 = clearly measuring, 0 = degree to which it measures the content area is unclear, -1 = clearly not measuring; Turner & Carlson, Citation2003). After obtaining the IOC scores from all experts, the average score for each item was calculated. Each item is acceptable when its average score ranges between 0.5–1.0. The remaining items were then used to develop the questionnaire for the assessment of the service quality. Next, the questionnaire’s reliability and the internal consistency of the items under each SERVQUAL dimension were analysed using Cronbach’s alpha values. Questionnaires were sent to 30 customers of the case study company. The Cronbach’s alpha values were calculated through Minitab software. The questionnaire was considered reliable and acceptable if the values were over 0.7 for all dimensions.
Next, the obtained instrument was implemented for a case study company in Thailand to demonstrate the assessment and analysis processes. As mentioned previously, the case study is a large-scale LSP company that distributes beverage products in Thailand. The company oversees the management of their own distribution centre and transports products from manufacturing factories to customers, which are wholesalers and retailers located all over the country. The questionnaire was sent to 70 stores randomly selected from the list of their customers.
This questionnaire not only analyses the service quality of the case study company but can also be utilised to investigate the beverage wholesalers and retailers’ view on the importance of each dimension. To do this, the questionnaire is divided into three parts. The first part asks for the respondents’ general information (e.g., company name, address, contact number). The second part asks the customers to rate their expectations prior to receiving the services and their perception after receiving them using a 1–5 Likert scales. Part 3 asks them to provide their opinion on two aspects. Part 3.1 asks the respondents to subjectively rate their overall satisfaction of the service provided by the company using a 1–5 Likert scale. Part 3.2 asks the customers to estimate the degree of importance of each SERVQUAL dimension using the point allocation (PA) technique. PA asks the respondents to distribute 100 points to the five dimensions (Bottomley et al., Citation2000), so that the scores given by each customer measure the relative weight of each dimension on their overall satisfaction. After receiving the questionnaire back from the sample customers, the data was analysed to serve the two purposes, as explained in Sections 3.2 and 3.3.
3.2. The analysis of the service quality of the case study company
Firstly, the gap between the average perception (P) and the average expectation (E), or P-E, was calculated for each item. The nonparametric Wilcoxon signed-ranks test was employed to make inferences about the differences between the perception and expectation scores of customers. This analysis technique is suitable when the data is in the form of an ordinal scale or when its normal distribution is not guaranteed, or both. The hypothesis for the Wilcoxon signed-ranks test is shown below.
H0: The gap for each item is equal to zero.
H1: The gap for each item is not equal to zero.
Next, the quadrant analysis technique was adopted to supplement the analysis of the company’s service quality and to suggest further actions. This technique graphs the correlation between customers’ average perception and average expectation scores, and the scores are plotted into four quadrants, as shown in Figure . According to Neo et al. (Citation2004), the four quadrants have different implications. Items in Quadrant 1 are those that are essential for customer satisfaction and in which the company is performing well, so that the high performance of the company should be maintained. Items in Quadrant 2 are also important for customers, but the company’s performances have not yet met their expectations and the company should put more effort into improving these aspects. Items in Quadrant 3 are not significant for customer satisfaction, but the company values these items highly. The company may reconsider the allocation of resources and efforts to focus more on other items. Items in Quadrant 4, lastly, are neither critical for customer satisfaction nor performed well by the company. It is therefore not necessary to prioritise them at this moment.
Figure 1. Depiction of quadrants.
3.3. The analysis of the importance of each SERVQUAL dimension
The data from the questionnaire in Part 3.2 was used to rank the five dimensions based on their influence on customer satisfaction. The Kruskal-Wallis test was firstly employed to confirm whether, based on the medians, the five dimensions were rated differently or not (at 0.05 level of significance). If yes, the Mann-Whitney test was then used to perform pairwise comparisons to investigate the significant pairs. This ensured that the five dimensions could be ranked, and the descriptive statistics were then summarised. The average weight of each dimension could be further used to determine the overall customer satisfaction.
From the survey data, the overall customer satisfaction could be estimated using the simple additive weighting (SAW) method. The weight and the average perception score of each dimension as rated by respondents were utilised to calculate the composite score reflecting their overall satisfaction. SAW, usually called the weighted sum method, is a simple and straightforward method to calculate the composite score, and it is also fundamental in forming many other aggregation techniques in the multiple criteria decision-making (MCDM) context. SAW calculates the overall satisfaction score through the following equation.
represents the overall satisfaction score of a respondent
, considering the five SERVQUAL dimensions.
denotes the average perception rating of all items under dimension n given by the respondent
.
is the relative weight of dimension n (the original form of the weight of each dimension, given by each respondent, is divided by 100 to make the weights of all dimensions sum to one).
At this stage, a question still arises as to whether the calculated customer satisfaction scores are accurate or not, or whether the weighted averages are accurate enough to estimate the level of customer satisfaction. To investigate this, the scores calculated using the SAW method were compared to the ratings of each respondent (from the questionnaire in Part 3.1) using a correlation analysis.
4. Validity and reliability of the assessment items
This section is divided into two parts. The first part is the results of the validity test. It shows both the results of the experts’ opinions on ambiguous or inappropriate phrases and the results of the IOC method. The second part is the results from the reliability testing.
4.1. The validity test results
From the initial list of the items shown in Table , various changes were made as suggested by the three experts, which have been described below.
Item 2.1 has been changed to “The staff is willing to help customers out every time they are asked”.
Item 2.2 has been changed to “The staff provides instant transportation service after receiving an order, following the commitment”.
Item 2.3 has been changed to “The staff can quickly respond to any unexpected or urgent orders”.
Item 3.3 has been changed to “The company’s staff accurately issues an invoice (delivery order), a receipt, and a purchase order document”.
Item 3.5 has been changed to “The company’s staff can maintain the service quality performance or the performance is stable, as promised”.
Item 4.3 has been changed to “The company has a convenient and concise process for returning goods”.
Item 5.2 has been changed to “The company always launches activities to promote its long-term relationships with customers”.
Item 5.4 has been changed to “The company has a flexible opening time for customers”.
The questionnaire was revised according to these suggestions. Next, six experts were asked to participate in the IOC method. The results are shown in Table .
Table 2. IOC results
The IOC method gave six items average scores lower than 0.5. These items have been reconsidered and then deleted, as described below.
Item 1.3 has been deleted because the term “appropriate” might be unclear (the description does not clearly relate to any characteristic). Its underlying meaning also seems to overlap with items 1.4 and 1.5.
Item 1.6 has been deleted because the term “facilitate” is unclear and vague. It also overlaps with item 1.7.
Item 2.5 has been eliminated because this question is at odds with the responsiveness dimension.
Item 3.7 has been eliminated because it is related to accuracy and on-time delivery, which seems to duplicate items 3.1, 3.2, 3.3, and 3.4.
Item 4.5 has been deleted because the question is at odds with the assurance dimension.
Item 4.6 has been deleted because it overlaps with item 4.3.
4.2. The reliability test results
After the validity testing, the remaining items were used to develop the questionnaire. The reliability of the questionnaire was then analysed using Cronbach’s alpha values, which could be calculated quickly by Minitab software. The results are shown in Table . The Cronbach’s alpha values are over 0.7 for all dimensions of SERVQUAL. This means that all assessment items for each dimension are understandable and internally consistent with each other.
Table 3. Cronbach’s alpha values for the five SERVQUAL dimensions
After the validity and reliability testing processes, changes were made to create a valid and reliable questionnaire that can be used to measure service quality by using the customers’ expectations and perceptions, as presented in Table . The item numbers (the 1st column of Table ) have been rearranged according to the previous changes.
Table 4. Service quality assessment items for the beverage transportation service (the final version)
5. The application of the proposed framework to a beverage LSP in Thailand
After distributing the questionnaires to 100 sample customers (30 customers during the pilot study and 70 customers for the actual survey), 95 completed questionnaires were returned. Firstly, the gap analysis was conducted. Table shows the average (Avg.) and the standard deviation (Std.) of the perception (P) and expectation (E) and the gap scores (P-E) and the p-value from the Wilcoxon signed-ranks test of each item.
Table 5. The gap analysis
The results show that the average gaps are around zero. This indicates that the company’s service quality is generally satisfactory, since customers’ perceptions are very close to or slightly excel their expectations. The item with the lowest gap score and the lowest perception rating is item 5.2 (“The company always launches activities to promote its long-term relationships with customers”). However, the Wilcoxon signed-ranks test shows that the difference in the perception and expectation scores is not significant (p-value > 0.05). Insignificant gaps also appear for most of the items. There are only four items that have a p-value of less than 0.05, which signifies that the gaps of the four items significantly departs from zero. The data shows that the company performance in relation to these items are beyond the customers’ expectations (the gaps are positive). The four items include
Item 1.4 “The company’s vehicles, both inside the container and outside, are clean and sanitary”;
Item 4.1 “The company’s staff makes customers feel secure and confident when using the service”;
Item 4.2 “The staff and drivers have proper manners when providing services and communicating with customers”; and
Item 5.5 “The company’s drivers park in appropriate areas that are not illegal and do not disturb the local society”.
There is evidence to support the high performance of the company for items 1.4, 4.1, and 4.2. For example, the company’s human resources manager has stated that, during the past years, the company launched several activities to promote and encourage staff and operators to prioritise cleanliness and hygiene. Staff and operators were also recently trained about proper practices and etiquette when providing services. The manager affirmed that the survey results satisfactorily reflect what the company has done.
The standard deviations of the perception (Avg. Std. P = 0.74) are generally lower than that of the expectation (Avg. Std. E = 0.87). This implies that the company treats and takes care of all customers in the same manner. Item 5.5 is the only item that has a standard deviation greater than one, meaning that the customers generally have different opinions about this item. The company’s manager has explained that this is because some customers have their own parking areas that the LSPs can use and therefore are not concerned about the driver’s parking, while customers whose stores are on the roadside do care about where the drivers park while unloading the products.
The gap analysis seems to indicate that the company has performed well in terms of service quality. However, to adhere to their policy of continuous improvement, this analysis should suggest areas for improvement, which are determined through the quadrant analysis.
Figure 2. Matrix plot of the average perception versus the average expectation.
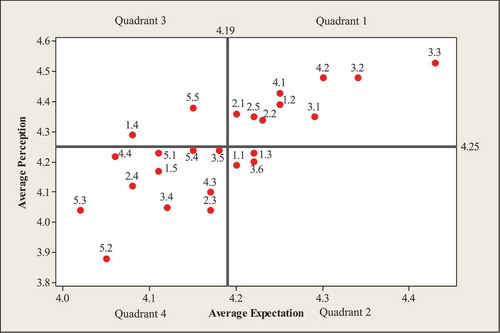
Figure shows the matrix plot, drawn using Minitab software, that divides the data into four quadrants defined by two aspects: the average perceptions on the vertical axis, and the expectations on the horizontal axis. For a 1–5 the rating scale, the mid-point value of 3 should be set as the intersection of the two axes (Neo et al., Citation2004). However, if this is set as the intersection, all items in this study would fall into Quadrant 1, indicating no room for improvement. To enhance the service quality, the intersection is moved to the mean scores of the two aspects (4.25 for the vertical and 4.19 for the horizontal axes). The high expectation scores of the customers can be explained, according to Babakus and Boller (Citation1992) and Neo et al. (Citation2004), as a common psychological pattern of the SERVQUAL model, since it is highly likely that customers will select the highest scores when asked to express their expectations. In this study, the perception ratings are also generally high. A possible reason lies in the fact that the company did not allow the researchers to distribute the questionnaire or contact the customers directly, and the survey was performed by the company itself. This might lead to some biases that arise from personal contact between the company staff and the respondents filling in the assessment forms. Nevertheless, this is only a hypothesis.
Figure shows that nine items (36% of the total items) are in Quadrant 1. These items are essential to the customers and the company fulfils them well. Fourteen items (up to 56%) are in the low performance areas (Quadrants 2 and 4). Among these, however, only three items (12% of the total) were very important to customers and were placed in Quadrant 2, which suggests that the company should strive to improve these aspects. The three items include item 1.1 (‘The company has enough modern facilities and equipment to ensure customers service), item 1.3 (“The company has appropriate and effective equipment for protecting goods and avoiding damage during transport”), and item 3.6 (“The company’s staff can deliver goods without flaws or damage”). The “tangible”, items 1.1, 1.3, and 1.5, which all relate to physical facilities, equipment, and technologies, fell into the bottom side of the perception axis, while items 1.2 and 1.4, which were in the high-performance areas, all link to the cleanliness and neatness of the drivers and vehicles. That means the company may need to invest more in physical items, particularly to protect goods and to avoid damage during transport. This point also connects to the low performance of item 3.6, which shows that product flaws or damages are a major problem for the company. This is one of challenges of the beverage transportation service.
Only two items (8%) were in Quadrant 3: item 1.4 (the vehicles’ cleanliness and sanitary conditions) and 5.5 (the drivers’ parking). This shows that the company should shift their efforts to other aspects that are more important to customers. However, if the company needs to follow the policy of corporate social responsibility, item 5.5 should be adhered to in order to avoid public complaints and legal warning and sanctions. This item also relates to corporate image and sustainability.
6. Analysis of the importance of the dimensions
The degree of importance of each SERVQUAL dimension was assessed by Part 3.2 of the questionnaire. The scores given by the customers for the five dimensions were weighted by dividing them by 100. Then, the weighted averages were compared to investigate their significant difference using the Kruskal-Wallis test. The p-value is 0.000, which is lower than the level of significance (0.05), indicating that a difference exists between at least two population medians. The next step is therefore to employ the two-sample Mann-Whitney test to investigate which pairs are significant and rank them. The results are shown in Table .
Table 6. Ranking order of the five dimensions and their descriptive statistics
From the Mann-Whitney test, the five SERVQUAL dimensions can be statistically ranked and are then divided into three groups. It can be inferred that the importance of dimensions in the same group is not significantly different (the population medians are equal). With a relative weight of one-third, “reliability” is the most important aspect, contributing the most to customers satisfaction. “Empathy” and “assurance” are ranked second, with relative weighted averages of around 0.185 each, and they are followed closely by the “tangible” and “responsiveness” dimensions.
The relative weight assigned by each respondent was then used to estimate their overall satisfaction using the SAW method as described in EquationEquation (1)(1)
(1) . The average of all the SAW results (average
) is equal to 4.26, which indicates a high level of customer satisfaction. The company can start to monitor their overall customer satisfaction towards this composite score.
To validate the accuracy of the calculated overall satisfaction, the SAW results were cross compared to the satisfaction scores rated arbitrarily by each customer using the correlation analysis. The correlation coefficient, obtained from Minitab software, is 0.608 (p-value = 0.000), indicating an acceptable level of the linear relationship between these two variables. This affirms that the customers’ perception ratings and the weights calculated from the PA method, together with the SAW method for data aggregation, enable LSPs to estimate the overall satisfaction score of their customers, and the obtained result is adequate. In this study, the coefficient 0.608 is considered acceptable even though it is not very close to 1. This is because it may be difficult for continuous variables (data from SAW) to significantly correlate with a group of ordinal variables in the form of a 1–5 rating scale, since the latter is based on the tentative and subjective nature of the respondents’ feeling.
The estimated weights of the five dimensions, denoted by {WTangible, WResponsiveness, WReliability, WAssurance, WEmpathy} ~ {0.1585, 0.1585, 0.313, 0.185, 0.185}, reflect the contribution of each dimension to overall customer satisfaction. The results show that customers of the beverage transportation service value “reliability” the most, indicating that punctuality, accuracy, and quality of products (e.g., flaws and damage) are critical points to enhance competitive advantage. This is also consistent with the information gained from the quadrant analysis (Figure ) which shows that most items in “reliability” (3.1, 3.2, 3.3, 3.6) fall into Quadrants 1 and 2, signifying the high level of customers’ expectations. Clearly, these four items are all related to the punctuality, accuracy, and quality of the service company.
In terms of the second-ranked group—“assurance” and “empathy”—some items in “assurance” (4.1 and 4.2) also fall into the top six highly expected items. These two items relate to the staff’s proper manner and eloquence. Surprisingly, all items in “empathy” are in Quadrants 3 and 4, signifying the low level of customers’ expectations (particularly items 5.2 and 5.3, which are the bottom two items), while Table shows that they are moderately important for the customers (in the 2nd position). This contrasting information is explained by the fact that these two kinds of information (the level of expectation and the importance weightings) were rated in different contexts. The customers were asked to rate, for each item, the expectation levels they had of the case study company. They were also asked to refer to general cases when thinking about the importance of each dimension. This means that the “empathy” items are quite important for the customers, but they did not expect much from the case study company. The customers may recognise that these practices are not commonly seen in the Thai LSP market, so that they did not expect to see those when buying the services. If this hypothesis is true, it might be an opportunity for the Thai LSPs to enhance their competitive advantage by ensuring “empathy” is added to their business strategies. Offering a service that exceeds customer expectations is a way of developing an emotional connection with customers and offers an opportunity to surprise and delight them, which eventually leads to customer loyalty (Kandampully, Citation1998).
7. Conclusion
This paper firstly outlined the questionnaire development process for assessing the quality of logistics service in the beverage industry. The questionnaire consists of several assessment items that relate to the accepted dimensions of SERVQUAL (tangible, responsiveness, reliability, assurance, and empathy). The quality of the questionnaire was then empirically checked. Firstly, through a literature review, relevant service items were identified. The items were then adjusted to the beverage transportation industry and placed into the five dimensions. Secondly, validity testing was conducted, starting with interviews of three experts to ensure that the items were appropriate and understandable for customers. The IOC method was then employed using six experts who quantitatively evaluated the content validity for each item. Lastly, reliability testing was conducted to check for the internal consistency of the questionnaire items within each dimension. Thirty copies of the questionnaire were sent to the case study company’s customers, after which the results were assessed using the Cronbach’s alpha values. Using these steps, the screening process of the assessment items was shown to be suitable for the assessment of the service quality of the beverage transportation industry. Any companies in this industry that desire to evaluate and monitor customer satisfaction can adopt the proposed instrument. The applicability of the proposed instrument was demonstrated in the case study, which assessed a company that stores and delivers beverage products in Thailand. This paper presented an analysis of a company’s service quality through gap analysis, quadrant analysis, PA and SAW methods. The assessment results were presented to the management team of the company, and the results are accepted as valid and reliable because the survey’s assessment of the company’s strengths and weaknesses can be explained using objective evidence or the manager’s explanations. However, the assessment results are considered not significant for this study, since the main aim is to demonstrate the application of the proposed instrument and the analysis, rather than to declare the “actual” service level of the case study company.
This paper also focused on the importance levels of the five dimensions of SERVQUAL. The survey indicated that “reliability” is the most important aspect of customer satisfaction for the beverage transportation industry. Its averaged weight is approximately twice that of the other dimensions. Reliability mainly relates to punctuality, accuracy, and quality of the service company. This study also shows that the expectation rating is not always consistent with the perception of importance, since customers may value one aspect but do not expect it from the service company they are using. The items that were only slightly expected by the customers but rated quite important are ones that service providers can use to enhance their competitive advantage and develop customer loyalty, offering a service that goes beyond customer expectations. Therefore, a survey of customers’ expectation on its own may not be an effective way to affirm the importance or the contribution of each aspect to their overall satisfaction. This concept also applies to the prioritisation of the SERVQUAL dimensions. This paper offers practical advice to the management of LSPs that provide beverage transportation services to monitor their quality performance and reconsider their service strategies, as well as to initiate improvement plans according to the ranking of importance of the service quality dimensions. The weights might be integrated to some MCDM techniques to construct a composite index for performance assessment and analysis.
A limitation of this study may be its generalisability, since the data was collected only from customers of a single company. However, most of the respondents of this study receive goods from several LSPs. Therefore, their opinions on the importance of the five dimensions should accurately represent the opinions of the customers of the beverage transportation service.
Acknowledgements
The authors would like to thank Supply Chain and Logistics System Research Unit, Faculty of Engineering, Khon Kaen University, for providing the facilities to carry out this work.
Additional information
Funding
Notes on contributors
Punnatorn Mathong
Punnatorn Mathong is currently a master’s student in Industrial and Logistics Engineering Management at Khon Kaen University, Thailand.
Panitas Sureeyatanapas
Panitas Sureeyatanapas is an assistant professor in the Department of Industrial Engineering, Khon Kaen University, Thailand. In 2014, he completed his PhD in Decision Sciences from Manchester Business School, the University of Manchester, UK. His current research interests include multiple criteria decision analysis, quality management, green and sustainability initiatives in logistics and supply chain management.
Sirawadee Arunyanart
Sirawadee Arunyanart is a lecturer in the Department of Industrial Engineering, Khon Kaen University, Thailand. She completed her doctoral degree in Management Engineering (Logistics Engineering) from Waseda University, Japan. Her current research interests include supply chain and logistics optimisation and decision analysis.
Thanawath Niyamosoth
Thanawath Niyamosoth is an assistant professor in the Department of Industrial Engineering, Khon Kaen University, Thailand. He obtained his PhD in Operational Research and Cybernetics from University of Chinese Academy of Sciences, China. His research interests include optimisation model in maintenance and inventory control.
References
- Babakus, E., & Boller, G. W. (1992). An empirical assessment of the SERVQUAL scale. Journal of Business Research, 24(3), 253–17. https://doi.org/10.1016/0148-2963(92)90022-4
- Baki, B., Basfirinci, C. S., Ar, I. M., & Ar, I. M. (2009). An application of integrating SERVQUAL and Kano’s model into QFD for logistics services. Asia Pacific Journal of Marketing and Logistics, 21(1), 106–126. https://doi.org/10.1108/13555850910926272
- Banomyong, R., & Supatn, N. (2011). Selecting logistics providers in Thailand: A shippers’ perspective. European Journal of Marketing, 45(3), 419–437. https://doi.org/10.1108/03090561111107258
- Bootdachi, J., & Khaochaimaha, S. (2015). The impact from free flow of 11 logistics services provider to overall equipment efficiency in beverage manufacturing firm in Thailand. International Business Management, 9, 483–491.
- Bottomley, P. A., Doyle, J. R., & Green, R. H. (2000). Testing the reliability of weight elicitation methods: Direct rating versus point allocation. Journal of Marketing Research, 37(4), 508–513. https://doi.org/10.1509/jmkr.37.4.508.18794
- Canciglieri Junior, O., Zierhut, R. T., Mattioda, R. A., Estorilio, C. C. A., Steiner, M. T. A., & Neto, P. J. S. (2019). Model for the diagnosis of quality in service processes: A case study applied to a private higher education institution. Cogent Engineering, 6(1), 1702856. https://doi.org/10.1080/23311916.2019.1702856
- Gajewska, T., & Grigoroudis, E. (2015, May 20–22). Importance of logistics services attributes influencing customer satisfaction. The 4th IEEE International Conference on Advanced logistics and Transport.
- Goyal, P., Rahman, Z., & Kazmi, A. A. (2013). Corporate sustainability performance and firm performance research: Literature review and future research agenda. Management Decision, 51(2), 361–379. https://doi.org/10.1108/00251741311301867
- Hartono, M., Santoso, A., & Prayogo, D. N. (2017). How Kansei Engineering, Kano and QFD can improve logistics services. International Journal of Technology, 8(6), 1070–1081. https://doi.org/10.14716/ijtech.v8i6.689
- Kadłubek, M., & Grabara, J. (2015). Customers’ expectations and experiences within chosen aspects of logistic customer service quality. International Journal for Quality Research, 9(2), 265–278. http://www.ijqr.net/paper.php?id=347
- Kahnali, R. A., & Esmaeili, A. (2015). An integration of SERVQUAL dimensions and logistics service quality indicators (a case study). International Journal of Services and Operations Management, 21(3), 289–309. https://doi.org/10.1504/IJSOM.2015.069650
- Kandampully, J. (1998). Service quality to service loyalty: A relationship which goes beyond customer services. Total Quality Management, 9(6), 431–443. https://doi.org/10.1080/0954412988370
- Kilibarda, M., Nikolicic, S., & Andrejic, M. (2016). Measurement of logistics service quality in freight forwarding companies: A case study of the Serbian market. The International Journal of Logistics Management, 27(3), 770–794. https://doi.org/10.1108/IJLM-04-2014-0063
- Limbourg, S., Giang, H. T. Q., & Cools, M. (2016). Logistics service quality: The case of Da Nang city. Procedia Engineering, 142, 124–130. https://doi.org/10.1016/j.proeng.2016.02.022
- Neo, H.-Y., Xie, M., & Tsui, K.-L. (2004). Service quality analysis: Case study of a 3PL company. International Journal of Logistics Systems and Management, 1(1), 64–80. https://doi.org/10.1504/IJLSM.2004.005539
- Parasuraman, A., Zeithaml, V., & Berry, L. (1994). Alternative scales for measuring service quality: A comparative assessment based on psychometric and diagnostic criteria. Journal of Retailing, 70(3), 201–230. https://doi.org/10.1016/0022-4359(94)90033-7
- Parasuraman, A., Zeithaml, V. A., & Berry, L. L. (1988). SERVQUAL: A multiple item scale for measuring consumer perceptions of service quality. Journal of Retailing, 64(1), 12–40.
- Ramanathan, R., & Karpuzcu, H. (2011). Comparing perceived and expected service using an AHP model: An application to measure service quality of a company engaged in pharmaceutical distribution. OPSEARCH, 48(2), 136–152. https://doi.org/10.1007/s12597-010-0022-1
- Silva, J. T. M., Teixeira, L. A. A., Cruz, K. D. C. T. S., & Tadeu, H. F. B. (2014). Logistics service quality measurement of a beverage distributor company in the state of Minas Gerais – Brazil. International Journal of Logistics Systems and Management, 19(3), 372–390. https://doi.org/10.1504/IJLSM.2014.065497
- Sohn, J.-I., Woo, S.-H., & Kim, T.-W. (2017). Assessment of logistics service quality using the Kano model in a logistics-triadic relationship. The International Journal of Logistics Management, 28(2), 680–698. https://doi.org/10.1108/IJLM-09-2015-0172
- Turner, R., & Carlson, L. A. (2003). Indexes of item-objective congruence for multidimensional items. International Journal of Testing, 3(2), 163–171. https://doi.org/10.1207/S15327574IJT0302_5
- Whitley, R. (1992). Business systems in East Asia: Firms, markets and societies. Sage.
- Yongpisanphob, W. (2019). Beverage industry. Thailand Industry Outlook 2019-21, 1–14. https://www.google.com/url?sa=t&rct=j&q=&esrc=s&source=web&cd=&ved=2ahUKEwjn9fjk05nqAhXhzDgGHfM3CW8QFjAAegQIBRAB&url=https%3A%2F%2Fwww.krungsri.com%2Fbank%2Fgetmedia%2F94a68184-ab67-4b62-9f28-caf1ee688796%2FIO_Beverage_190503_EN_EX.aspx&usg=AOvVaw0N1uekRwJAP7Gy-7k5Z_w-