
 ?Mathematical formulae have been encoded as MathML and are displayed in this HTML version using MathJax in order to improve their display. Uncheck the box to turn MathJax off. This feature requires Javascript. Click on a formula to zoom.
Abstract
As part of research efforts to investigate the contribution of various anthropogenic activities to local atmospheric pollution load across Nigeria, the study investigated emission of air pollutants from the combustion processes in Lagos mega city. Solid wastes, consumption of fuel wood, and petroleum products were identified as major materials being combusted in Lagos and these materials were quantified based on the information in literature. Annual emissions from the combustion of the quantified materials were estimated using emission factor approach. The total estimated annual contribution of anthropogenic combustion processes to atmospheric loading of PM10, CO, SO2, NOx and VOC were 188.49, 5920.97, 11.24, 348.88 and 4.14 kt/annum, respectively. Emissions from the combustion of solid waste/biomass were identified as a major source of criteria air pollutants in the city because, about 67.5% and 82% of the estimated CO and PM10 emissions, respectively, were generated from the combustion of solid waste/biomass. Also, 81%, 57% and 32% of NOx, SO2 and CO emissions respectively were found to have emanated from combustion of kerosene. These elevated emission levels can be said to have potential impacts on ambient air quality of the study area. The study concluded that immediate mitigating action to reduce release of pollutants from combustion processes should be put in place.
PUBLIC INTEREST STATEMENT
The study investigated the emission inventory of Lagos city from various emission sources over a period of Ten (10) years. The emission sources were road transport emission, air transport, combustion of solid waste, fuelwood burning, domestic kerosene, and other combustion processes. The pollutants considered in the study included carbon monoxide, sulfur dioxide, particulate matter, oxide of nitrogen, and volatile organic compounds. The study showed that human activities are the major sources of air pollutants which pose major threats on the air quality of Lagos mega city.
1. Introduction
Air pollution is increasingly becoming a global challenge due to the release of air emissions from human activities (Motesaddi et al., Citation2017; Von Schneidemesser et al., Citation2019). Due to human activities and ineffective environmental policy, urban air pollution has been on the increase (Komolafe et al., Citation2014). Quality Air is of outmost important to humans, plants, animals, and materials. On an average, a human being needs 12 kg/day of quality air compared to his food consumption which is 12–15 time lesser (Garg et al., Citation2006). However, disturbance or contamination of the component of ambient air as a results of human activities may cause great damage or may put the life of living things on earth in danger (Wang et al., Citation2014). In 2005, the World Health Organization (WHO) recorded that more people had been killed by air pollution as compared to ailments such as AIDS, tuberculosis, breast cancer, or malaria. It has been shown that most of the air pollution could be traced to combustion processes (Frederica, Citation2018) which could either be indoor (e.g. for cooking) or outdoor. The common air pollutants in the atmosphere include: oxide of sulfur (SOx); oxides of nitrogen (NOx), carbon monoxide (CO), and volatile organic compounds (VOCs) (Komolafe et al., Citation2014).
The degree of atmospheric pollution varies from region to region and from cities to cities (Sonibare et al., Citation2010). In Nigeria, due to population density coupled with intense industrial and commercial activity, the air pollution of Lagos city is of particular interest (Odekanle et al., Citation2016). Previous studies undertaken in Lagos have reported the significant impact of pollutants on the local air quality when compared with WHO standards (Efe, Citation2008; Odekanle et al., Citation2017). There are several sources of air pollutant in Lagos mega city. One of such sources is road transportation. The extent of the significance of road transport as a source of specific pollutants at any point in time depends on the level of traffic and proximity of other sources of specific pollutants as well as meteorological parameters (Odekanle et al., Citation2016, Citation2017; Onat & Stakeeva, Citation2013). A study conducted by the Lagos Metropolitan Transport Management Authority, Lagos Metropolitan Area Transport Authority [LAMATA] (Citation2002) on air quality revealed that vehicular activities contribute about 43% to the deteriorated air quality in Lagos. Another major source of air pollutant emission in Lagos is municipal solid waste combustion. In Lagos, it is a common practice to burn municipal solid waste (MSW) instead of landfilling. While solid waste combustion is advantageous in terms of large volume of waste treatment, it thus leads to emission of compounds that are of environmental concern. One of the major problems in urban centers like Lagos is the increase in quantity of waste generated (Adeniran et al., Citation2017; Ayantoyinbo & Adepoju, Citation2018). Of equal concern is the poor and inefficient management of municipal waste to which government appears incapacitated. Another form of solid wastes generated is saw dust. These are openly burnt without regard for sound environmental management (Igben, Citation2019; Owoyemi et al., Citation2016). Sawmills of various sizes are scattered all over the shores of Lagos. Hence, one of the greatest environmental problems facing the city today is how to properly dispose these wastes being generated daily by the ever increasing activities of saw mill operators (Igben, Citation2019; Owoyemi et al., Citation2016). In the absence of proper disposal methods, these wastes are burnt in the open air along the bank of lagoon of Lagos (Okedere et al., Citation2017). As the demand for wood and its product increase, the volume of wastes being generated by sawmill industries in Lagos is expected to increase and thus, higher emission from the combustion of the wastes. There have been reports on both environmental and health effects of emission from combustion processes. Frederica has opined that fossil-fuel combustion by-products are the world’s most significant threats to children’s health and future; and are major contributors to global inequality and environmental injustice. Similarly, combustion of fossil fuel in developed nations and biomass burning in developing nations have been adjudged to account for most of the global air pollution problem, emitting about 85% of airborne respirable particulate matter, SO2 and NOX the environment (International Energy Agency [IEA], Citation2016). Several other health-related issues have been traced to emissions from various combustion processes (Agarwal & Yamamoto, Citation2015; World Health Organization [WHO], Citation2016). Despite all these adverse environmental and health effects, various combustion operations emanating from different sources ranging from industrial processes to household cooking continue to be on the increase in Lagos, hence the need for the assessment of emission from the combustion processes.
As part of research efforts to investigate the contribution of various anthropogenic activities to local atmospheric pollution load across Nigeria, the study aimed at investigating air pollutants from the emission of combustion processes in Lagos mega city. Several reported information on air pollution within Lagos metropolis exist (Komolafe et al., Citation2014; Odekanle et al., Citation2016, Citation2017); however, dearth of information on the magnitude of emission from combustion process from domestic, vehicular and industrial activities as well as the effect of the emission on air quality was the driving force behind this study. The findings seek to provide information that could be used to implement, monitor and evaluate environmental management policies to mitigate air pollution, protect health of human and guarantee safe environment. In this study, various solid fuels generated and liquid fuel consumed were quantified from the previously reported information; and emissions were subsequently estimated from various fuel sources using emission factor approach.
2. Methodology of the research
2.1. Study area
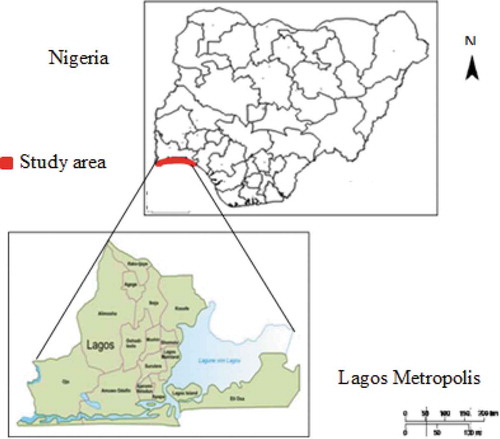
Lagos (Figure ) is located within latitude 6° 23ʹ N and 6° 41ʹ N and longitude 2° 42ʹ E and 3° 42ʹE. Lagos is the center of commerce in Nigeria having 75% of the country’s industries. Due to rapid urbanization and industrial growth rate, the city has become one of the most densely populated cities in Africa with a population of about 9.3 million (National Population Commission [NPC], Citation2006). Nigeria being a developing nation, the annual population growth rate was estimated to be 3%, whereas Lagos a state within the country stands at a stunning growth rate of 8% which is likely to accelerate as years go by (Awoyemi et al., Citation2013; Oramah, Citation2006). Also the city is a commercial network to other West Africa countries because of the multinational companies in the city and its leading regional port and manufacturing center. (Atubi, Citation2010). The city has a tropical climate with an average relative humidity of 79%. Mean monthly temperature ranges from 23 to 32°C. Being located in a coastal area and influenced by strong sea-based disturbances, Lagos experiences an average wind speed of 4.3 km/h (Komolafe et al., Citation2014). As with the majority of cities, road transport is thought to be the most significant source of anthropogenic emissions. Obsolete technologies and poor emission control strategies lead to substantial uncertainties in emission estimates calculated from vehicle number density statistics.
Figure 1. Map of the study area (source: Somuyiwa & Adebayo, Citation2009).
The unreliable electrical supply in Lagos has led to an increased reliance on small-scale diesel powered generators and these potentially present a significant source of emissions in Lagos.
2.2. Estimation of pollutant emission
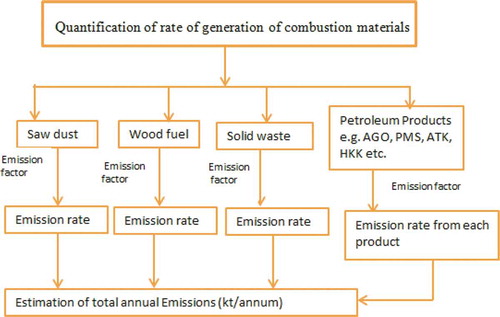
The amount of air pollutant emissions from combustion activities in Lagos, Nigeria was determined using the emission factor approach. Following the steps in Figure , rates of generation saw dust, wood fuel, solid waste, and consumption of petroleum products were quantified based on available data in literature. Using Equationequation (1)(1)
(1) , emission rates of air pollutants (NOX, CO, Sox, VOC, and Particulate matter (PM10)) from the combustion of the combustible materials were calculated (Sonibare et al., Citation2010, Citation2007).
Figure 2. Flow chart of research methodology.
Where:
E = emissions rate of pollutant (g/s)
A = activity rate (m3/s)
EF = emission factor of pollutant (g/m3)
3. Results and discussion
Rates of generation and consumption of combustible materials in Lagos state for ten years are considered in this study. Also, consumption rates of petroleum products are obtained from NNPC annual statistical bulletin.
3.1. Quantification of solid waste generated
The quantities of solid waste (Kg/capita/annum) generated for this study were estimated from previous studies (Nigerian Environmental Study/Action Team [NEST], Citation2001; Achankeng, Citation2003; Kofoworola, Citation2007; Sha’Ato et al., Citation2006; Ogwueleka, Citation2009; Oresanya, Citation2013). In 2001, NEST reported that 20 kg/capita/annum of solid waste were generated Nigeria while Achankeng estimate was 0.3 kg/capita/day in the year 2003. However, Kofoworola (Citation2007) reported 1.1 Kg/capital/day, while Sha’Ato et al. (Citation2006) reported 0.54 kg/capital/day for central Nigeria. Ogwueleka (Citation2009) and Oresanya (Citation2013) reported that 0.63 kg/capital/day and 0.65 kg/cap/day of solid waste were generated in Lagos. The obtained rates were considered for the generation of solid waste from 2007 to 2016 (based on available data). The estimated emissions from the solid waste were based on 100% combustible due to the unavailability of amount of the combustible component in the solid waste. Shown in Table are the predicted amount air emissions from open burning solid waste (Environmental Protection Agency [EPA], Citation1995).
Table 1. Solid waste generated at the study area in kt/annum
3.2. Quantification of saw dust generated
Collection of forestry statistics especially on wood products is not well organized or systematized. Efforts at collecting information on wood products have been ad-hoc in Nigeria (Food and Agriculture Organization of the United Nations [FAO], Citation2000). By expectation the annual sawn wood consumption rate in Nigeria of 8.9% to grow from its initial level of 2,080,000 m3 round wood equivalent in 1975 to 11,476,000 m3 in 1995 (FAO, Citation2009).
The same data was used to calculate sawn wood consumption up to 2016. RMRDC (Citation2004) reported that there are currently 1,325 sawmills in Nigeria with 270 located in the swamp forest zones of Lagos and Rivers States while 884 sawmills are located in other rainforest zones in Nigeria. Majorly open burning sawdust generated in Lagos takes place around the sawmills. The quantities of saw dust generated in Lagos state over ten consecutive years are presented in Table .
Table 2. Sawdust generation in Lagos during considered years
3.3. Consumption of fuel by road transportation
Presented in Table is the consumption of some petroleum products between the year 2008 and 2016. The use of emission factor for estimating the emissions from vehicular activities based on the fuel consumed is very important. According to (Sonibare et al., Citation2007), 70% of the petroleum products in the country were consumed by the transport sector. Some of the vehicles considered are: cars, bus (minibus and omnibus), trucks, and motor cycle. Fuel-based emission factors were from the CORINAIR and Asian nation (Sonibare & Jimoda, Citation2009; Yli-Tuomia et al., Citation2005)
Table 3. Consumption of some petroleum products in liters
3.4. Consumption of fuel by air transport
For this study, the worst case scenario was considered due to limited data availability. The fuel consumed by the aviation sector in Lagos (Table ) and emission factor reported by EPA (Citation2018) were used as inputs parameters.
Table 4. Consumption of fuel by aircraft and wood fuel consumption
3.5. Consumption of wood fuel
Combining Nigeria’s daily household energy demand of about 263 kg of coal equivalent per annum (Nnaji et al., Citation2012) with the utilization of about 91% for cooking (Nwofe, Citation2013), the annual cooking energy consumption in the country per household would be about 315 kg of fuelwood. With the average household in Lagos of four (Lagos State Bureau of Statistics [LSBS], Citation2017) and total population, fuelwood consumption for cooking for the period under consideration was computed (Table ). The estimated consumed fuelwoods were combined with the (EPA, Citation1995) emission factor to calculate the likely quantity of criteria air pollutants emitted from combustion of the fuelwoods.
3.6. Annual consumption of household kerosene
The quantities of kerosene consumed for the years considered were combined with emission factors (EPA, Citation2018; IPCC, Citation1996) to determine the likely emission of air pollutants emitted during domestic usage of kerosene.
3.7. Emission from various combustion processes
Emissions of air pollutants from solid waste combustion in Lagos (2007–2016) are presented in Table . From NEST (Citation2001) basis, NOx emission rate was in the range of 0.60–1.61 kton/annum while that of Achankeng (Citation2003), Kofoworola (Citation2007), Sha’Ato et al. (Citation2006), Ogwueleka (Citation2009), and Oresanya (Citation2013) were 3.30–6.60, 12.09–26.12, 5.94–11.90, and 6.93–13.85, 7.15–14.29 kton/annum, respectively.
Table 5. Emission air pollutant from solid waste combustion in Lagos (2007–2016)
From the above, SO2 emission rates were in the range of 0.10–0.21, 0.56–1.10, 2.02–4.35, 1.16–2.31, and 1.19–2.38 kton/annum, respectively. Similarly, the average CO emission from the period under investigation was about 12.22, 66.92, 248.10, 120.47, 140.49, and 144.99 while the average PM10 was 2.33, 12.75, 47.25, 22.95, 26.77, and 27.62 kton/annum respectively. Population, waste generated per annum together with emission factor (EPA, Citation1995) are important factor in calculating emission rate. There was an increase in air pollutant emission rate this is attributed to increase in population and increase in solid waste generated. It was also observed that 2016 produced the highest emission of pollutant. Air pollutants emission rate is directly proportional to the quantity of waste involved in combustion. For these to be reduced, there is a need for better solid waste management in the city. Emission criteria from combustion of sawdust is shown in (Table ) The estimated annual sawdust generation from available data (FAO, Citation2000) gave an increase from the year 2007 through 2016 with a range of 40172593–86532805 ton/annum. From these, combustion processes generated an average criteria air pollutant of 30.37, 3948.32, 3.04, and 30.37 for PM10, CO, SO2, and NOx respectively. There was an increase from 2007 to 2016. This is due to increase in saw mill industry in the state, which leads to increase in saw dust generated. Combustion of saw dust generates a lot of pollutant that can be harmful to human health, therefore sound waste disposal strategy should be implemented. Emission factor from EPA (Citation1995).
Table 6. Criteria pollutant rate from sawdust combustion in Lagos (kt/annum)
Criteria emission from vehicular activities using Asian emission factor is summarized in Figures. Three categories of vehicles were considered; personal cars, buses and trucks using Asian emission factor. As presented in Figure ,b), emission rates of CO and NOx for gasoline personal cars ranged from 2000 to 43230 ton, 755–1209 ton, respectively, while emission rates of CO and NOx from AGO powered buses ranges from 162.54 to 5557.06 tons and 160.10 to 17378 tons, respectively.
Figure 3. CO and NOx from (a) gasoline personal cars and (b) AGO combustion in buses using Asian emission factor.
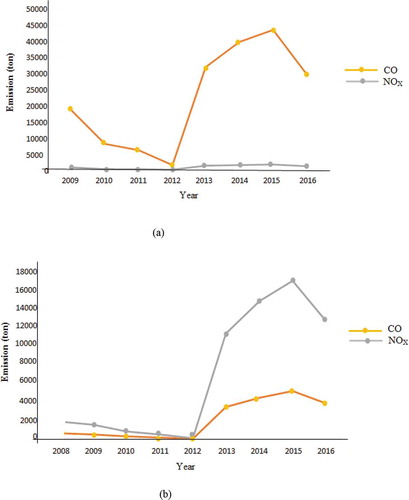
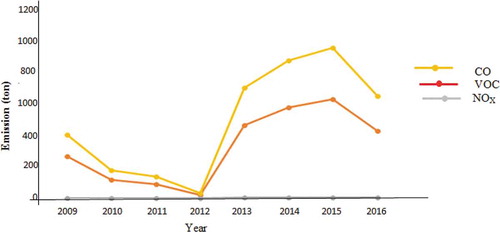
Also emission of CO and NOx from automotive gas fuel (AGO) powered trucks ranged from 160 to 4010 ton/annum and 163 to 15,410 ton/annum respectively, as shown in Figure . Lowest emission rates of both CO and NOx were observed in 2012, while highest emission rates were recorded in 2015. This could be attributed to the lowest and highest fuel consumption in 2012 and 2015, respectively as reported by Nigerian National Petroleum Corporation (NNPC, Citation2004). Figure also revealed that total annual emissions from vehicular activities are a function of the amount of fuel consumed. With emission factor from CORINAIR (1990), emission from road vehicles changed significantly. Predicted CO from gasoline-fueled cars was in the range of 594–951 ton/annum and NOx emission for gasoline-fueled cars ranged from 28 to 45 ton/annum. Also VOC recorded a ranged of 69–110 ton/annum. (Figure ). CO emission from gasoline-fueled motor cycle range from 25 to 1000 ton/annum. NOx was in the range of 2–3 ton/annum and VOC was in the range of 26–6516 ton/annum (Figure ).
Figure 4. CO and NOx from AGO combustion in trucks using Asian emission factor.
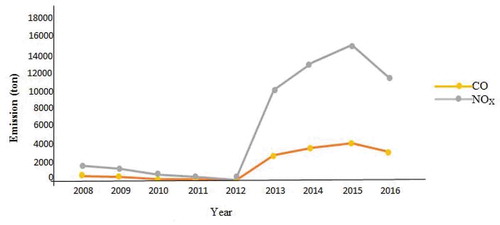
Figure 5. CO, NOx and VOCs from gasoline consumption in passenger car using Corinair emission factor.
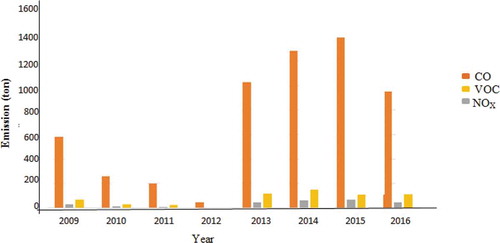
Figure 6. VOCs, NOx, and CO from gasoline combustion in motor cycle.
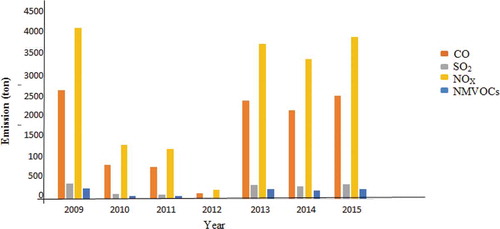
Also emission from combustion processes in transportation activities are from air transportation (Figure ). There are two methods of calculating emission from air transportation (IPCC, Citation1996). The Tier 1 (the use of fuel only) and the Tier 2 (number of LTO). Due too poor documentation on the number of landing and take-off in Lagos, the Tier 1 method was used, which is also the simplest. CO emission ranged from 2609 to 2478 ton/annum, NOx ranged from 4100 to 3894 ton/annum, SO2 ranged from 372 to 354 ton/annum, and NMVOCs range from 260 to 247 ton/annum. It was observed that 2012 has the lowest emission rate. This is due to low consumption of aviation fuel compared to other years. Indoor air pollution is also a major source of pollution. Respiratory symptoms and impaired lung functions among women have been traced to the indoor combustion of biomass (Mulega & Siziya, Citation2019). It is therefore important to study emissions of criteria pollutants from this source. Refined petroleum products would have been more attractive to the city inhabitants because of their convenience in use when compared to biomass. However, cost and their regular shortage from the market always call for alternatives. Wood fuel is a major alternative.
Figure 7. Emission level of CO, SO2, NOx, and NMVOCs from combustion of aviation fuel.
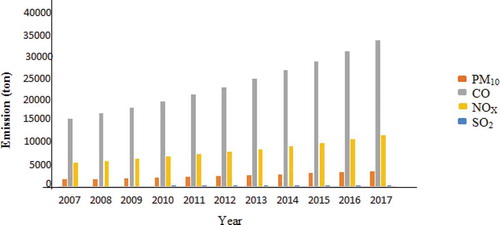
Combustion of wood as cooking fuel is also a major source of criteria air pollutant. In fire places in Lagos, for the period under investigation, the calculated criteria air pollutant were: CO, 15582–33640 ton/annum; SO2, 158–341 ton/annum; NOx, 5457–11782 ton/annum; PM10, 1661–3586 ton/annum (Figure ). There was an increase in emission from 2007 through 2016. These observations call for a need for a continuous monitoring of emission from combustion processes in cooking activities in Lagos. Aside from population increase, it can also be attributed to the level of poverty. Emission of pollutants from the combustion of kerosene in cooking (Table ) showed the following values. PM, SO2, CO, and NOx were 6574–90670 ton/annum, 1264–17436 ton/annum, 373717–5154282 ton/annum, and 55627–767213 ton/annum, respectively.
Table 7. Criteria emission from kerosene in cooking
The total estimated annual contribution of anthropogenic combustion processes to atmospheric loading of PM10, CO, SO2, NOx, and VOC are 188.49, 5920.97, 11.24, 348.88, and 4.14 kt/annum, respectively. Emissions from the combustion of solid waste/biomass were identified major source of criteria air pollutants in the city because of combustion of solid wastes/biomass generated about 67.5% and 82% of the estimated CO and PM10, respectively.
Figure 8. Criteria air pollutants from wood fuel combustion in fireplaces in Lagos.
This could be attributed to large quantity of solid fuel/biomass (saw dust, wood, solid waste, etc.) being generated in the city. Another identified major source of CO emission was combustion of kerosene, accounting for about 32% of the total CO emission. In addition, considerable portion of the estimated VOC emission (57%) emanated from gasoline-fueled buses. The highest emissions of NOx and SO2, coupled with considerable amount of CO—all from the kerosene combustion which were 81%, 57%, and 32%, respectively raise some great concerns considering the potential impacts of these emissions on indoor air quality. The emission values recorded in this study were higher than the submission from similar previous studies (Okedere et al., Citation2017; Sonibare & Jimoda, Citation2009). The elevated emissions of the pollutants can be as a result of the combustion of waste as a waste disposal option, more dependence on wood as a source of fuel and the use of fossil fuel. Higher emissions are expected within the city in the future especially if mitigating measures are not put in place and thus will have adverse effects on human health as well as water, soil, and vegetation of the city.
4. Conclusion
This study investigated contribution of air pollutants from the emission of combustion processes in Lagos mega city to local atmospheric pollution load using emission factor approach. The estimated annual PM10, CO, SO2, NOx, and VOC loadings were 188.49, 5920.97, 11.24, 348.88, and 4.14 kt/annum. Combustion of solid waste was identified as a major source of emission within the city. Considering huge “mountain” of solid waste being generated in this region, it could be said that waste burning/combustion may not be a sustainable way of waste management strategy because of the release of high level of air pollutants that accompanies the process. Also the highest NOx and SO2 emission was found to have emanated from kerosene combustion, and this poses a great threat to indoor air quality. These findings have important policy implications for developing countries such as Nigeria where little attention is paid to the impacts of anthropogenic emission. It is recommended that urgent action from legislative authorities to mitigate release of pollutants from combustion processes should be taken. Also since this study did not consider projected estimate of the emission from combustion process, based on the findings of the study, next ten years emission estimate is advocated in order to enhance proactiveness in terms of air pollution control planning and policy making.
List of acronyms
| ATK | = | Aviation Turbine Kerosene |
| AGO | = | Automobile Gas Oil |
| HHK | = | Household Kerosene |
| NMVOC | = | Nonmethane Volatile Organic Compounds |
| NNPC | = | Nigerian National Petroleum Corporation |
| PMS | = | Premium Motor Spirit |
| VOC | = | Volatile Organic Compounds |
| CO | = | Carbon Monoxide |
| NOx | = | Nitrous Oxide |
| SO2 | = | Sulfur Dioxide |
| PM | = | Particulate Matter |
| CORINAIR | = | Core Inventory of Air Emission |
| FAO | = | Food and Agriculture Organization |
Cover image
Source: Author.
Additional information
Funding
Notes on contributors
Bamidele Sunday Fakinle
Bamidele Sunday Fakinle is a Senior Lecturer at the Department of Chemical Engineering, he obtained his PhD at Obafemi Awolowo University, He is a consultant in Air Quality and life cycle analysis. He can be contacted at [email protected], [email protected]
Ebenezer Leke Odekanle
Ebenezer Leke Odekanle is a Lecturer at the First Technical University, Ibadan. His area of specialization is air pollution and air quality.
Abiodun Paul Olalekan
Abiodun Paul Olalekan had his Postgraduate study at University of Lagos. His area of specialization is in Environmental Engineering
Henry Egbonyi Ije
Henry Egbonyi Ije obtained a degree in Chemical Engineering at Landmark University, Omu-Aran Kwara State.
Daniel Olawale Oke
Daniel Olawale Oke studied at Obafemi Awolowo University, he is currently on his PhD degree at the same university.
Jacob Ademola Sonibare
Jacob Ademola Sonibare is a Professor of Chemical Engineering at Obafemi Awolowo University, Ile-Ife, Nigeria. His area of specialization is in air quality and life cycle analysis. He can be contacted at [email protected]
References
- Achankeng, E. (2003). Globalization, Urbanization and Municipal Solid Waste Management in Africa. African Studies Association of Australasia and the Pacific 2003 Conference
- Adeniran, A. E., Nubi, A. T., & Adelopo, A. O. (2017). Solid waste generation and characterization in the University of Lagos for a sustainable waste management. Waste Management, 67, 3–16. https://doi.org/10.1016/j.wasman.2017.05.002
- Agarwal, S., & Yamamoto, S. (2015). Effect of indoor air pollution from biomass and solid fuels combustion on symptoms of preclampsia/eclampsia in Indian women. Indoor Air, 25(3), 341–352. https://doi.org/10.1111/ina.12144
- Atubi, O. (2010, August). Road transport system management and traffic in Lagos, South Western Nigeria. An International Multi-Disciplinary Journal, Ethiopia, 4(4), 459–470. https://doi.org/10.4314/afrrev.v4i4.69243
- Awoyemi, O. K., Ita, A. E., Awotayo, G., Lawal, L., & Dienne, C. E. (2013). An evaluation of the Nature and workability of Various modes of transport in Lagos State, Nigeria. International Journal of Research in Social Sciences, 1(3), 8-17.
- Ayantoyinbo, B. B., & Adepoju, O. O. (2018). Analysis of solid waste management logistics and its attendant challenges in Lagos metropolis. Logistics, 2(2), 11. https://doi.org/10.3390/logistics2020011
- Chunshan, Z., Shijie, L., & IWang, S. (2018). Examining the impacts of urban form on air pollution in developing countries: A case study of China’s megacities. International Journal of Environmental Research and Public Health, 15(8), 1565. https://doi.org/10.3390/ijerph15081565
- Efe, S. I. (2008). Spatial distribution of particulate air pollution in Nigerian cities: Implications for human health. Journal of Environmental Health Research, 7(2), 1342–1354.
- Environmental Protection Agency (EPA). (1995). The EPA’s environmental justice strategy. Retrieved December 11, 2019, from https://www.epa.gov/environmentaljustice/epa-environmental-justice-strategy-1995
- Environmental Protection Agency (EPA). (2018). Emission factors for greenhouse gas inventories. Retrieved May 26, 2019, from https://www.epa.gov/sites/production/files/2018-03/documenets/emission-factor_mar_2018_0.pdf
- European Environmental Agency (EEA). (2010). Nitrogen oxides (NOx) emissions. Retrieved December 5, 2019, from https://www.eea.europa.eu/data-and-maps/indicator
- Ezzati, M., Vander Hoorn, S., Lopez, A. D., Danaei, G., Rodgers, A., Mathers, C. D., & Murray, C. J. (2006). Comparative quantification of mortality and burden of disease attributable to selected risk factors. In A. D. Lopez, C. D. Mathers, M. Ezzati, et al, (Eds.), Global burden of disease and risk factors (pp. 241–395). Oxford University Press.
- Food and Agriculture Organization of the United Nations (FAO). (2000). FRA 2000: On definitions of forest and forest change, working paper no. 33, forest resources assessment programme, FAO.
- Food and Agriculture Organization of the United Nations (FAO). (2009). Forestry products: Country, item, element and year statistics. FAOSTAT database, FAO, Rome. Retrieved January 28,2019, from http://faostat.fao.org/site/626/DesktopDefault.aspx?PageID=626#ancor
- Frederica, P. (2018). Pollution from fossil-fuel combustion is the leading environmental threat to global pediatric health and equity: Solutions exist. International Journal of Environmental Research and Public Health, 15(6), 16. https://doi.org/10.3390/ijerph15010016
- Garg, S. K., Garg, R., & Garg, R. (2006). Environmental science and geological studies Delhi, Khanna. Publishers Hyderabad India, 543
- Igben, J. I. (2019). Impact of sawmill industry on maritime and riparian environment along selected rivers in Delta State, Nigeria. Journal of Applied Sciences and Environmental Management, 23(3), 551–556. https://doi.org/10.4314/jasem.v23i3.27
- International Energy Agency (IEA). (2016). Special report energy and air pollution; international energy agency: Paris, France, 266
- IPCC. (1996). Guidelines for greenhouse gas inventories reference manual. Retrieved October 21, 2019, from https://www.ipcc-nggip.iges.or.jp/public/gl/guidelin/ch/ref3.pdf
- Kofoworola, O. F. (2007). Recovery and recycling practices in municipal solid waste management in Lagos, Nigeria. Waste Management, 27(9), 1139–1143. https://doi.org/10.1016/j.wasman.2006.05.006
- Komolafe, A. A., Adegboyega, S. A., Anifowose, A. Y. B., Akinluyi, F. O., & Awoniran, D. R. (2014). Air pollution and climate change in Lagos, Nigeria: Needs for proactive approaches to risk management and adaptation. American Journal of Environmental Sciences, 10(4), 412–423. https://doi.org/10.3844/ajessp.2014.412.423
- Lagos Metropolitan Area Transport Authority(LAMATA). (2002). Lagos Urban Transport Project. Integrated safeguard data sheet. LAMATA.
- Lagos State Bureau of Statistics (LSBS) (2017). Ministry of economic planning and budget. Retrieved April 12, 2019, from https://mepb.lagosstate.gov.ng/wp-content/uploads/sites/29/2017/01
- Motesaddi, S., Hashempour, Y., & Nowrouz, P. (2017). Characterizing of air pollution in Tehran: Comparison of two air quality indices. Civil Engineering Journal, 3(9), 749–758. https://doi.org/10.21859/cej-030911
- Mulega, D., & Siziya, S. (2019). Indoor air pollution related respiratory ill health, a sequel of biomass use. SciMedicine Journal, 1(1), 30-37. https://doi.org/10.28991/SciMedJ-2019-0101-5
- National Population Commission (NPC). (2006). 2006 population and housing census enumerator’s manual. Federal Republic of Nigeria, Abuja Nigeria.
- Ndukwe, N. A., Okiei, W. O., Alo, B. I., van Wyk, J. P., Mamabolo, T. M., & Igwe, C. C. (2012). Saccharification of delignified sawdust from 20different trees in the Lagos area of Nigeria. African Journal of Biotechnology, 11(100), 16625–16629. https://doi.org/10.5897/AJB12.1839
- Nigerian Environmental Study/Action Team (NEST). (2001). Climate action network international. Retrieved November 30, 2019, from http://www.nestinteractive.org
- Nigerian National Petroleum Commission (NNPC). (2004). Annual statistic bulletin. Retrieved January 28, 2019, from https://www.nnpcgroup.com/Public-Relations/Oils-and-Gas-Statistics/Pages/Annual-Statistic-Bulletin.aspx
- Nnaji, C. E., Uzoma, C. C., & Chukwu, J. O. (2012). Analysis of factors determining fuelwood use for cooking by rural households in Nsukka area of Enugu State, Nigeria. Continental Journal of Environmental Sciences, 6(2), 1–6.
- Nwofe, P. A. (2013). Comparative analysis of domestic energy use in Nigeria-a review. Continental Journal of Renewable Energy, 4(1), 7–17. https://doi.org/10.5707/cjre.2013.4.1.7.17
- Odekanle, E. L., Fakinle, B. S., Akeredolu, F. A., Sonibare, J. A., & Adesanmi, A. J. (2016). Personal exposures to particulate matter in various modes of transport in Lagos city, Nigeria. Cogent Environmental Science, 2(1), 1260857. https://doi.org/10.1080/23311843.2016.1260857
- Odekanle, E. L., Fakinle, B. S., Jimoda, L. A., Okedere, O. B., Akeredolu, F. A., & Sonibare, J. A. (2017). In-vehicle and pedestrian exposure to carbon monoxide and volatile organic compounds in a mega city. Urban Climate, 21, 173–182. https://doi.org/10.1016/j.uclim.2017.06.004
- Ogwueleka, T. C. (2009). Municipal solid waste characteristics and management in Nigeria. Iranian Journal of Environmental Health Science & Engineering, 6(3), 173–180.
- Okedere, O. B., Fakinle, B. S., Sonibare, J. A., Elehinafe, F. B., & Adesina, O. A. (2017). Particulate matter pollution from open burning of sawdust in southwest Nigeria. Cogent Environmental Science, 3(1), 1367112. https://doi.org/10.1080/23311843.2017.1367112
- Onat, B., & Stakeeva, B. (2013). Personal exposure of commuters in public transport to PM2.5 and fine particle counts. Atmospheric Pollution Research, 4(3), 329‐335. https://doi.org/10.5094/APR.2013.037
- Oramah, I. T. (2006). Effects of population growth in Nigeria. Journal of Applied Sciences, 6(6), 1332–1337. https://doi.org/10.3923/jas.2006.1332.1337
- Oresanya, O. (2013). Waste management in Lagos State: The journey so far. Retrieved November 20, 2019, from www.lawma.gov.ng/ …/2013/SWM%20in%20Lagos%20Journey%20
- Owoyemi, J. M., Zakariya, H. O., & Elegbede, I. O. (2016). Sustainable wood waste management in Nigeria. Environmental and Socio-economic Studies, 4(3), 1–9. https://doi.org/10.1515.environs-2016-0012.
- RMRDC. (2004). Multi-disciplinary task force report of the techno-economic survey on wood and wood products and furniture sector.(4th update).
- Sha’Ato, R., Aboho, S. Y., Oketunde, F. O., Eneji, I. S., Unazi, G., & Agwa, S. (2006). Survey of solid waste generation and composition in a rapidly growing urban area in central Nigeria. Waste Management, 27(3), 352–358. https://doi.org/10.1016/j.wasman.2006.02.008
- Somuyiwa, A., & Adebayo, I. T. (2009). Impact of Bus Rapid Transit (BRT) system on passengers’ satisfaction in Lagos metropolis, Nigeria. International Journal of Creativity and Technical Development, 1(1-3), 106–122.
- Sonibare, J. A., Adebiyi, F. M., Obanijesu, E. O., & Okelana, O. A. (2010). Air quality index pattern around petroleum production facilities. Management of Environmental Quality: An International Journal, 21(3), 379–392. https://doi.org/10.1108/14777831011036920
- Sonibare, J. A., Akeredolu, F. A., Obanijesu, E. O. O., & Adebiyi, F. M. (2007). Contribution of volatile organic compounds to Nigeria’s airshed by petroleum refineries. Petroleum Science and Technology, 25(4), 503–516. https://doi.org/10.1080/10916460500295397
- Sonibare, J. A., & Jimoda, L. A. (2009). Criteria air pollutants from some anthropogenic combustion processes in Lagos, Nigeria. Energy Sources, Part A: Recovery, Utilization, and Environmental Effects, 31(11), 923–935. https://doi.org/10.1080/15567030801904517
- Von Schneidemesser, E., Steinmar, K., Weatherhead, E. C., Bonn, B., Gerwig, H., & Quedenau, J. (2019). Air pollution at human scales in an urban environment: Impact of local environment and vehicles on particle number concentrations. Science of the Total Environment, 688, 691–700. https://doi.org/10.1016/j.scitotenv.2019.06.309
- Wang, S., Fang, C., Ma, H., Wang, Y., & Qin, J. (2014). Spatial differences and multi-mechanism of carbon footprint based on GWR model in provincial China. Journal of Geographical Sciences, 24(4), 612–630. https://doi.org/10.1007/s11442-014-1109-z
- WHO. (2005). Health effects of transport-related air pollution. World Health Organisation Regional Publications, WHO Regional Office for Europe, Copenhagen
- World Health Organization (WHO). (2016). Household air pollution and health. Retrieved November 2, 2019, from http://www.who. int/mediacentre/factsheets/fs292/en/
- Yli-Tuomia, T., Aarnioa, P., Pirjolab, L., Makela, T., Hillamod, R., & Jantunen, M. (2005). Emissions of fine particles, NOx, andCO from on-road vehicles in Finland. Atmospheric Environment, 39(35), 6696–6706. https://doi.org/10.1016/j.atmosenv.2005.07.049