
 ?Mathematical formulae have been encoded as MathML and are displayed in this HTML version using MathJax in order to improve their display. Uncheck the box to turn MathJax off. This feature requires Javascript. Click on a formula to zoom.
Abstract
The cement industry is one of the basic mineral-based industries that need strategic and operational sustainable development based on social, economic, and environmental indicators. The government’s major infrastructural projects together with the China Pakistan Economic Corridor (CPEC) is one of the factors that motivate numerous local producers to aggressively install new plants and increase the capacity of existing plants. According to all Pakistan Cement Manufacturers Association (APCMA), there are 24 cement plants within the country producing approximately 47 million tons of cement per annum and many are planning to increase their capacities. The aim of this paper is to identify and rank the economic key performance indicators (KPIs) that have a significant impact on the economic sustainability of cement industries in Pakistan, using Taguchi signal to noise ratio (S/N). This study is based on survey perceptions held by the experts in the cement industry. 14 KPIs identified through literature review are discussed. The ranking provides an insight into what the industry experts regard as important KPIs and how they can be used to achieve economic sustainability. Increase in market share, new export markets, and operating cost per ton of cement production are considered to be the most important KPIs whereas investment in community, carbon credits, and tax reliefs from the government are considered to be the least important KPIs for economic sustainability of cement industry. Based on the results, it has been determined that increase in market share (i.e. Ec-2) is the most important KPI for economic sustainability and is followed by new markets explored for exports (i.e. Ec-5) and operating cost per ton of cement production (i,e.Ec-7) having scores of 28.6693 and 28.4952 respectively. Similarly, the Ec-14 representing “value of tax credits and tax reliefs received from government” is ranked the lowest with a score of 10.441.
PUBLIC INTEREST STATEMENT
In recent decades, the rapid increase in the infrastructure development activities worldwide have forced the construction companies to bring down the construction costs to remain competitive in the current complex market. As a consequence a lot of pressure is being built up on the cement manufacturing organizations to find and adopt ways and means to bring down the cost of cement production without comprising the quality of the product. This study has focused mainly on the economic sustainability of cement manufacturers. To be sustainable, there is a need to identify the factors that has significant impact on the cost of production. 14 Key performance indicators (KPIs) are identified and are ranked by the academia and industry experts that will impact the economic sustainability. This will help the decision makers in the cement manufacturing organizations to focus on the achievement of these 14 KPIs and make informed decisions about their economic sustainability.
1. Introduction
In the future, society will need to depend on sustainable growth rather than destructive consumption (Damjan Krajnc & Glavic, Citation2003). Manufacturing firms are using Key Performance Indicators (KPIs) to control and follow-up their operations, and to drive improvements (Mats et al., Citation2016). According to Latin Dictionary and Grammar resources, the word sustainability is derived from Latin word Sustinere, meaning“ to support or to sustain”(Omair, Citation2017). According to Brundtland (WCED, Citation1987), a United Nations Commission defined sustainability as “Sustainable development is the development that meets the needs of the present without compromising the ability of future generations to meet their own needs” (Brundtland, Citation1987; Sarkar et al., Citation2018; Holden et al., Citation2014; Labuschagne & Brent, Citation2005; Yan Dong, Citation2017). According to the U.S. Department of commerce the sustainable manufacturing is “the creation of manufactured products that use processes that minimize negative environmental impacts, conserve energy and natural resources, are safe for employees, communities, and consumers and are economically sound” (Marja Paju et al., Citation2010; Omair et. al., Citation2017; Omair et. al., Citation2015; Omair et. al., Citation2014). But still, after years of research, scholars have not agreed upon a common definition of sustainable manufacturing, additionally, many authors are of the view that there is no common definition for sustainable manufacturing (Haapala et al., Citation2013; Moldavska & Welo, Citation2017; Wang et al., Citation2016). In these various definitions of sustainability, most of them agree that sustainability has three objectives. These objectives or goals are referred to as the three main pillars of sustainable development (Azapagic & Perdan, Citation2000; Khoshnava et al., Citation2018; Salman et. al., Citation2019; Omair et. al., Citation2019).
Industrial Sector of Pakistan plays a vital role in the actual nation’s economic development and its share in Gross Domestic Product (GDP) is approximately 25 percent. The Pakistan cement industry is considered to be one of the key drivers of the nation’s economy with 24 industrial units with the operational capacity of 46.94 million tons per annum (APCMA, Citation2017). According to the Pakistan Economic Survey 2016–17, the future prospects remain positive due to the development of large infrastructure projects, housing schemes and increased spending, in addition to the much anticipated China Pakistan Economic Corridor (CPEC) related projects. Due to these factors the cement consumption for the years 2018–19 is expected to reach in the upper single-digit range (CEMNET, Citation2017).
While there are several studies that have made demand projections about other minerals such as iron and copper focusing on sustainable mineral development (Han & Xiang, Citation2013; Hashimoto et al., Citation2009; Hu et al., Citation2010; Uwasu et al., Citation2014) limited research has been carried out for cement. It is forecasted that the cement consumption and production will increase in the coming decades (WBSD, Citation2009). Cement Industries are striving hard to take measures that have an impact on environmental as well have financial benefits attached to them. It has been reported that those companies adopting sustainable practices are able to achieve better product quality, higher market share, and increased profits (Nambiar, Citation2010). In this context, it is crucial to identify the initiatives that help firms implement proactive socio-environmental practices (Annunziata et al., Citation2018; Nlizwa Rashid et al., Citation2015). Areas such as waste heat recovery, carbon credit; alternative fuels are the ones that are being focused to achieve the environmental as well as financial sustainability goals. Waste heat is one of the several areas that may play a major role (Schneider et al., Citation2011). According to the sustainability criteria, selecting materials with low energy consumption, waste, and pollution directly reduces the environmental cost of construction materials and indirectly affects the other two dimensions of sustainability; economic and social (Weißenberger et al., Citation2014).
The economic growth element signifies costs, profits, and benefits accumulated along with investments made by the manufacturing organization (Joung et al., Citation2013). To achieve these benefits both the buyers and suppliers need to be motivated to own and embrace sustainability (Meehan & Bryde, Citation2014; Ganguly et al., Citation2019). Researchers worked on these growing elements of economic sustainability by using various techniques to provide a platform for the decision-makers. The author’s contribution is given in the Table , which shows the techniques used by various authors to identify the economic key performance indicators (KPIs) affecting the sustainability. Veleva and Ellenbecker (Vesela Veleva & Ellenbecker, Citation2001) worked on the economic sustainability of manufacturing setup by finding the key performance indicators based on Lowel center technique. In this direction, Amrina, E. et. al. (Elita Amrina et al., Citation2016) did the analysis of economic sustainability by using fuzzy multi-criterial approach for ranking and evaluation. Further, Li and Mathiyazhagan (Li & Mathiyazhagan, Citation2018) considered Dematel technique for the economic sustainability of the firm. Moreover, Ahmad and Wonga (Ahmad & Wong, Citation2019) used Delphi method to find the best economic sustainability KIPs.
Table 1. Author contribution table of the research
Table represents an overview of the previous work done in relation to economic sustainability. This research study not only used the economic sustainability KPI but also performed the KPI ranking of the cement industry using Taguchi S/N ratio. The novelty of this research paper is based on Taguchi technique to provide a wide range of significant economic sustainability KPIs for Cement Industry.
The main objective of this study is to identify and assign importance weightage to the KPIs for understanding their significance on the overall sustainability development. The rest of this paper is organized as follows: Section 2 presents the research methodology including questionnaire design, principal component analysis (PCA), and selection of key performance indicators. Section 3 comprises the results and analysis. This section presents, finding sample size for the target population and applying Taguchi technique to evaluate and rank the key performance indicators that have a significant impact on the economic sustainability of the cement industries. Finally, Section 4 summarizes and concludes the paper with future prospects.
2. Research methodology
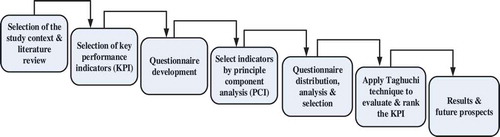
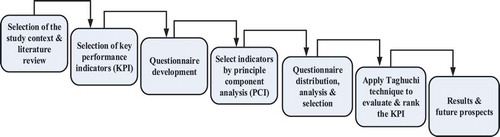
To achieve the objective, an approach shown in Figure has been used. Keeping the economic indicators in mind, a Likert Scale questionnaire is designed based on the initial set of 20 economic KPIs, which is followed by distributing this questionnaire among 20 experts from academia and industry as a pilot study. The data collected through the pilot study was then analyzed through Statistical package for social sciences (SPSS). Principal component analysis (PCA) is a technique that identifies the components that represent the maximum variance. Here the PCA is used to reduce the number of KPIs to 14 representing maximum variance. These 14 KPIs were made part of the final questionnaire to be distributed among the experts from cement industry. In the last step, Taguchi S/N ratio is used to assign the importance weightages to these KPIs.
Figure 1. Research methodology.
2.1. Questionnaire design
To develop the questionnaire for this study, the initial set of KPIs shown in Table were identified through literature review. The sustainable manufacturing indicators repository contains several different types of indicators sets and indices. These indicators are broad in nature and generally cover all the three pillars of sustainability namely economic, environmental, and social. Eleven major sustainability indicator sets have been identified (Joung et al., Citation2013). These different indices create confusion among manufacturers as which indicator index is to be used. There is no consensus on a realistic taxonomy of sustainability metrics (Sikdar, Citation2003). Global Reporting Initiative has identified a list of 70 indicators encompassing the three domains of sustainability: economic, environment, and society. Dow Jones sustainability indexes (DJSI) evaluates mainly economic performance in 12 criteria but also cover some environmental and social aspects too. Amrina and Vilsi, have identified 19 sustainability indicators, where 5 KPIs are measuring and evaluating the economic sustainability in cement industry (Amrina & Vilsi, Citation2015). The initial list of 20 KPIs identified through literature is shown in Table , which were then distributed among 15 experts in a pilot study.
Table 2. Initial list of key performance indicators for economic sustainability
The results from the pilot study were then evaluated through principal component analysis (PCA) and 8 components having an individual variance of more than 1.0, and cumulative variance of 71.985% were identified as shown in Table . Table is showing the factor loading on these 8 components and the 14 KPI’s having correlation of more than 0.70 were selected for final analysis. The final questionnaire consisting of 14 Economic KPIs was coded from Ec1 to Ec14 as shown in Table and was distributed among 213 people in 24 cement plants in Pakistan. The questionnaire contained two negatively coded questions, to verify that the respondents have correctly filled up the survey questionnaire. Likert scale is usually used to determine the respondent perception, therefore 5-point Likert scale was used for 1 being strongly disagree and 5 being strongly agree.
Table 3. KMO and Bartlett’s test
Table 4. Components showing initial Eigen values and the percentage of variance
Table 5. KPI loading on the components
Table 6. The key performance indicators selected for final questionnaire after PCA analysis
Before performing the principal component analysis, two measures need to be established for sampling adequacy; Kaiser-Meyer-Olkin (KMO) test, and Bartlett’s test of Sphericity (Budaev, Citation2010). The Kaiser-Meyer-Olkin (KMO) measures the proportion of variance among the variables and the test values ranges from 0 to 1 (Aldahmash et al., Citation2017) and KMO with more than 0.50 should be sufficient for performing PCA (Williams et al., Citation2010), in this study, the KMO resulted with 0.608. The Bartlett’s test of Sphericity determines that there is adequate correlations among the variables. The significance value should be < 0.05 to be considered statistically significant. In this study, the Bartlett’s test of Sphericity Sig. was 0.000 < 0.05, as shown in Table , indicating that further analysis of the data with the PCA may be useful.
2.2. Principal component analysis (PCA)
Principal component analysis (PCA) is used to extract the important information from multivariate data and express that information as a set of few new variables called principal components. These components are shown in column 1 of Table , the percentage of variation, and the cumulative percentage of these components is shown in column 2 and column 4 of Table respectively. The 8 components having an Eigen value of more than 1.0 and representing cumulative variance of 71.985% are selected.
2.3. Selection of key performance indicators for final questionnaire after PCA analysis
Table is showing the factor loading of the 20 KPIs on these 8 components representing Eigen Value (unique variance) of more 1.0, shown in Table . The 14 KPIs having a stronger correlation value of 0.6 or more are identified and selected to be included in the final questionnaire.
The KPI loading on the components was performed and is shown in Table . The eight components identified through PCA are placed in the first row of Table . The correlations among KPIs and these eight components are determined through PCA and those KPIs having stronger were identified. The KPIs having correlation value equal to or more than 0.6 are selected for the development of the final questionnaire, for instance, KPI 11 has the strongest correlation of 0.871 with component 8 and is selected for inclusion in the final questionnaire.
The 14 KPIs selected after performing principal component analysis were included in the final questionnaire and were assigned codes from Ec1 to Ec14 as shown in Table .
The questionnaire was distributed among 213 decision-makers, managers, and engineers of 24 cement plants in Pakistan as shown in Table , through email, regular mail, by hand, and filled up through interviews. Among the 89 received questionnaires, 9 were rejected due to conflicting replies on the negatively coded questions and 80 were accepted. A total of 41.7% of all the distributed questionnaires were received.
Table 7. Number of questionnaires distributed and received
3. Questionnaire response analysis
The initial questionnaire comprising 20 KPIs for the economic sustainability of the cement industry in Pakistan, was distributed among 213 decision-makers, managers, and engineers. Among the 213 questionnaires, 89 were received, of which 9 were rejected and 80 were accepted for further analysis.
Before performing the principal component analysis, the KMO and Bartlett’s tests were performed to check for sample adequacy, Table shows the results for both the KMO and Bartlett’s tests. Results for both the tests were within the acceptable range and the questionnaire was further analyzed through PCA.
The principal component analysis identified 8 components representing 71.985% cumulative variance, Table shows the results for the PCA. Table shows the loading of the KPIs on the components, 14 KPIs having stronger correlation; 0.7, with the 8 components were selected.
3.1. Sample size for the target population
The required sample size for the targeted population was calculated using Slovin’s formula (Susanto et al., Citation2017)
Where n is the sample size from population and N is the total population, e is the standard error which is 0.1 for the 90% confidence interval. Using EquationEquation 1(1)
(1) , the sample size n was calculated to be 78 for a population of 360 (15 respondents from each of the 24 cement industry were targeted based on relevance, experience, and qualification. These respondents were well versed with the economic sustainability of cement industry in Pakistan), with a confidence interval of 90%; hence a sample of 80 is adequately reliable for this study. This study has received 89 completed questionnaires out of which 9 were rejected due to conflicting replies on the negatively coded questions in the questionnaire and 80 were accepted, which were more than the required 78.
The study performed a Cronbach Alpha, one of the most common internal consistency estimate. Statisticians have debated upon the acceptable range of Cronbach alpha and by convention, an alpha of .65–.80 is often considered “adequate” (Vaske et al., Citation2017), all the 14 KPIs were found to be within the acceptable range are were accepted as valid as shown in Table .
Table 8. Cronbach alpha for the KPIs
3.2. Applying Taguchi signal to noise ratio
Taguchi suggested that an attribute must have a consistent average and target values, while a smaller variation would be better (Taguchi, Citation1991). Quality assessment should take into account both the impact of the average and variance into account at the same time(Ho et al., Citation2014). Taguchi S/N ratio has the additive capability and can be used to measure the relative opinion of the respondents.
Table shows the 5-point Likert scale where Xr represents the level of the Likert scale where r = 1, 2, 3, 4, 5, and Xt represent the total number of valid collected responses.
Table 9. Customer response on 5-point Likert scale data summary
The respondents’ priority opinion data was converted into count value to distinguish the “agreement” and “disagreement.” The Likert scale 4 and 5 represent the respondent’s agreement with the opinion, while the Likert scale 1 and 2 represent the respondent’s disagreement with the opinion in the questionnaire. The value of the respondent agreement to the opinion was calculated among the valid questionnaires collected as Ai and is shown in EquationEquation 2(2)
(2) , where i is the agreement with the opinion on the questionnaire and range from i = 1, 2, 3 … n. While the value for the respondent disagreement to the opinion in the valid questionnaires collected was calculated as Di and is shown in EquationEquation 3
(3)
(3) below.
The coefficient for agreement and disagreement is then calculated to be used in S/N ratio. EquationEquation 4(4)
(4) and EquationEquation 5
(5)
(5) shown below are used to calculate the coefficients for agreement and disagreement respectively.
EquationEquation 4(4)
(4) calculates the agreement coefficient, the higher value for agreement coefficient shows that the KPI will have a more positive impact on the economic aspect of the sustainability as the questionnaire was designed to judge the customer agreement, whereas the EquationEquation 5
(5)
(5) calculates the disagreement coefficient and a lower value for disagreement coefficient would suggest the disagreement to the opinion presented in the questionnaire. After the data conversion, the next step was to find the S/N ratio for the agreement and disagreement. EquationEquation 6
(6)
(6) and Equation7
(7)
(7) are used to calculate the S/N ratios for the agreement and disagreement respectively.
Here the Log functions are used in EquationEquation 6(6)
(6) and Equation7
(7)
(7) to get the additive capability and the negative value is to make the decision making consistent for 14 KPI’s. The greater ηAi represents the respondents’ agreement for that KPI while ηDi represents the respondents’ disagreement with that KPI. Fowlkes and Creveling suggested that the S/N has the advantage of addition (Fowlkes & Creveling, Citation1995). Hence, when measuring two groups of data under the same conditions and calculating their S/N ratios, the results can be added up when maximizing S/N ratio(Joseph & Wu, Citation2002). EquationEquation 8
(8)
(8) is used to integrate the S/N ratio of ith agreement and disagreement to assess the KPI ranking. The results are shown in the Table below.
Table represents the S/N ratio calculations, the coefficient of agreement and disagreement are determined using EquationEquations 4(4)
(4) and Equation5
(5)
(5) and are shown in columns 7 and 8 respectively. Column 9 and 10 represent the S/N ratio for agreement and disagreement of the respondent to that specific KPI, while column 11 shows the total value for S/N ratio and the last column ranks the KPIs based on the values generated in column 11.
Table 10. Taguchi’s signal to noise ratio analysis (Ranking)
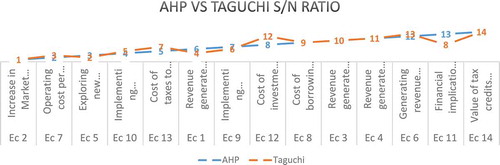
Analytical Hierarchy Process (AHP) is one the most often used and well-known techniques that makes paired comparisons and derive ratio scales (Gnanavelbabu & Arunagiri, Citation2018; Pablo Aragones-Beltran et al., Citation2010; Suganthi, Citation2018) was performed on the above data and the results were compared with the Taguchi S/N ratio. From the graph shown in Figure , it is evident that most of the KPIs ranking in both the techniques are identical except for minor variations; 6 KPIs are ranked the same, 6 KPIs ranking differ by 1 rank position and 2 KPIs differ by 2 rank positions in both the techniques.
Figure 2. Taguchi S/N ratio and AHP comparison.
4. Results
The results from Table shows that: The KPI “Ec-2” count value for strongly disagree is 0, and for disagree is 1, while 10 respondents have no opinion and are neutral, 36 respondents agree with the KPI and 34 respondents strongly agree as shown in columns 2, 3, 4, 5, and 6 respectively. The columns 7 and 8 in Table indicates the values of 0.8642 and 0.0123 for coefficients of agreement and disagreement with the Ec-2, while columns 9, 10, and 11 having values of 10.033, 19.0309, and 29.0644 represents S/N ratio for agreement, disagreement and integrated value for S/N ratio while column 12 shows the ranks based on the values of column 11. Based on the above results, it has been determined that Ec-2 is the most important KPI for economic sustainability and is followed by Ec-5, and Ec-7 having scores of 28.6693 and 28.4952 representing “New markets explored for exports” and “Operating cost per ton of cement production” respectively. Similarly, the Ec-14 representing “value of tax credits and tax reliefs received from government” is ranked the lowest with a score of 10.441.
5. Conclusions and future prospects
This study used the Taguchi Signal to noise ratio to evaluate and rank the key performance indicators that have a significant impact on the economic sustainability of the cement industries in Pakistan. The study considered the differences in respondents’ opinions and converted their agreement and disagreement information into a single indicator for visual judgment of key performance indicators by using the Taguchi S/N ratio.
The higher S/N ratio represented higher degree of agreement to that particular KPI which could be further used for consideration in sustainability decision making. Finally, this study used cases of Pakistan cement industries and provided information regarding the direction for decision making to improve the economic sustainability of the industry.
The Taguchi S/N ratio can be used in opinion surveys in different industries, literature shows that it has already been used in tourism and hospitality, and construction industry opinion surveys.
There is a scope for more in-depth studies in future to develop mathematical models for sustainability assessments, development of the model toward stochastic and fuzzy systems to address randomness and uncertainties respectively, and assessment of the effects of the KPIs of the other two pillars of sustainability; environmental and social, on the economic KPIs.
Cover image
Source: Author.
Acknowledgments
This research work was supported by the University of Engineering and Technology Peshawar, Pakistan.
Additional information
Funding
Notes on contributors

Rashid Nawaz
Dr.Rashid Nawaz has been working as an Assistant Professor in the Department of Industrial Engineering, at University of Engineering and Technology, Peshawar, Pakistan. He has completed his PhD., in Industrial Engineering from UET Peshawar, MS in Industrial Engineering from New York University, USA, and BS in Mechanical Engineering from UET Peshawar. His research interests are related to sustainable manufacturing, industrial facilities design, and location analysis.
References
- Ahmad, S., & Wong, K. Y. (2019). Development of weighted triple-bottom line sustainability indicators for the Malaysian food manufacturing industry using the Delphi method. Journal of Cleaner Production, 229, 1167–20. https://doi.org/10.1016/j.jclepro.2019.04.399
- Aldahmash, A., Gravell, A. M., & Howard, Y. (2017). Using factor analysis to study the critical success factors of agile software development. JSW, 12(12), 957–963. https://doi.org/10.17706/jsw.12.12.957-963
- Amrina, E., & Vilsi, A. L. (2015). Key performance indicators for sustainable manufacturing evaluation in cement industry. Procedia CIRP, 26(40), 19–23. https://doi.org/10.1016/j.procir.2014.07.173
- Annunziata, E., Pucci, T., Frey, M., & Zanni, L. (2018). The role of organizational capabilities in attaining corporate sustainability practices and economic performance: Evidence from Italian wine industry. Journal of Cleaner Production, 171, 1300–1311. https://doi.org/10.1016/j.jclepro.2017.10.035
- APCMA. (2017, April 10). Statement of installed production capacity. Installed production capacity. http://www.apcma.com/data_productioncapacity.html
- Azapagic, A., & Perdan, S. (2000). Indicators of sustainable development for industry: A general framework. Process Safety and Environmental Protection, 78(4), 243–261. https://doi.org/10.1205/095758200530763
- Brundtland. Our common future: Report of the world commission on environment and development.1987
- Budaev, S. V. (2010). Using principal components and factor analysis in animal behaviour research: Caveats and guidelines. Ethology, 116(5), 472–480. https://doi.org/10.1111/j.1439-0310.2010.01758.x
- CEMNET. Pakistan cement sector prospects.2017
- Damjan Krajnc, P. G., & Glavic, P. (2003). Indicators of sustainable production. Clean Techn Environ Policy, 5(3–4), 279–288. https://doi.org/10.1007/s10098-003-0221-z
- Elita Amrina, C. R., Vilsi, A. L., & Vilsi, A. L. (2016). A fuzzy multi criteria approach for sustainable manufacturing evaluation in cement industry. Procedia CIRP, 40, 619–624. https://doi.org/10.1016/j.procir.2016.01.144
- Fowlkes, W. Y., & Creveling, C. M. (1995). Engineering methods for robust product design. Addison-Wesley.
- Ganguly, B., Sarkar, B., Sarkar, M., Pareek, S., & Omair, M. (2019). Influence of controllable lead time, premium price, and unequal shipments under environmental effects in a supply chain management. RAIRO-Operations Research, 53(4), 1427–1451 doi:10.1051/ro/2018041
- Gnanavelbabu, A., & Arunagiri, P. (2018). Ranking of MUDA using AHP and Fuzzy AHP algorithm. Materials Today: Proceedings, 5(5, Part 2), 13406–13412. https://doi.org/10.1016/j.matpr.2018.02.334
- Haapala, K. R., Zhao, F., Camelio, J., Sutherland, J. W., Skerlos, S. J., Dornfeld, D. A., Jawahir, I. S., Clarens, A. F., & Rickli, J. L. (2013). A review of engineering research in sustainable manufacturing. Journal of Manufacturing Science and Engineering, 135(4), 041013–041013-16. https://doi.org/10.1115/1.4024040
- Han, J., & Xiang, W.-N. (2013). Analysis of material stock accumulation in China’s infrastructure and its regional disparity. Sustainability Science, 8(4), 553–564. https://doi.org/10.1007/s11625-012-0196-y
- Hashimoto, S., Tanikawa, H., & Moriguchi, Y. (2009). Framework for estimating potential wastes and secondary resources accumulated within an economy – A case study of construction minerals in Japan. Waste Management, 29(11), 2859–2866. https://doi.org/10.1016/j.wasman.2009.06.011
- Ho, L.-H., Feng, S.-Y., & Yen, T.-M. (2014). A new methodology for customer satisfaction analysis: Taguchi¡¯s signal-to-noise ratio approach. Journal of Service Science and Management, 07(3), 10. https://www.scirp.org/html/7-9201596_47258.htm
- Holden, E., Linnerud, K., & Banister, D. (2014). Sustainable development: Our common future revisited. Global Environmental Change, 26, 130–139. https://doi.org/10.1016/j.gloenvcha.2014.04.006
- Hu, D., You, F., Zhao, Y., Yuan, Y., Liu, T., Cao, A., Wang, Z., & Zhang, J. (2010). Input, stocks and output flows of urban residential building system in Beijing city, China from 1949 to 2008. Resources, Conservation and Recycling, 54(12), 1177–1188. https://doi.org/10.1016/j.resconrec.2010.03.011
- Joseph, V. R., & Wu, C. F. (2002). Operation window experiment: a novel approach to quality improvement. Journal of Quality Technology, 34(4), 345–354. https://doi.org/10.1080/00224065.2002.11980168
- Joung, C. B., Carrell, J., Sarkar, P., & Feng, S. C. (2013). Categorization of indicators for sustainable manufacturing. Ecological Indicators, 24, 148–157. https://doi.org/10.1016/j.ecolind.2012.05.030
- Khoshnava, S. M., Rostami, R., Valipour, A., Ismail, M., & Rahmat, A. R. (2018). Rank of green building material criteria based on the three pillars of sustainability using the hybrid multi criteria decision making method. Journal of Cleaner Production, 173, 82–99. https://doi.org/10.1016/j.jclepro.2016.10.066
- Labuschagne, C., & Brent, A. C. (2005). Sustainable project life cycle management: The need to integrate life cycles in the manufacturing sector. International Journal of Project Management, 23(2), 159–168. https://doi.org/10.1016/j.ijproman.2004.06.003
- Li, Y., & Mathiyazhagan, K. (2018). Application of DEMATEL approach to identify the influential indicators towards sustainable supply chain adoption in the auto components manufacturing sector. Journal of Cleaner Production, 172, 2931–2941. https://doi.org/10.1016/j.jclepro.2017.11.120
- Marja Paju, B. J., Heilala, J., Hentula, M., Heikkilä, A., Leong, S., & Lyons, K., Framework and indicators for a sustainable manufacturing mapping methodology. Proceedings of the 2010 winter simulation conference. Baltimore: Maryland State.
- Mats, W., Peter, A., & Carin, A. (2016). Sustainable production indicators at factory level. Journal of Manufacturing Technology Management, 27(6), 842–873. https://www.emerald.com/insight/content/doi/10.1108/JMTM-04-2016-0054/full/html
- Meehan, J., & Bryde, D. J. (2014). Procuring sustainably in social housing: The role of social capital. Journal of Purchasing and Supply Management, 20(2), 74–81. https://doi.org/10.1016/j.pursup.2014.01.002
- Moldavska, A., & Welo, T. (2017). The concept of sustainable manufacturing and its definitions: A content-analysis based literature review. Journal of Cleaner Production, 166(Suppl. C), 744–755. https://doi.org/10.1016/j.jclepro.2017.08.006
- Nambiar, A. N. Challenges in sustainable manufacturing. Proceedings of the 2010 international conference on industrial engineering and operations management, Dhaka, Bangladesh. 2010.
- Nlizwa Rashid, J. J., Yahya, S., & Shami, S. (2015). Dynamic eco innovation practices: A systematic review of state of the art and future direction for eco innovation study. Asian Social Science, 11, 1. http://dx.doi.org/10.5539/ass.v11n1p8
- Omair, M., Noor, S., Hussain, I., Maqsood, S., Khattak, S. B., Akhtar, R., & Haq, I. U. (2015). Sustainable development tool for Khyber Pakhtunkhwa’s dimension stone industry. Technol. J, 20, 160–165.
- Omair, M., Noor, S., Maqsood, S., & Nawaz, R. (2014). Assessment of Sustainability in Marble Quarry of Khyber Pakhtunkhwa Province Pakistan. International Journal of Engineering and Technology, 14(2014), 84–89
- Omair, M., Sarkar, B., & Cárdenas-Barrón, L. E. (2017). Minimum Quantity Lubrication and Carbon Footprint: A Step towards Sustainability. Sustainability, 9(5), 714 doi:10.3390/su9050714
- Omair, M., Ullah, M., Ganguly, B., Noor, S., Maqsood, S., & Sarkar, B. (2019). The quantitative analysis of workers’ stress due to working environment in the production system of the automobile part manufacturing industry. Mathematics, 7(7), 627
- Pablo Aragones-Beltran, J. P. P.-F., Garcıa-Garcıa, F., Pascual-Agullo, A., & Pascual-Agulló, A. (2010). An analytic network process approach for siting a municipal solid waste plant in the metropolitan area of Valencia (Spain). Journal of Environmental Management, 91(5), 1071–1086. https://doi.org/10.1016/j.jenvman.2009.12.007
- Salman, M. H., Sarkar, B., Tayyab, M., Saleem, M. W., Hussain, A., Ullah, M., Omair, M., & Iqbal, M. W. (2019). Large-scale disaster waste management under uncertain environment. Journal of Cleaner Production, 212(2019), 200–222 doi:10.1016/j.jclepro.2018.11.154
- Sarkar, B., Omair, M., & Choi, S-B.. (2018). A multi-objective optimization of energy, economic, and carbon emission in a production model under sustainable supply chain management. Applied Sciences, 8(10), 1744 doi:10.3390/app8101744
- Schneider, M., Romer, M., Tschudin, M., & Bolio, H. (2011). Sustainable cement production—present and future. Cement and Concrete Research, 41(7), 642–650. https://doi.org/10.1016/j.cemconres.2011.03.019
- Sikdar, S. K. (2003). Sustainable development and sustainability metrics. AIChE Journal, 49(8), 1928–1932. https://doi.org/10.1002/aic.690490802
- Suganthi, L. (2018). Multi expert and multi criteria evaluation of sectoral investments for sustainable development: An integrated fuzzy AHP, VIKOR/DEA methodology. Sustainable Cities and Society, 43, 144–156. https://doi.org/10.1016/j.scs.2018.08.022
- Susanto, T. D., Diani, M. M., & Hafidz, I. (2017). User acceptance of e-government citizen report system (a case study of city113 app). Procedia Computer Science, 124, 560–568. https://www.sciencedirect.com/science/article/pii/S1877050917329587
- Taguchi, G. (1991). Signal-to-noise ratio for quality evaluation (1st ed.). Amer Supplier Inst.
- Uwasu, M., Hara, K., & Yabar, H. (2014). World cement production and environmental implications. Environmental Development, 10, 36–47. https://doi.org/10.1016/j.envdev.2014.02.005
- Vaske, J. J., Beaman, J., & Sponarski, C. C. (2017). Rethinking internal consistency in Cronbach’s Alpha. Leisure Sciences, 39(2), 163–173. https://doi.org/10.1080/01490400.2015.1127189
- Vesela Veleva, M. E., & Ellenbecker, M. (2001). Indicators of sustainable production: Framework and methodology. Journal of Cleaner Production, 9(6), 519–549. https://doi.org/10.1016/S0959-6526(01)00010-5
- Wang, E.-J., Lin, C.-Y., & Su, T.-S. (2016). Electricity monitoring system with fuzzy multi-objective linear programming integrated in carbon footprint labeling system for manufacturing decision making. Journal of Cleaner Production, 112(5), 3935–3951. https://doi.org/10.1016/j.jclepro.2015.07.086
- WBSD, I. (2009). Technology roadmap cement.
- WCED. (1987). Our common future. World commission on environment and development. Oxford University Press, Oxford.
- Weißenberger, M., Jensch, W., & Lang, W. (2014). The convergence of life cycle assessment and nearly zero-energy buildings: The case of Germany. Energy and Buildings, 76, 551–557. https://doi.org/10.1016/j.enbuild.2014.03.028
- Williams, B., Onsman, A., & Brown, T. (2010). Exploratory factor analysis: A five-step guide for novices. Australasian Journal of Paramedicine, 8, 3. https://doi.org/10.33151/ajp.8.3.93
- Yan Dong, M. Z. H. (2017). Indicators for environmental sustainability. Procedia CIRP, 61, 697-702. https://www.sciencedirect.com/science/article/pii/S2212827116313336?via%3Dihub