
Abstract
In the current study, minimization of waste in terms of sack rejection at a polypropylene bag manufacturing process is achieved. The Six Sigma DMAIC (Define, Measure, Analyze, Improve, Control) approach is adopted which results in 50% waste reduction and a considerable cost saving. The sack rejection is brought to 1.20% from the previous average waste of 2.80% using DMAIC. It is found that this high rejection rate of 2.80% is due to the low fabric strength obtained at the weaving section, which in turn occurred due to the lower tape tenacity values obtained from the extrusion section. Hence, experimental design is conducted at the extrusion department and it is found that the two interacting factors are playing a significant contribution to the process variation and hence result in lower tape-tenacity (i.e., less than 6 g/denier). The two interacting factors included the “water bath temperature” and “line speed” of the extrusion process, with a p-value less than 5%. By further analysis, the optimal level of these significant factors is found. They are 300 m/min for “line speed” and 40⁰C for “water bath temperature. At these settings, the extrusion process produces optimal tape-tenacity results (i.e., at least 6 g/denier), which ultimately results in minimum waste in terms of sack rejection waste. The objective of the study includes finding the significant factors contributing to the process variation. Also controlling those factors to the optimal levels to achieve minimum wastage and considerable cost saving. The methodology and findings of the present study can be generalized to the polypropylene bag manufacturing plants and the process efficiency can be enhanced.
PUBLIC INTEREST STATEMENT
Six Sigma is a method that provides organizations tools to improve the capability of their business processes. This increase in performance and decrease in process variation helps lead to defect reduction and improvement in profits, employee morale, and quality of products or services. In this research, the DMAIC approach of six sigma is adopted which results in 50% waste reduction and a considerable cost saving. The objective of the study includes finding the significant factors contributing to the process variation. Also controlling those factors to the optimal levels to achieve minimum wastage and considerable cost saving. The methodology and findings of the present study can be generalized to the polypropylene bag manufacturing plants and the process efficiency can be enhanced.
1. Introduction
Plastic pollution nowadays is a global concern, the concentration of which has reached a peak value with the production increasing dramatically (Wilcox et al., Citation2015). The improper disposal of used polypropylene bags (a form of plastic bags) has a colossal adverse effect on the environment and the ecosystem in particular. It takes a long time for plastic bags to degrade in the soil and eventually results in water, air, and soil pollution (Asmuni et al., Citation2015). Moreover, the wastage produced during production processes of polypropylene bags is also a major contributor of environmental degradation and is quality-related concern faced by the industries in recent times. This high rejection rate has a direct and adverse effect on the profit margin of the product and eventually decreases the quality of the product. Research has been conducted to develop effective polypropylene recycling methods (Bora et al., Citation2020). The researchers aim to reduce the environmental impacts of the plastic waste. The current research project aims at devising the efficient manufacturing process to have minimum plastic waste in the first place.
Most of the companies are struggling hard to reduce this high rejection rate by using different quality tools to remain competitive in the market (Srinivasan et al., Citation2016a). One of the recognized and powerful strategies to speed up improvements in product, service, and all types of processes and to enhance competitiveness is the (6ẟ) DMAIC methodology. This tool relentlessly focuses on reducing variation and eliminating wastes to improve the process, reduce variation, and enhance competitiveness (Schmidt et al., Citation2018). Six Sigma is statistically defined as a process having less than 3.4 defects per million opportunities (DPMO) where the term sigma is used to represent the variation about the process average (Seow & Antony, Citation2004). A high sigma value indicates an improved process with fewer defects. Graphically, Six Sigma is explained in .
Figure 1. Normal distribution curve and sigma level
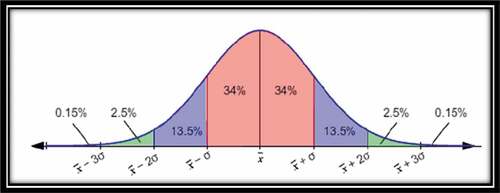
For instance, substantial financial returns have been demonstrated by Sony (Brun, Citation2011) and General Electric (GE) (Eckes, Citation2002; Schmidt et al., Citation2018), which are well established and quality conscious organizations after successful implementation of six sigma in various business forms. Many companies and manufacturing units start operating at a 3 to 4 sigma level (Fortenot et al., Citation1994). It means that the current process is producing between 6210 and 66,807 defects per million opportunities, which is a high loss in terms of product or service. shows the relationship between defects per million opportunities and sigma level (Gijo & Antony, Citation2014).
Table 1. Sigma level, DPMO, and cost of quality (Bendell, T. (2006))
Among the three different methodologies followed by Six Sigma according to different scenarios and situations, DMAIC is the best strategy. It is utilized for minimizing production time by cutting off unproductive steps, define, measure, analyze the problem and then control and improve it, and focuses on continuous improvement of the processes(Catherwood, Citation2002). Improved process yield, reduced rework and rejection rate, improved on-time delivery, reduced raw material inventory, and material availability on time are some of the benefits of (6ẟ) in recent times.
In the define phase, importance in the context of the organization is discovered. Major tasks of this phase are Project selection, Strategic planning and decision, Project charter, Process Mapping, and Project management tools. In the first step, critical to quality factors (CTQs) also should be identified which have major importance. The main theme should be to understand CTQs and spreading it to the whole organization and work floor to make it further better to improve profitability and customer satisfaction. The measure phase calculates the current sigma level of the company by gathering information and data and measures the process capability to compare it with the customer requirements. In this phase, process variables that are to be measured for the identification of process, the level is selected, the data sources for the collection of data are identified, plan for the collection of the data is prepared and the measurement process for the proper measurement of the whole process is implemented. Collection of accurate and original data for the calculation of the actual performance of the process performance is the main objective of the measure phase(Tennant, Citation2001).
In the Analyse phase, data analysis tools and process analysis techniques are used to identify the root causes of the problem. The main tools are parameter estimation and hypothesis testing. The data which is collected during the previous phase are analyzed by various statistical and analytical tools to approach the root cause and identify the problem and cause of the problem(Tennant, Citation2001).
The goal of the Improve stage is to identify and provide the best possible solutions to eliminate the root causes of the problem. The best possible solution was achieved mainly through the Design of Experiments.
The last phase in the DMAIC protocol is the Control Phase. A solution is provided to the industry for implementation, in which standard operating procedures are developed and explained to implement the changes in the process. The improved process is monitored to ensure that it is providing the desired results. The final results are delivered to the owner along with the financial benefit provided to the industry. To ensure that all the process outputs will be in a state of control, the actions required at each phase are described by the control plan. It is a checklist to highlight the important areas and to check it properly and regularly. (6ẟ) develops a hierarchy of process improvement specialists which is known as “Belt Hierarchy”. It is comprised of five levels which are Yellow belt, Green belt, Black belt, Master Black belt, and Six Sigma Champion (Gutiérrez et al., Citation2012,15,16; Schroeder et al., Citation2008).
In the present study, it is aimed to reduce the waste rejection of the polypropylene sack at the selected manufacturing plant. The significant factors are identified that contribute to the process variation and are the major source of rejection. It is critical to optimize the significant factors so that the waste in terms of the rejection rate of the sack can be minimized. Ultimately, this will contribute to the profitability of the organization in particular, make the product available to the customers at a lower cost, and also help to conserve the natural resources and the environment in general. To reduce the high rejection rate of polypropylene bags, the DMAIC strategy has been deployed in this research. Initially, in the Define phase, the problem is identified followed by a measured phase where the extent of the problem is identified for further reduction/elimination. The problem is then analyzed in the analysis phase and potential causes have been identified. Finally, the problem is evaluated, and a solution is suggested by using a technique of design of experiments (DOE) during the improvement phase. Further strategies have been designed to control and monitor the process, ensuring the implementation of craved results. Minitab 15 has been used for the statistical analysis of research. A 50% reduction in the rejection rate is resulted by suggesting an optimum solution that leads to notable monetary advantages to the industry. The detailed methodology is presented in section 3, research design.
The rest of this paper is organized as follows. Section 2 presents a brief literature review, addressing the DMAIC process and 6ẟ implementation in various organizations around the world. A step-by-step methodology and results of the implementation of each phase of 6ẟ techniques are discussed in section 3. Financial savings resulted from successfully implementing the 6ẟ are presented in section 4. Section 5 comprises conclusion along with the implications of the research. Limitations of the research along with a direction for future work have been discussed in section 5.
2. Literature review
Due to increasing competition, organizations are striving hard to improve their processes to remain competitive in the market (Srinivasan et al., Citation2016a). One of the recognized and powerful strategies to speed up improvements in product, service, and all types of processes and to enhance competitiveness is the 6ẟ. This tool relentlessly focuses on reducing variation and eliminating wastes to improve the process, reduce variation, and enhance competitiveness. The presence of a well-organized quality culture in General Electric (GE) headquarters has a very positive impact on the deployment of 6ẟ in its subsidiaries in Brazil as investigated by (Schmidt et al., Citation2018). Some of the critical factors related to the implementation of 6ẟ in most of the multinational companies in Malaysia have been explored by (Sivakumar & Muthusamy, Citation2011) and it has been revealed that for the successful implementation of 6ẟ, training and awareness, project assessment, frequent communication and commitment of management are very necessary. Effective organizational structure in addition to the top management is also necessary to be placed for supporting the introduction and development program of 6ẟ (Banuelas Coronado & Antony, Citation2002).
It has been estimated in a report, released by the institute of medicine in November 1999, that due to medical errors in hospitals, around 98,000 patients die each year and it recognized the need for improving healthcare qualities and patients safety (Guinane & Davis, Citation2004). Healthcare Information and Management System Society hosted an online mailing list server for surveying healthcare organizations in which it is founded that 6ẟ has been practiced by 15 out of 56 responding organizations (Manuel, Citation2008). Another survey related to healthcare organizations revealed that among 18.5% of the respondents 6ẟ is the most common approach followed closely by lean processes which are 13.3% (Martin & McLennan, Citation2005). Research (Timans et al., Citation2016) has highlighted the need for a specific and well-organized framework for the implementation of Lean Six Sigma (LSS) in small and medium-sized enterprises (SME’s) by evaluating an existing framework for 6ẟ implementation developed by Kumar et al. (Kumar et al., Citation2011) for SME’s. In this research, first, the expertise from both the consultants and practitioners has been brought upon together in a focus group as experience provides opportunities to achieve good results in a short time. Secondly, it is precarious to rely on a single focus group; therefore, triangulation has been strived for to have a connection between structured literature study and contribution from other studies. In the third phase of the research, the focus group has been followed up with retrospective interviews to know about SME’s who have implemented LSS. Based on the results of the three research methods, a revised conceptual framework for 6ẟ implementation has been developed.
Hann et al. (Hann et al., Citation2007) revealed that one of the key components of LSS is the involvement and support of top management as they influence the success or failure of 6ẟ by taking actions and making consistent decisions about its implementation process that should be capable of any future change. Another key component of LSS revealed by Trusko et al. (Elkin, Citation2008) that is used with the process scrutiny is the statistical and graphical analysis. These include tools such as Pareto charts, control charts, value stream maps, histograms, and box plots which are used for the demonstration of tangible results and to get a financial return from any LLS project. Benitez et al. (Benitez et al., Citation2007) have revealed the third key component of LSS which is the unique infrastructure that uses the green belts, champions, and black belts for leading and implementing the LSS initiative. The relationship between these three key components and cultural characteristics has been analyzed in a study (Knapp, Citation2015) through surveying 446 human resource and quality managers of 223 hospitals located at different places in Florida, USA. The findings of the study revealed that for successful implementation of 6ẟ, collaboration, learning, and involvement are the key characteristics associated with the group culture. Also for using the approaches and strategies that are consistent with the developmental and group cultures, the hospital managers should be well served.
The implementation of the DMAIC approach of 6ẟ in the furnace manufacturing industry has been reported in a study (Srinivasan et al., Citation2016b). The manufacturing company was facing the challenge to achieve a high-quality furnace nozzle which is the critical component of the oil-fired furnace. The engineers and operators were unable to investigate the key parameters that were affecting the accurate drilling of the nozzle hole. So, the “failure to manufacture the nozzle with accurate hole diameter” was chosen as the problem to be addressed through the use of DMAIC phases. In the define phase of DMAIC, a team was formed who analyzed the data concerned with the manufacturing of nozzle for the past one year using the Pareto analysis chart and it was observed that the occurrence of a large number of defects in the drilling phase of the nozzle is most common. During the measure phase, the coordinate measuring machine was used to measure the variation in the hole that results from the drilling operation. In the Analyze phase of the DMAIC approach, a brainstorming session was performed and the key factors affecting the drilling of the nozzle hole were identified using the cause and effect diagram. During the Improve phase, the optimum values of four key factors and the best combination among these factors were identified by designing and conducting experiments. In the last phase, i.e. control phase, the operators were requested to follow the speed and feed rate while operating the radial drilling machine. By implementing the DMAIC phases successfully, a significant increase in the 6ẟ has resulted that it also has reduced the cost by 6% per year.
Another study (Shanmugaraja et al., Citation2011) revealed the application of 6ẟ in one of the SME’s in India where DMAIC methodology was applied to the casting process to reduce the rejection rate that was mainly occurring due to blowing holes in a two-stroke engine oil pump body. The rejection rate was reduced from 17.22% to 4.8% through the effective application of the DMAIC methodology. Darshak Desai et al. (Desai & Prajapati, Citation2017) implemented the DMAIC methodology at the steel and plastic products manufacturing industry that was facing many rejection problems occurring mainly due to short molding, injection point, and contaminations on different products. By successfully implementing the DMAIC methodology to the injection molding machine, savings of 10.8 lacs has resulted. The application of DMAIC and statistical process control (SPC) in a medical device manufacturing industry to improve operational performance is discussed in a study (Gaikwad et al., Citation2019).
This research study deals with the manufacturing process of the process company, where the high rejection rate is due to non-conformance of collar diameter to the desired specifications on grooving operation (Zahraee, Citation2016). The cost of poor quality was identified using process mapping in the define phase while the paired comparison technique was used to determine the suspected sources of variation in the measure phase. Whereas the basic root cause of the rejection was identified in the Analyze phase. Some corrective measures were suggested and improvement was quantified during the Improve phase. Control charts were suggested to be used to monitor the process in the final phase of the DMAIC methodology. Some of the work done by various authors is summarized in .
Table 2. Summary of work done by various authors (Timans et al., Citation2016; Knapp, Citation2015; Srinivasan et al., Citation2016b; Desai & Prajapati, Citation2017; Gaikwad, et al, Citation2019; Zahraee, Citation2016; Yadav, et al., Citation2018; Tsironis & Psychogios, Citation2016; Kaid, Citation2016; Dora & Gellynck, Citation2015; Muturi, et al, Citation2015; Gutierrez-Gutierrez, et al., Citation2016; Durbaca, Citation2015; Ping, Citation2015; Shah & Patel, Citation2018; InayatHusen, Citation2015)
A number of publications on Six Sigma DMAIC addressed several quality-related issues, but little evidence has been found on the identification of the significant factors that cause the process variation in the polypropylene sack manufacturing process. Hence, this is the prime objective of this research study, to find not only the significant factors but also their optimum operating levels. This will ultimately cause a reduction in the rejection rate and waste minimization.
3. Research design
Nowadays, the researches cover the sustainable and environmental design to attract customers, which includes the waste management and imperfection (Kang, et al., Citation2019; Omair, et al., Citation2019; Nawaz, et al., Citation2020; Ullah, et al., Citation2021; Alkahtani, et al., Citation2021; Alkahtani, et al., Citation2021; Alkahtani, et al., Citation2020). During the last few years, the high rejection rate of polypropylene bags is recorded from both internal and external customers, which was a major cause of concern for both the management and customers. This high rejection rate was not only the source of profit reduction but was also creating customer dissatisfaction, which would result in longer term repercussions for the organization. As it is a quality-oriented problem so after reviewing the data, the only best solution possible to the problem is the DMAIC methodology of 6ẟ. DMAIC is best suited to improve the already existing process and optimize the process parameters (InayatHusen, Citation2015). By successfully implementing 6ẟ, a significant reduction (50%) has resulted in the rejection rate of polypropylene bags. There is an average savings of approximately 92,000 USD per year from the research. The research started practically on the shop floor where the high rejection rate of polypropylene bags is recorded for extrusion and weaving departments, respectively. The research phases that present a comprehensive study focused on the DMAIC methodology of 6ẟ implementation are mentioned here.
3.1. Define phase (Defining the research problem)
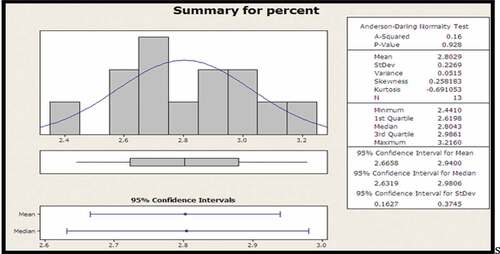
In the Define phase, the last 10 months’ data of Sack Rejection are collected from management and it has been statistically analyzed, in software Minitab 15. shows that at a 95% confidence interval the average monthly rejection rate of the sack is 2.8% for mean 2.6% to 2.9%.
Figure 2. Graphical summary for rejection of 10 months’ data
During the following areas of Define phase the DMAIC roadmap was developed for this problem.
Step I: Project Charter:
The annual rejection rate of Polypropylene bags is recorded as 2.8 percent. The recycling processes, rework, machines downtime reduce the overall efficiency of the plant, which leads to customer dissatisfaction, order cancellation, and loss of market share. The goal is to reduce the rejection rate by 45%-55% and improve the current process that will enhance the company’s profitability. The company can gain customer satisfaction and a financial benefit of 10 to 11 million PKR per annum by reducing the rejection rate. The implementation plan of the project is shown in .
Table 3. Implementation plan
After the above steps, the sigma level of the industry is calculated through DPMO calculations which are 3.6. For the reduction of defects, the sigma level has been decided to be increased.
Step II: Customer Requirements:
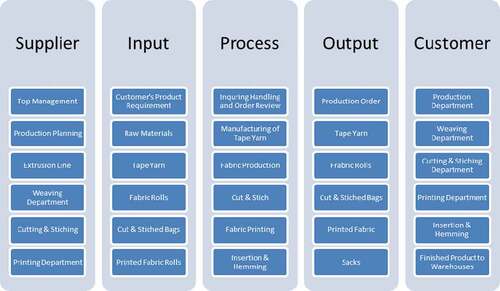
A high-level process map is prepared which explained the internal customers, phases of production and helps to identify Key Process Input Variables (KPIVs) and Key Process Output Variables (KPOVs) in each phase, through the Supplier-Input-Process-Output-Customer (SIPOC) chart, as shown in .
Figure 3. SIPOC—Describes the important information about customer–process dependencies
Step III: Voice of Customer VS Voice of Process Map:
The product’s requirements that are critical to quality and customers have been identified after a detailed brainstorming session. The brainstorming session included authors, quality engineers, plant engineers, and marketing professionals. The main focus is to link customer’s CTQs with VOP as shown in .
Table 4. Voice of customer VS voice of process table
compares the voice of the customer to the internal data for the existing process performance to be accessed. Furthermore, the table helped to translate the customer needs to product output characteristics. The rating indicates that the weaving process is one of the main areas of improvement from the customer point of view followed by the extrusion process.
3.2. Measure Phase (Identifying and measuring KPIV’s and KPOV’s)
During the measure phase, the DMAIC roadmap has been used in the following areas.
Step I: Identification of the Area to be focused:
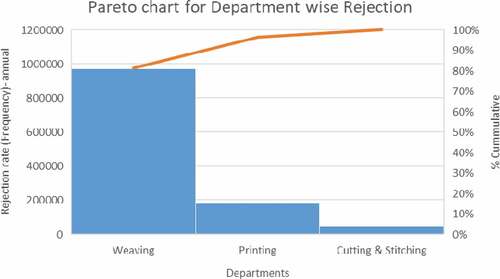
It has been planned to see the dispersion of rejection data by each department (extrusion, weaving, cutting & stitching, printing, and packaging) for the significant variables to be identified. The weaving department has reported 81% of sacks rejection as shown in . For the sack rejection rate to be reduced, the weaving department has been decided to be focused on.
Figure 4. Histogram of percent of each department showing dispersion from mean
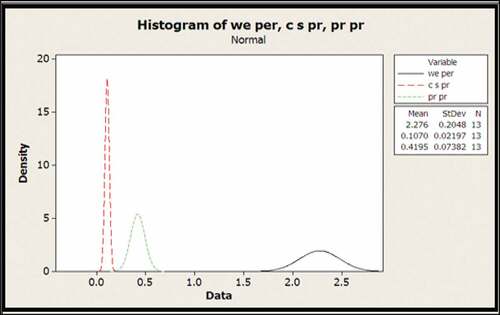
Figure 5. Pareto chart for identification of major rejection department
Step II: Identification of KPIVs and KPOVs of Important Areas:
Now focus is to understand the Key Process Output Variables (KPOVS) of the Weaving process and those critical Key Process Input Variables (KPIVS) that have a strong influence on KPOVS. After brainstorming sessions, the following cause and effect matrix is prepared for the weaving department as shown in .
Table 5. Cause and effect matrix of weaving line
shows that Tape quality, Density and Ring size of higher ratings are the KPIVs that have a significant influence on the KPOVs. The KPIV, Tape quality was revealed to be the most influential factor with the highest ratings. Also, it is selected because it is the final output of the extrusion line and all KPOVs are measured for Tape quality which finally becomes then KPIVs for the weaving department. Other KPIVs as finger adjustment, etc., are adjusted accordingly during the process according to specifications.
indicate that the Weaving department is causing the highest rejection rate among all the departments. The mean sack rejection for the weaving department is 2.27% causing about 81% of the sack rejection.
3.3. Analyze phase (Analyzing significant KPIV’s and KPOV’s)
During the Analyze phase, the DMAIC roadmap has been used in the following areas.
Step I: Identification of Significant KPOVs (Y’S of Weaving Department)
reveals that the size, elongation, and strength of the fabric are some of the critical output variables. The hypothesis testing and confidence interval have been planned to be used to identify the output variable that needs to be improved. To perform hypothesis testing for KPOVs, five weaving looms (machines) are selected and each KPOV is measured five times. To check whether the mean of each KPOV is equal to the required process standard or not, the one-sample t-test has been used.
3.3.1. Hypothesis testing
The hypothesis testing for the three parameters, fabric size, fabric elongation, and fabric strength is conducted and the results of the tests are recorded in respectively. shows that (Ho) the fabric mean size is equal to 50 cm, the required process standard. The results in show that fabric mean elongation is greater than 18%, the required process standard. shows the result of null hypothesis, which states that fabric mean elongation is equal to 70 Kg/5 cm, the required process standard will fail to be rejected. Hence, Fabric Strength has been identified as the most significant KPOV during the above Hypothesis testing.
Table 6. One-sample t-test for fabric size (cm), Ho: µ = 50 cm, H1: µ ≠ 50 cm
Table 7. One-sample t-test for fabric elongation (%), Ho: μ = 18%, H1: μ > 18%
Table 8. One-sample t-test for fabric strength (Kg/cm), Ho: μ = 70 Kg/5 cm, H1: μ > 70 Kg/5 cm
The next step in the Analyze phase was to identify the most critical KPIV that was driving variation in Fabric Strength.
Step II: Identify Critical KPIVs (X’S):
Tape quality is the most significant KPIV as revealed by the CE matrix (), which is the output of the extrusion line. represents the Cause & Effect Matrix which is prepared for the extrusion line to identify the KPIVs. Raw material, the temperature of the extruder, oil unit, and water bath, and line speed are revealed to have higher ratings in comparison to other variables. Tape tenacity, width, and denier are also revealed to be the critical output variables. Hypothesis testing is used to identify the output variable that needs to be improved. To perform hypothesis testing for each KPIV, 25 bobbins are selected from the extrusion line and a One-Sample t-test is performed on each KPIV.
Table 9. Cause & effect matrix of extrusion line showing important KPIVS
3.3.2. I). Hypothesis testing for mean tape width
The results of the hypothesis testing for the mean tape width, mean tape denier, and tape tenacity are recorded in , respectively. Results in show that the mean tape width is equal to the required process standard of 2.6 mm. shows that the mean tape Denier is equal to 950 gm, the required process standard. Results in shows the result of null hypothesis, which states that tape tenacity is equal to 6 g/denier, the required process standard is rejected (as P-value is less than 0.05). Hence, Tape Tenacity is identified as the most significant KPOV during the above Hypothesis testing.
Table 10. One-Sample t-test for Tape Width (mm), Ho: μ = 2.6 mm, H1: μ ≠ 2.6 mm
Table 11. One-Sample t-test for Tape Denier (gm), Ho: μ = 950 gm, H1: μ ≠ 950 gm
Table 12. One-Sample t-test for Tape Tenacity (gm./denier), Ho: μ = 6 g/denier, H1: μ ≤ 6 g/denier
The current focus is to identify the critical input variables (KPIV) that drive variation in Tape Tenacity. The input variables influencing directly the tape tenacity are decided to be analyzed.
3.4. Improve phase (Improving the process using DOE)
It has been identified and verified that sack rejection is driven by fabric strength in the weaving department which in turn is driven by process factor tape tenacity. In the next step, the focus is on identifying and selecting among the available solutions. During the Improve phase of the research problem, the design of experiments at the extrusion line has been decided to be conducted to improve the tape tenacity.
Step I: Conducting Design of Experiments (DOE)
To improve the tape tenacity, that has been identified as the reason for the low fabric strength in the weaving department, the DOE (design of experiment) at the extrusion line is decided to be conducted. Due to limited resources of industry and time constraint, only 4 factors with 2 levels and ½ fraction factorial with two replicates (16 runs) are selected to perform DOE at extrusion line (Tape manufacturing). describes the factors and levels for the experiment.
Table 13. Factors and levels for DOE
Table 14. Results of DOE after conducting experiments
The following results have been concluded from the design of experiments as shown in the table and figures.
To explore the effects of the factors on the tape tenacity in the extrusion process line and to understand the nature of the relationship, the factorial plots are examined excluding the main effects. show that when the line speed is 300 m/min and water bath temperature is 400C, the tape tenacity has a higher value of 6.225 g/denier which shows a significant effect on tape tenacity.
Figure 6. (a) Normal probability plot for effects of tenacity, (b) Graphical summary of interaction effects, (c) Graph of optimum setting for tenacity
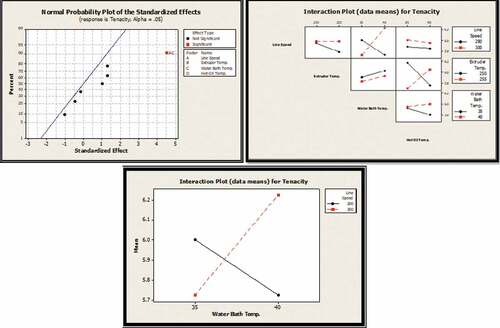
To be cost-effective, it is decided to use lower side temperatures for extruder and hot oil unit temperatures as they are not significant. Furthermore, for the attainment of maximum tape tenacity, the extrusion line process has been decided to be run with the following new settings as shown in .
Table 15. New settings from DOE
Step II: Analysis of Improvements
Before and after outcomes have been analyzed by creating a histogram. explains that as most of the values for after tape tenacity are exceeding the target value of 6 g/denier, it is negatively skewed as compared to before tenacity data which is positively skewed as most of the values are below the targeted value.
Figure 7. Histogram of before and after improvement of tenacity
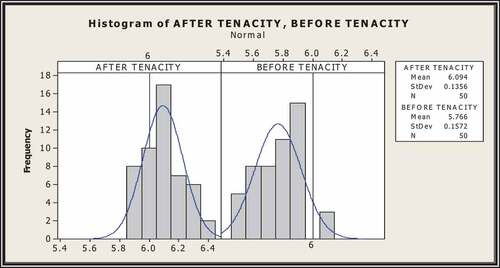
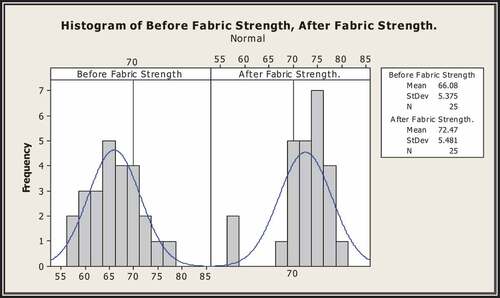
Hence, the target to improve the tape tenacity for the extrusion line has been achieved as shown by the analysis. The analysis () shows that due to improved tape tenacity, the fabric strength for the weaving process has increased.
Figure 8. Histogram of before and after improvement of fabric strength
Finally, the data for weaving sack rejection after improved fabric strength of the last 12 days are collected and compared with the previous data of sack rejection to determine whether the sack rejection rate decreased or not. It is observed from data that the weaving sack rejection rate has been substantially reduced to about 50%. The results for the Two-Sample t-test are shown in .
Table 16. Two sample t-test results of before and after weaving percentage
The 95% confidence interval (0.9405, 1.2144) does not include zero, which suggests that there is a significant difference in the means of the two samples. Therefore, it is concluded that with improved fabric strength, the weaving sack rejection trend has decreased.
3.5. Control phase (Monitoring and controlling significant process inputs and outputs)
The following steps are required to control the process parameters.
Step I: Control Plan and Implementation Process
To monitor the most significant process outcomes (Y’s) and input variables (X’s), a control plan is developed. The developed control plan as shown in .
Table 17. Control plan for sustaining improvements
Step II: Determining Improved Process Capability
It is planned to verify the improvements by determining the improved process capability. are the X-bar and R charts, respectively, which indicate that all values are in the control limits and the process is running efficiently after improvement. In X-bar chart of , the y-axis represents the tape tenacity values (g/denier) while the x-axis represents the samples tested. The USL is 6.27 g/denier, while LSL is 5.91 g/denier. The R-chart represents the dispersion among the sample numbers with the similar units of measurement.
Figure 9. X-bar and R chart showing improvement in mean & variation of tape tenacity
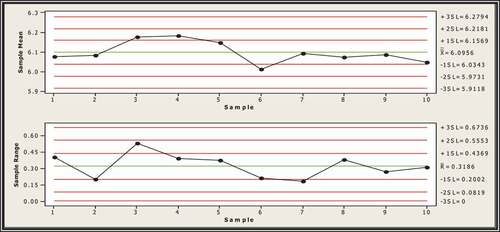
Figure 10. X-bar and R chart showing improvement in mean &variation of fabric strength
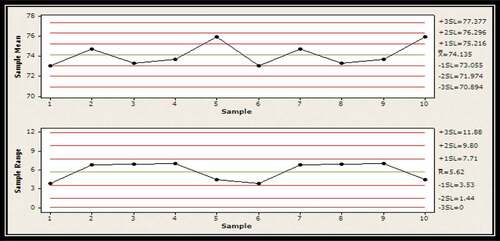
In X-bar chart of , the y-axis represents the fabric strength values (kg/cm) while the x-axis represents the samples tested. The USL is 77.38 kg/cm, while LSL is 70.89 kg/cm. The R-chart represents the dispersion among the sample numbers with the similar units of measurement.
4. Experimental results of the research
During DMAIC implementation, it has been identified that weaving fabric strength is a significant KPOV of the weaving process and is required to be improved to control the weaving sack rejection. This fabric strength is later on linked with tape tenacity, whose most of the data are below the target value. DOE has been implemented to achieve the required improvement and target values. Finally, the new average Weaving sack rejection turned out to be 1.13% as compared to 2.27% before starting the project. This shows that the current improvements reduced the sack rejection rate by 50%, thus achieving the target.
From the data collected over 12 days, the costs are calculated to verify the savings made. presents the summary of improvements achieved through DMAIC methodology implementation. It can be seen that the average rejection rate has reduced to about 50%, thus providing a financial gain of 11 million rupees per year. It will also increase customer satisfaction which is an important goal for every organization. Data collection is made for 12 days only due to time and resource constraints posed by the organization.
Table 18. Cost saving and analysis table
5. Conclusions
Process efficiency of a polypropylene bag manufacturing plant is enhanced using Six Sigma (6σ) DMAIC methodology. The sack rejection rate is reduced by 50%. The methodology is applied to a selected local polypropylene bag manufacturing industry. An average sack rejection of 2.8% is found which was reduced to 1.20% using DMAIC. The sack rejection occurred in the weaving department because of the low tape quality. The input to the weaving department was the extrusion process. The low tape quality was produced because of the lower values of the “tape tenacity” obtained from the extrusion process. The “factorial analysis” was performed at the extrusion process to identify the significant factors causing possible variation in the process and degrading quality. At the extrusion process, the interaction of “line speed” (LS) and the “water bath temperature” (WBT) was found to be statistically significant mentioned in . The WBT of 40⁰C and LS of 300 m/min results in “tape tenacity” at least 6 g/denier, which is the process requirement. The determination of these interacting significant factors along with the optimum levels is the novelty of the research. These significant factors and levels, if adopted, will lead to lower sack rejection in the polypropylene bag manufacturing plants. This will have considerable economic as well as environmental implications by reducing material wastage and improved plant efficiency and profitability. Future research relevant to this project could be a multi-factor experimental design of the extrusion process. The current research project considered only two levels of each input factor of the extrusion process, which could be considered as the project limitation. Three or more levels of factorial analysis could bring further in-depth insights, which is left as future work.
Author contributions
All authors contributed equally to this research study.
Conflicts of interest
Declare conflicts of interest or state “The authors declare no conflict of interest.”
Additional information
Funding
Notes on contributors

Qazi Muhammad Usman Jan
Mr. Muhammad Hamad Sajjad is currently a first year PhD student in Industrial Engineering program for Fall 2020 session at Polytechnique Montreal University, Canada. Recently, he completed his 5 years contract of working as an Instructor in the Department of Industrial Engineering, School of Engineering at Alfaisal University, Riyadh, Saudi Arabia. Before that, he has also worked as an Assistant Production Engineer in a PVC manufacturing unit in Pakistan, for almost 3 years’ where he gained experience of applied engineering problems. He has almost 8 years of teaching, research and administration experience. His research interests include Human factors and Ergonomics, Work System Design, and Lean Six Sigma implementation in Health sector.
References
- Alkahtani, M., Omair, M., Khalid, Q. S., Hussain, G., & Sarkar, B. (2020). An Agricultural Products Supply Chain Management to Optimize Resources and Carbon Emission Considering Variable Production Rate: Case of Nonperishable Corps. Processes, 8(11), 1505.
- Alkahtani, M., Omair, M., Khalid, Q. S., Hussain, G., Ahmad, I., & Pruncu, C. (2021). A COVID-19 Supply Chain Management Strategy Based on Variable Production under Uncertain Environment Conditions. International Journal of Environmental Research and Public Health, 18(4), 1662.
- Alkahtani, M., Khalid, Q. S., Jalees, M., Omair, M., Hussain, G., & Pruncu, C. I. (2021). E-Agricultural Supply Chain Management Coupled with Blockchain Effect and Cooperative Strategies. Sustainability, 13(2), 816.
- Asmuni, S., Hussin, N. B., Khalili, J. M., & Zain, Z. M. (2015). Public participation and effectiveness of the no plastic bag day program in Malaysia. Procedia-Social and Behavioral Sciences, 168, 328–22. https://doi.org/10.1016/j.sbspro.2014.10.238
- Banuelas Coronado, R., & Antony, J. (2002). Critical success factors for the successful implementation of six sigma projects in organizations. The TQM magazine, 14( 2): p. 92–99, https://doi.org/10.1108/09544780210416702.
- Benitez, Y., Forrester, L., Hurst, C., & Turpin, D. (2007). Hospital reduces medication errors using DMAIC and QFD. Quality Progress, 40(1), 38.
- Bora, R. R., Wang, R., & You, F. (2020). Polypropylene plastic recycling toward climate change mitigation and circular economy: Energy, environmental, and technoeconomic perspectives. ACS Sustainable Chemistry & Engineering, 8(43), 16350–16363. https://doi.org/10.1021/acssuschemeng.0c06311
- Brun, A. (2011). Critical success factors of Six Sigma implementations in Italian companies. International Journal of Production Economics, 131(1), 158–164. https://doi.org/10.1016/j.ijpe.2010.05.008
- Catherwood, P. (2002). What’s different about Six Sigma? Manufacturing Engineer, 81(4), 186–189. https://doi.org/10.1049/me:20020410
- Desai, D., & Prajapati, B. N. (2017). Competitive advantage through Six Sigma at plastic injection molded parts manufacturing unit. International Journal of Lean Six Sigma, 8(4), 411–435. https://doi.org/10.1108/ijlss-06-2016-0022
- Dora, M., & Gellynck, X. (2015). Lean Six Sigma implementation in a food processing SME: A case study. Quality and Reliability Engineering International, 31(7), 1151–1159. https://doi.org/10.1002/qre.1852
- Dora, M., & Gellynck, X. (2015). Lean Six Sigma implementation in a food processing SME: A case study. Quality and Reliability Engineering International, 31(7), 1151–1159. https://doi.org/10.1002/qre.1852
- Durbaca, I. (2015). New statistical approach “Six Sigma” as a solution for improving plastic quality products. Materiale Plastice, 52(1), 43–47. https://doi.org/10.37358/Mat.Plast.1964
- Eckes, G. (2002). The Six Sigma revolution: How General Electric and others turned process into profits. John Wiley & Sons.
- Elkin, P. L. (2008). Improving healthcare quality and cost with Six Sigma. In Mayo Clinic Proceedings. Elsevier, https://doi.org/10.4065/83.4.508-a.
- Fortenot, G., Behara, R., & Gresham, A. (1994). Six sigma in customer satisfaction. Quality Progress, 27(12), 73.
- Gaikwad, L. M., Sunnapwar, V. K., Teli, S. N., & Parab, A. B. (2019). Application of DMAIC and SPC to Improve Operational Performance of Manufacturing Industry: A Case Study. Journal of the Institution of Engineers (India): Series C, 100(1), 229–238. https://doi.org/10.1007/s40032-017-0395-5
- Gijo, E., & Antony, J. (2014). Reducing patient waiting time in the outpatient department using lean six sigma methodology. Quality and Reliability Engineering International, 30(8), 1481–1491. https://doi.org/10.1002/qre.1552
- Guinane, C. S., & Davis, N. H. (2004). The science of Six Sigma in hospitals. American Heart Hospital Journal, 2(1), 42–48. https://doi.org/10.1111/j.1541-9215.2004.02340.x
- Gutiérrez, L. G., Bustinza, O., & Molina, V. B. (2012). Six sigma, absorptive capacity, and organizational learning orientation. International Journal of Production Research, 50(3), 661–675. https://doi.org/10.1080/00207543.2010.543175
- Gutierrez-Gutierrez, L., De Leeuw, S., & Dubbers, R. (2016). Logistics services and Lean Six Sigma implementation: A case study. International Journal of Lean Six Sigma, 7(3), 324–342. https://doi.org/10.1108/ijlss-05-2015-0019
- Hann, M., Bower, P., Campbell, S., Marshall, M., & Reeves, D. (2007). The association between culture, climate and quality of care in primary health care teams. Family Practice, 24(4), 323–329. https://doi.org/10.1093/fampra/cmm020
- InayatHusen, P. R. (2015). Reducing Different Type of Wastage in Plastic Bag Making Process and Improving Productivity using Six Sigma DMAIC Methodology. Gh Patel College of Engineering & Technology.
- Kaid, H., Noman, M. A., Nasr, E. A., Alkahtani, M. (2016). Six Sigma DMAIC phases application in Y company: A case study. International Journal of Collaborative Enterprise, 5(3–4), 181–197. https://doi.org/10.1504/ijcent.2016.10003185
- Kang, C. W., Imran, M., Omair, M., Ahmed, W., Ullah, M., & Sarkar, B. (2019). Stochastic-petri net modeling and optimization for outdoor patients in building sustainable healthcare system considering staff absenteeism. Mathematics, 7(6), 499.
- Knapp, S. (2015). Lean Six Sigma implementation and organizational culture. International Journal of Health Care Quality Assurance, 28(8), 855–863. https://doi.org/10.1108/ijhcqa-06-2015-0079
- Kumar, M., Antony, J., & Tiwari, M. K. (2011). Six Sigma implementation framework for SMEs – A roadmap to manage and sustain the change. International Journal of Production Research, 49(18), 5449–5467. https://doi.org/10.1080/00207543.2011.563836
- Manuel, C. M. (2008). Under the knife: A national survey of six sigma programs in US healthcare organizations. International Journal of Health Care Quality Assurance, 25(6). https://doi.org/10.1108/09526860810900691
- Martin, N., & McLennan, S. (2005). Six Sigma: Customer-driven quality improvement with the bottom line in mind. Caring: National Association for Home Care magazine, 24( 10): p. 38.
- Muturi, D., Douglas, J., & Ochieng, J. (2015). Lean Six Sigma implementation in East Africa: Findings from a pilot study. The TQM Journal, 27(6). https://doi.org/10.1108/tqm-05-2015-0066
- Nawaz, R., Hussain, I., Noor, S., Habib, T., & Omair, M. (2020). The significant impact of the economic sustainability on the cement industry by the assessment of the key performance indicators using Taguchi signal to noise ratio. Cogent Engineering, 7(1), 1810383.
- Omair, M., Ullah, M., Ganguly, B., Noor, S., Maqsood, S., & Sarkar, B. (2019). The quantitative analysis of workers’ stress due to working environment in the production system of the automobile part manufacturing industry. Mathematics, 7(7), 627.
- Ping, C. Y. (2015). Optimization of Laser Cutting Parameter of Acrylic By using DMAIC Approach. UNIVERSITI TEKNOLOGI MALAYSIA.
- Schmidt, A., Sousa-Zomer, T. T., Andrietta, J. M., & Cauchick-Miguel, P. A. (2018). Deploying Six Sigma practices to General Electric subsidiaries in a developing economy: An empirical analysis. International Journal of Quality & Reliability Management, 35(2), 446–462. https://doi.org/10.1108/ijqrm-09-2016-0155
- Schmidt, A., Sousa-Zomer, T. T., Andrietta, J. M., & Cauchick-Miguel, P. A. (2018). Deploying Six Sigma practices to General Electric subsidiaries in a developing economy. International Journal of Quality & Reliability Management, 35(2), 446–462. https://doi.org/10.1108/IJQRM-09-2016-0155
- Schroeder, R. G., Sousa-Zomer, T. T., Andrietta, J. M., & Cauchick-Miguel, P. A. (2008). Six Sigma: Definition and underlying theory. Journal of Operations Management, 26(4), 536–554. https://doi.org/10.1016/j.jom.2007.06.007
- Seow, C., & Antony, J. (2004) Some pros and cons of six sigma: An academic perspective. The TQM magazine, https://doi.org/10.1108/09544780410541945.
- Shah, D., & Patel, M. P. (2018). Productivity improvement by implementing lean manufacturing tools in the manufacturing industry. International Research Journal of Engineering and Technology, 5(3), 3–7.
- Shanmugaraja, M., Nataraj, M., & Gunasekaran, N. (2011). Defect control analysis for improving quality and productivity: An innovative Six Sigma case study. International Journal of Quality and Innovation, 1(3), 259–282. https://doi.org/10.1504/IJQI.2011.040428
- Sivakumar, S., & Muthusamy, K. (2011). Critical success factors in Six Sigma implementation—A case study of MNCs in Malaysia. In 2011 IEEE International Conference on Quality and Reliability. IEEE, https://doi.org/10.1109/icqr.2011.6031597.
- Srinivasan, K., Muthu, S., Devadasan, S. R., & Sugumaran, C. (2016a). Six Sigma through DMAIC phases: A literature review. International Journal of Productivity and Quality Management, 17(2), 236–257. https://doi.org/10.1504/ijpqm.2016.074462
- Srinivasan, K., Muthu, S., Devadasan, S. R., & Sugumaran, C. (2016b). Enhancement of sigma level in the manufacturing of furnace nozzle through DMAIC approach of Six Sigma: A case study. Production Planning & Control, 27(10), 810–822. https://doi.org/10.1080/09537287.2016.1143130
- Swink, M., & Jacobs, B. W. (2012). Six Sigma adoption: Operating performance impacts and contextual drivers of success. Journal of Operations Management, 30(6), 437–453. https://doi.org/10.1016/j.jom.2012.05.001
- Tennant, G. (2001). Six Sigma: SPC and TQM in Manufacturing and Service Gower Publishers. https://doi.org/10.1108/msq.2001.11.2.142.1
- Timans, W., Ahausb, K., Solingenc, K., Kumard, M., & Antonye, J. (2016). Implementation of continuous improvement based on Lean Six Sigma in small-and medium-sized enterprises. Total Quality Management & Business Excellence, 27(3–4), 309–324. https://doi.org/10.1080/14783363.2014.980140
- Tsironis, L. K., & Psychogios, A. G. (2016). Road towards Lean Six Sigma in the service industry: A multi-factor integrated framework. Business Process Management Journal, 22(4), 812–834. https://doi.org/10.1108/bpmj-08-2015-0118
- Ullah, M., Asghar, I., Zahid, M., Omair, M., Al Arjani, A., & Sarkar, B. (2021). Ramification of remanufacturing in a sustainable three-echelon closed-loop supply chain management for returnable products. Journal of Cleaner Production, 290, 125609.
- Wilcox, C., Van Sebille, E., & Hardesty, B. D. (2015). the Threat of plastic pollution to seabirds is global, pervasive, and increasing. Proceedings of the National Academy of Sciences, 112(38), 11899. https://doi.org/10.1073/pnas.1502108112
- Yadav, G., Seth, D., & Desai, T. N. (2018). Application of the hybrid framework to facilitate lean six sigma implementation: A manufacturing company case experience. Production Planning & Control, 29(3), 185–201. https://doi.org/10.1080/09537287.2017.1402134
- Zahraee, S. M. (2016). A survey on lean manufacturing implementation in the selected manufacturing industry in Iran. International Journal of Lean Six Sigma, 7(2), 136–148. https://doi.org/10.1108/ijlss-03-2015-0010
- Zu, X., Fredendall, L. D., & Douglas, T. J. (2008). The evolving theory of quality management: The role of Six Sigma. Journal of Operations Management, 26(5), 630–650. https://doi.org/10.1016/j.jom.2008.02.001