
Abstract
This work aims to evaluate the provision of energy services in non-interconnected zones (NIZ) between 2018 and 2019 using open data from the Colombian government and business intelligence methodology. The analysis is approached from the ETL (Extract, Transform, Load). It focuses on the variables obtained from the National Monitoring Centre (CNM) for monitoring the operation of these zones, where there is a Telemetry System that provides monthly information on location variables, energy variables, such as active and reactive energy maximum power, maximum power per day, and hours of service delivery. We concluded that in the years, 2018–2019 energy consumption in NIZ has remained stable with a variation of 0.19%. On the other hand, the NIZ include 56% of Colombia’s states, and the energy consumption is concentrated in 6 of the 93 municipalities with 80% of national consumption. The challenges in these areas are associated not only with the quality and provision of energy services but also with the environmental challenges that mean that most of these areas obtain their energy supply from fossil fuels, being protected areas such as ecological reserves, the biosphere, or the jungle.
PUBLIC INTEREST STATEMENT
This work aims to evaluate the provision of energy services in non-interconnected zones (NIZ) between 2018 and 2019 using open data from the Colombian government and business intelligence approach. The NIZ include 56% of Colombia’s states. Their challenges are associated not only with the quality and provision of energy services but also with the environmental challenges that mean that most of these areas obtain their energy supply from fossil fuels, being protected areas such as ecological reserves, the biosphere or the jungle.
1. Introduction
Data analysis plays an essential role in generating knowledge, obtaining patterns, and predictions important for strategy formulation. Business intelligence (BI) is a methodology to get information from an organisation or process systematically to allow stakeholders (mainly strategic and tactical levels) to understand the organisation’s dynamics from the data to make informed decisions.
BI encompasses a wide variety of software applications and processes that enable organisations to, among other things, collect data from various sources, evaluate it, and prepare it for analysis, develop and run queries, create reports, dashboards, and data visualisations to answer specific questions for making and implementing business decisions (TechTarget, Citationn.d.).
BI allows to optimise the management data and information of the company, follow up the fulfillment of the goals in the medium- and long-term, and improve the capacity of response and decision-making to obtain higher efficiency (ORACLE, Citationn.d.).
Within the BI architecture, the interaction between its components is important (Brannon, Citation2010) describes the importance of four parts for BI, which are explained as follows: a) System source: define the data to be obtained, identify the types of data available and the characterisation of the data; b) Data acquisition: it consists of a process of data extraction in a single repository; c) Storage: where the information through data cleaning processes is stored; d) Reporting: tools allowing the analysis of information, from reports, dashboards, queries, dynamics supported by statistical or predictive analysis.
The Non-Interconnected Zones (NIZ) are the areas that do not have access to the National Interconnected System of energy (SIN) in Colombia and are the municipalities, townships, localities and off-grid villages where about 3.04% of the population of Colombia lives and comprises about 66% of the national territory which, due to geographical and environmental conditions, are isolated from the SIN, where the energy to supply the needs of its inhabitants must be generated in the same zone.
The companies providing public electricity service located in the NIZ can develop, in an integrated manner, the activities of generation, distribution, and commercialisation whose formulas to determine the costs of these activities are established by the Energy and Gas Regulation Commission (CREG). The NIZ electricity is provided mainly by diesel generation plants, solar panels, and small hydroelectric plants, depending on each zone conditions and generation potential.
This paper presents a business intelligence analysis of the current state of service provision in the Colombian non-interconnected zones, using information from the National Monitoring System available on governmental open data portal. The methodology used for data analysis is ETL approach (Extract, Transform, Load), showing the results in each of the following stages: data characterisation, findings of the data cleaning process, selection of variables of interest, and dashboard design using the Power BI tool.
The discussion shows the analysis of results regarding the location of NIZ, energy consumption at the national and regional levels, and hours with no service. Finally, the conclusions exposed the importance of open data quality to facilitate its use by researchers and the challenges regarding energy access in non-interconnected areas.
2. Conceptual reference
2.1. Business intelligence
Business Intelligence (BI), according to (Tdwi, Citation2005), is the methodology that comprises processes, tools, and technologies to manage data in information and knowledge information to improve understanding of the dynamics of the organisation and support decision-making based on back end technologies, such as data warehousing and processes in the “front end” to generate queries, reports, analysis and tools to display information as shown in .
Figure 1. Business intelligence elements
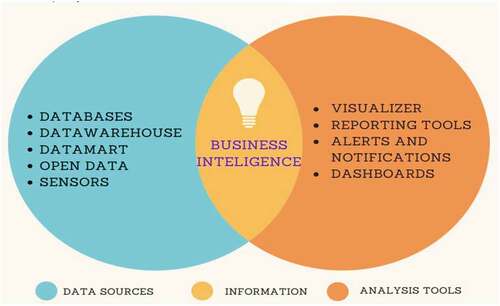
Business intelligence solutions generate competitive and strategic advantages for organisations by increasing profits, improving efficiency, optimising processes, saving time and costs, and impacting decision-making. Information systems based on emerging technologies have high efficiency and capacity to capture, store and process data. BI tools make it easy for the user to create queries, analyse data using techniques such as data mining and statistical analysis, as well as forecasting (Bhatiasevi & Naglis, Citation2020).
The amount of data is increasing; therefore, the functionality of analysis and visualisation of data in an easier way through flexible and interactive reports to better understand the information and its impact on the business is very relevant. The organisations need agile access to the information underlying these systems, and the ability to analyse data in real-time for strategic decisions is one of the potentials of business intelligence (Turan & Ugur, Citation2018). BI provides integrated data that management draws upon to improve decision-making scenarios and deliver valuable information to organisations’ tactical and operational levels.
We consider relevant references for Business Intelligence and its application in the energy sector where two trends can be identified:
Oriented to strategic aspects of the sector: Muntean et al. (Citation2021) designed a process to develop information artifacts, which are the essence of a business intelligence & analytics system, to monitor the SDG 7 about SDG 13 indicators; Schinkinger (Citation2020) explores how data analytics can be performed in real-time and help companies in decision making, sales, and strategy development by turning data into information and gaining new insights from it for energy suppliers; (Zia et al., Citation2019) describe outputs which may include the system feasibility, greenhouse gas emissions, cumulative financial costs, natural resource use; (Harison, Citation2012) based on the analytical framework, possible technical, organisational, and personal factors that affect the failure, partial or full success of BI system implementations are discussed and Argotte et al. (Citation2009) present a comprehensive survey related to the BI applications for the Energy Markets (EM) to show trends and useful methods for tackling everyday EM challenges.
Oriented to operational aspects: Pinheiro et al. (Citation2020) deal with BI application, data visualisation tools to analyse the improvement of energy efficiency in residential buildings in Portugal; a data-driven methodology is used by (Lin et al., Citation2020) that will leverage individual energy consumption, available customer demographic data, third-party data, and innovative open-source data sets; while (Flieder, Citation2012) focuses on transparency of energy consumption through a targeted analysis by making use of business intelligence and (Gawin & Marcinkowski, Citation2017) provide a foundation for holistic analyses, optimisation, and forecasting of electrical power consumption within facility management for retail facility networks.
Business intelligence platforms are tools to assist in the analysis and visualisation of data. While all platforms have similar functionalities, they also differ in others. Each platform has strengths and weaknesses, advantages and disadvantages, so it is complex to adopt one or the other.
For the implementation of a BI model, the software’s necessary characteristics must have for the visualisation of results must be taken into account. (Ali et al., Citation2016) presents some characteristics on which to compare different tools used to perform BI, and is a comparison of the most relevant software tools for its analysis:
Table 1. Software business intelligence
It is necessary to specify that regarding the challenges (Turan & Ugur, Citation2018) he explains that “companies expect to obtain competitive advantages by adopting BI applications, but these benefits can vary significantly depending on the individuals within the company who are the end-users.
While the decision to adopt BI applications is typically made at the organizational level, the ultimate success of the BI program and the effective use of BI applications is determined by the individual users and, in particular, by individual factors” and (Hasan et al., Citation2016) has identified some challenges to implementing a Business Intelligence solution such as the definition of business objectives, data management, limited funding, training, and user acceptance, taking into account that BI is still in the know-how, the acceptance of the new technology becomes a significant barrier in the adoption process.
Two objectives of applying BI are consistency and transformation; the organizations adopting BI for data consistency use a comprehensive data collection strategy, while organizations adopting BI for transformation use a problem-driven data collection strategy (Ramakrishnan et al., Citation2011).
2.2. Open data
Open Data generally refers to accessible information to everyone, machine-readable, available online, at zero cost, and with no limits on reuse and redistribution. Advances in information technologies and their growing adoption by public administrations through e-government and now intelligent government strategies have allowed a large amount of data from a wide variety of sources to be collected, processed, disseminated, and preserved. As mentioned by (Naser & Concha, Citation2012), “All data produced by public administrations, are public data and only the data available online in open, usable, reusable formats and under open licenses will be really public.” While the concept of open data is directly related to open government, it is important to emphasise that open data is seen as an essential enabler of open government, contributing to its characteristics of transparency, collaboration, and participation.
The concept of Open Government Data (OGD) is a working philosophy to empower citizens and grant them access and license to use data generated by public entities to use, store, redistribute and integrate with other data sources (Solar et al., Citation2012). This is promoted under the premise of open government to promote democratisation, motivate citizen participation, and generate innovation, development, and research from open data. For (Attard et al., Citation2015), OGD is a subset of open data, and it is the data generated and related to government that is open and accessible to all in general (Kučera et al., Citation2013) to be used by citizens to add value. OGD can include budget information, spending, population, census, geographic information, public services, and national statistics.
3. Methodology
The BI process includes phases such as: identification of information needs, data acquisition, storage and analysis of information. BI manages raw data to be analysed according to established criteria and processed through human analysis in order to generate information that adds value to the organisation(Bouaoula et al., Citation2019).
The methodological process assumes the ETL (Extract, Transform, Load) approach, as presented in .
Figure 2. ETL methodology
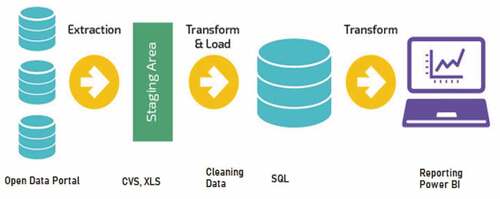
Adapted from https://www.analytics.cl/analytics/las-ventajas-del-data-warehouse/
Extraction: corresponds to the obtaining of data from the various sources (web, CRM, databases, sensors) to be stored in a database.
Transform: it is the stage where data from different sources are evaluated, cleaned, and transformed according to the requirements of the organisation. The data warehousing is defined, the data from different datasets are normalised, and the entity-relationship model of the databases to be analysed is established.
Loading: once the data is cleaned and transformed, it is loaded into the data warehouse, where it will be stored as new dataset updates are generated.
Reporting: the visualisations of the variables of interest for the interested parties are designed.
The following is a description of the activities of the methodology based on the proposal by (Balachandran & Prasad, Citation2017):
Figure 3. Dataset description
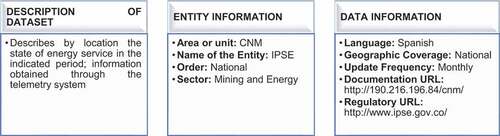
Table 2. Datasets NIZ- Colombia
Table 3. Data quality findings
4. Results
4.1. Extracting
For the process of applying Business Intelligence, data is obtained on the status of service provision in different non-interconnected zones (NIZ) in Colombia identified by the Institute for Planning and Promotion of Energy Solutions for Non-Interconnected Zones (IPSE), and monitored by the National Monitoring Centre (CNM), which have telemetry. shows the metadata of each dataset corresponding to the data and the entity that manages it.
These datasets were collected from the national government’s open data system (https://datos.gov.co/), where the monthly report of the CNM is stored giving an account of each of the municipalities of the NIZ. The variables related to the state of the provision of the electrical energy service are measured. The evolution of the datasets from 2017 to date is shown in .
At the end of the data extraction process from the open data portal, a total of raw data is recorded as follows: 31 datasets (CVS files), an average of 80 records per month representing information from at least 13 fields corresponding to 2017–2019. For this study, it is of interest to analyse: Municipality, Location, Period, Active Energy [kWh], Reactive Energy [kVARh], Maximum Power [kW], Maximum Demand Day, Maximum Demand Date, Average Daily Service Hours.
4.2. Transforming
Once the information from the open data portal was collected, a single dataset was generated for 2017–2018. When analysing the obtained datasets, some difficulties for data integration were identified. For data integration and quality, the Practical Manual for Improving the Quality of Open Data is taken as a reference (Gobierno De España, Citation2017) and some quality criteria of the Ministry of Information Technology of Colombia (Ministerio de Tecnologías de la Información y las Comunicaciones de Colombia, Citation2020) as shown .
Given the above findings, the following activities are carried out for data integration and cleaning:
Unification of data types for the variables
Encoding definition for Spanish characters (UTF-8)
Verification and standardisation of units of measurement mainly for energy
Calculation of a new variable (average daily hours with no service)
Correction of incorrectly reported numerical data.
Identification of null, empty and missing data.
After each dataset’s cleaning process (normalisation of data types, identification of outliers, null, empty, or inconsistent data), it was stored in a single dataset, with 29,003 data (13 fields X 2231 records). There were 1388 empty and zero data, which represents approximately 4.38% and 167 empty records were found, representing 7% as follows: 88 in 2017, 69 in 2018, and 10 in 2019 showing that the completeness of the data has been improving.
The null or empty data by months are reported mainly due to failures in the measurement system. For the six states that have the highest percentage of active energy, which represents 90% of the national total, the previous year’s data is taken as a reference; the other municipalities are eliminated since they do not significantly affect the trends in the national analysis.
4.3. Load
The Business Intelligence process regarding the provision of energy services in non-interconnected zones was carried out in the Power BI software, establishing the entity-relationship model and loading the datasets after the cleaning process.
Figure 4. Entity-relationship database model
We obtained an overview of the relevant tools to perform descriptive data analysis and Business Intelligence (BI) through of . Considering the characteristics of the tools and their implementation costs, disadvantages, and advantages, Microsoft’s Power BI tool was selected in its free version.
This software is currently leading the Business Intelligence market, it is an easy to learn tool with a powerful language of data analysis expressions, useful to get the most out of the information.
Once the information was organized and consistent in the software, the variables of interest were selected:
Location
Active energy
Reactive energy
Maximum Power
Maximum demand day
Daily hours of no energy service by location,
4.4. Visualisation
The objectives for the visualization were defined, and the dashboard was designed as shown in
Figure 5. Dashboard design
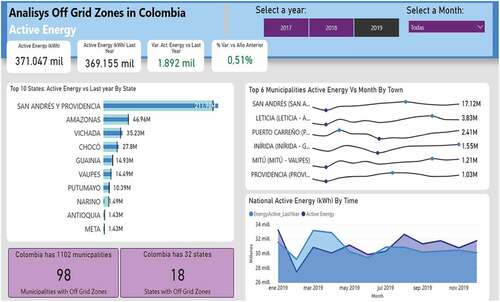
For this visualisation, the objectives are as follows: Identify non-connected areas of Colombia and their distribution in the Colombian territory, Analyse energy consumption by department and at the national level for 2018–2019, and Identify the areas with the most extended hours without service and the DAX used are
a)Active Energy = SUM(‘ZNI Telemetria años 17,18,19ʹ[Active Energy (kWh)])
b)EnergyActive_LastYear = CALCULATE([Active Energy],SAMEPERIODLASTYEAR(‘Calendar_2017-2019ʹ[Date]))
c)Var_AE Last Year = [Active Energy]-[EnergyActive_LastYear]
d)%Var AE Vs LastYear = DIVIDE([Var_AE Last Year],[EnergyActive_LastYear])
e)Municipalities with Off Grid Zones = DISTINCTCOUNT(‘ZNI Telemetria años 17,18,19ʹ[Town])
f)States with Off Grid Zones = DISTINCTCOUNT(‘ZNI Telemetria años 17,18,19ʹ[State])
g)HoursNoService_LastYear = CALCULATE([HoursNo Service],SAMEPERIODLASTYEAR(‘Calendar_2017-2019ʹ[Date]))
5. Discussion
5.1. Identification of NIZ
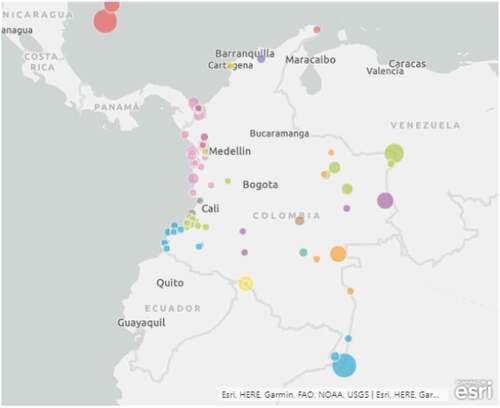
About the results obtained from data analysis, it can be identified that the Non-Interconnected zones of Colombia represent 56% of the national territory (18 of 32 departments) and 9% of the municipalities (98 of 1102), concentrated mainly in the Pacific Coast region (Chocó, Cauca and Nariño) and the Amazon region (Caquetá, Guainía, Guaviare), Putumayo, Vaupés and Vichada), and the Caribbean the department of La Guajira. All these zones are border areas (mainly with Venezuela, Brazil, Ecuador), being biodiverse territories, located far from the center of the country, having problems due to conflict situations and being regions that lag behind the country’s poverty and economic development indicators.
Figure 6. NIZ location in Colombia: active energy per town and state
According to information from DANE (National Administrative Department of Statistics), between 2016 and 2018, 1.1 million people entered multidimensional poverty, with Guainía (65.0%), Vaupés (59.4%), Vichada (55.0%), La Guajira (51.4%) and Chocó (45.1%) topping the list. Concerning monetary poverty, reviewing the population’s economic levels, the poorest regions of the country are Chocó, where 61.1% of the population is classified as poor according to this indicator, followed by La Guajira (53.7%); Cauca (50.5%); as the regions with the largest population that have obstacles in accessing basic needs and quality of life elements (Becerra, Citation2019), among these needs is access to energy.
About the characteristics of the territory, it should be noted that San Andrés and Providencia’s department is part of the Seaflower Biosphere Reserve, the largest in the world. Biosphere reserves are areas of terrestrial or coastal/marine ecosystems or a combination thereof, recognized internationally under UNESCO’s Man and the Biosphere (MAB) program (MinAmbiente et al, Citationn.d.). On the other hand, the municipalities of Leticia, Puerto Carreño, and Mitú are part of the Amazon rainforest that supplies moisture to all of South America, contributes to the stabilization of the global climate and has the highest biodiversity in the world (Gentry, Citation1986). Approximately 6.3% of Chocó is protected by ecological reserves and national parks.
In other words, these areas of great importance for climate change are at high risk due to the current conditions of electric power generation, where the probability of accidents that could endanger the delicate ecosystem of the BVI territories with possible impacts at a global level is increased.
Additionally, according to research by the foundations: Ideas for Peace, Insight Crime, Peace and Reconciliation, has collected data from the authorities to identify which areas are most affected by the conflict where Non-Interconnected zones, such as Nariño, Cauca, Chocó, Vichada, Guainía, Caqueta and Putumayo and La Guajira are located (Redacción, Citation2018).
5.2. Energy comsumption
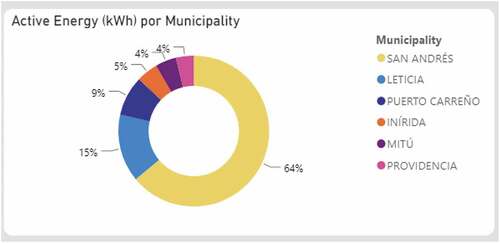
About energy consumption at the national level in NIZ , according to the national monitoring system, 80% of the consumption is represented in 6 of the 18 departments in which this consumption is mainly concentrated in 6 of the 98 municipalities in this way: San Andrés accounts for 54% of national consumption, followed with a considerable difference by Leticia with 12%, Puerto Carreño with 7% and Mitú and Providencia each with 4%, and the remaining 33% is distributed in the remaining 92 municipalities.
Figure 7. Energy consumption by municipalities
It should be noted that to supply the previous demand for energy is provided in most of these municipalities with the use of fossil fuels (diesel generation plants). For example, a study by the Inter-American Development Bank (BID & De, Citation2016) estimated that 15 million gallons of diesel are required per year to operate the 18 generation units distributed around San Andres and Providencia, using one million gallons. This situation increases the damage to environmental conditions.
The national consumption of the NIZ with telemetry was estimated for 2018 at 369.15 MW, for 2019 it was 371.04 MW which represents a variation of 0.5%, as shown in , which maintains a similar consumption in both years and the days of maximum demand in the week according to the data are Thursday and Saturday mainly after 7:00 pm
Figure 8. National energy consumption 2018–2019
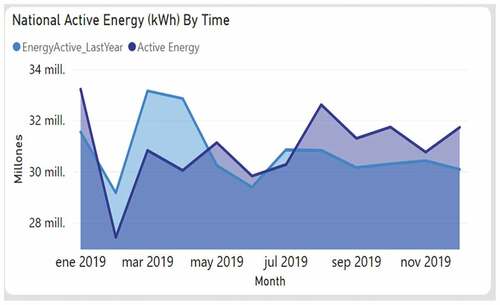
Figure 9. Top 6: total energy consumption by states in 2019
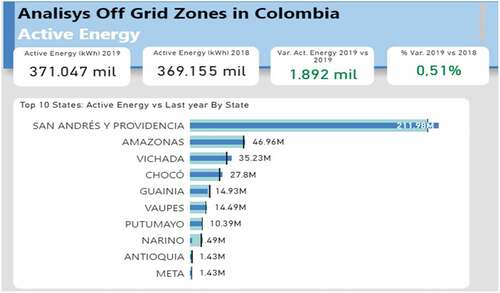
The states of San Andres and Providencia had a consumption of 211.98 MW, Amazonas of 46.96 MW, and Vichada of 35.23 MW, which represents the highest energy consumption of the country, which is 90%. This consumption corresponds to their capital cities, which have a more significant number of inhabitants and are the only economical, commercial, and health centers in these areas. San Andres has an average monthly consumption of 16.6 MW, Leticia of 3.78 MW, and Puerto Carreño of 2.19 MW ).
Figure 10. Top 6: average consumption by municipality in 2019
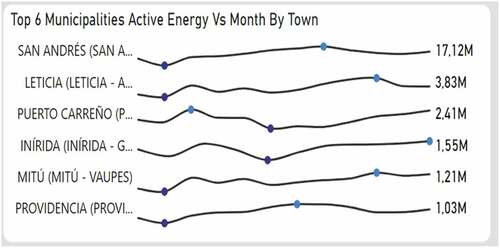
We can observe a decrease in energy demand in the months of February 2018 and 2019, where in general the trend at the national level is a drop in active energy in these particular months as shown in , and in particular, for San Andres and Amazonas representing 66% of the demand are zones highly dependent on tourism, where the months with the highest occupancy and tourism visits are December, January and July, and those with the lowest tourism are February and May, according to tourism statistics,Footnote6 and in the 2 years analysed these months have a similar behaviour.
On the other hand, given the biodiversity of these territories is tourist attractions of national recognition, for example, San Andres and Providencia’s islands are one of the leading destinations of Colombia in which during 2018 and 2019 exceeded one million visitors. According to the Hotel and Tourism Association of Colombia-COTELCO, hotel occupancy in 2019 was 57%, 1.5% more than in 2018, and San Andres leads the indicators of higher hotel occupancy in 2019 with 71.6% (MinICT; MinICT & De Industria, Citation2020). Similarly, in Leticia, the tourism has increased significantly, especially in the last 6 years reaching 90,000 visitors per year. Regarding the growth projections for this sector, Amazon has been positioned as a tourism alternative for locals and foreigners, and the accommodation capacity of Leticia grew by 20% since 2017 (Portafolio, Citation2018), which is reflected in these two municipalities representing 66% of national demand for the Non-Interconnected Zones of Colombia ).
5.3. Hours without service
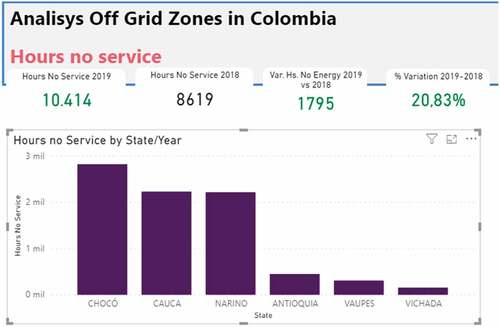
Regarding the hours without services nationwide, a total of 10,414 hours was estimated for 2019 and 8,619 hours for 2018.
According to the reported data, there is a 20.8% variation compared to the previous year, as shown in . As for hours without services at the national level, it is estimated that there will be a total of 10,414 hours in 2019 and 8,619 hours in 2018. These unserved hours are mainly concentrated in the departments of Chocó (21.7%), Cauca (21.4%), and Nariño (21.3%), which represent 70% of the unserved hours nationwide. These states are located on the Pacific coast of Colombia, and the municipalities with the most hours without service are Tumaco, Timbiquí, López, Ungía, and Bojayá, which account for 47% of the total national daily hours reported
Figure 11. States with longer hours without service
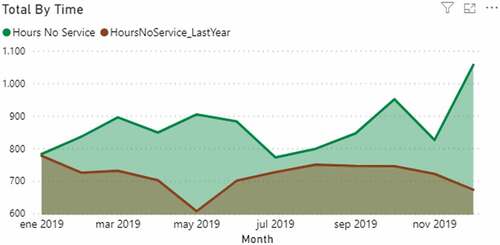
According to , the month with the most hours without service in 2018 was January, and for 2019 was December, and the month with the least hours without service in 2018 was May, and for 2019 was July. On the other hand, it shows an increase in the total number of hours without service from 2018 (8619 hours) to 2019 (10,414 hours), represented by a 20.8% variation.
Figure 12. Hours without service nationwide in 2018–2019
Finally, we can observe that in Colombia, there are localities with more than 10 hours without daily access to energy.
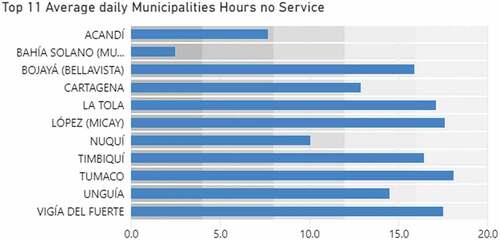
These municipalities are isolated areas and belonging to the Pacific coast, which directly impacts these communities’ quality of life and welfare.
6. Conclusion
Colombia has significant challenges related to the provision of services in the so-called Non-Interconnected Zones (NIZ) where roughly two million people do not have access to energy with high levels of poverty and violence. Furthermore, these zones are exposed to high environmental risks due to their power generation based on fossil fuels
Additionally, it is evident that although there is a continued energy consumption between 2018 and 2019, San Andres and Providencia along with Amazonas and Vichada, are the determinants of consumption at a national level of the NIZ. For this reason, it is necessary to join efforts to diversify the energy matrix of these areas and promote renewable energy due to the special conditions of these territories with regard to the environmental impact.
The Colombian government and public bodies must advance in the generation of open quality data that allows for more efficient their use for research processes. The challenges associated with accuracy, traceability, and availability are critical to exploit these data and facilitate them from the academia and the public sector to create value for the data.
For future work, it is expected to analyse other contextual information of these areas, such as population, some environmental and geographical conditions that are available as open data to generate different types of analysis and perform predictive data analysis of variables, such as energy consumption, hours without service, maximum power from the data being analysed and to create a web platform to facilitate this analysis.
Acknowledgements
The authors are grateful for the support of the Universidad Cooperativa de Colombia, the Royal Academy of Engineering and the Newton Fund of the United Kingdom through the funding of the research project “Enhancing Aquatic Renewable Energy (ARE): Technology design and adaptation program for Colombia” IAPP18-19\90 and the Partners Voor Water fund of the Dutch Government through the project Sustainable Water by floating solar energy powered Efficient reverse osmosis Treatment (SWEET).
Additional information
Notes on contributors

Ramón Fernando Colmenares-Quintero
Ramón Fernando Colmenares-Quintero is currently the national head of research in engineering and Professor Dr. at UCC with research focus on energy generation/distribution, simulation and modelling in the energy field.
Gina Paola Maestre-Gongora
Gina Maestre-Góngora. Received a PhD degree in systems engineering and computation. Her research interests: Smart Cities, IT Management, Data Analysis, EA, and IT Project Management.
Lina Judith Pacheco-Moreno
Lina Judith Pacheco Moreno She is a student of Software Engineering Program at the UCC. Member of BERSTIC research seedbed participating in projects related to business intelligence applied to energy.
Natalia Rojas
Natalia Rojas has a degree in Civil Engineering and an MSc in Marine Renewables, works for Aquatera bringing knowledge and expertise in energy engineering.
Kim E. Stansfield
Kim E. Stansfield got a PhD in Composites from Kingston University. He was sustainable energy systems transformation planner at the UK ETI. Joined Warwick WMG in 2016.
Juan Carlos Colmenares-Quintero
Prof. Dr. Juan Carlos Colmenares-Quintero is the leader of the research group CatSEE from the IPC/PAS in Poland. His interests range from materials science/nanotechnology to photocatalysis and water/air purification.
Notes
1. https://public.tableau.com/en-us/s/
2. https://powerbi.microsoft.com/
3. https://www.ibm.com/products/cognos-analytics
4. https://www.pentaho.com/marketplace/
5. https://openrefine.org/
References
- Ali, S. M., Gupta, N., Nayak, G. K., & Lenka, R. K. (2016). Big data visualization: Tools and challenges. Proceedings of the 2016 2nd International Conference on Contemporary Computing and Informatics, IC3I 2016, 656–21. Greater Noida, India. https://doi.org/10.1109/IC3I.2016.7918044
- Argotte, L., Mejía-Lavalle, M., & Sosa, R. (2009). Business intelligence and energy markets: A survey. 2009 15th International Conference on Intelligent System Applications to Power Systems, ISAP ’09. Curitiba, Brazil. https://doi.org/10.1109/ISAP.2009.5352918
- Attard, J., Orlandi, F., Scerri, S., & Auer, S. (2015). A systematic review of open government data initiatives. Government Information Quarterly, 32(4), 399–418. https://doi.org/10.1016/j.giq.2015.07.006
- Gómez, J. R., Afanador, J. E. & Rodríguez, J. L. (2016). Hacia la sostenibilidad eléctrica en el Archipiélago de San Andrés, Providencia y Santa Catalina, Colombia: Análisis de alternativas | Publications. https://publications.iadb.org/publications/spanish/document/Hacia-la-sostenibilidad-eléctrica-en-el-Archipiélago-de-San-Andrés-Providencia-y-Santa-Catalina-Colombia-Análisis-de-alternativas.pdf
- Balachandran, B. M., & Prasad, S. (2017). Challenges and benefits of deploying big data analytics in the cloud for business intelligence. Procedia Computer Science, 112, 1112–1122. https://doi.org/10.1016/j.procs.2017.08.138
- Becerra, L. (2019). Así es el mapa de la pobreza en Colombia que debe sortear Iván Duque. Diario La Republica. https://www.larepublica.co/economia/asi-es-el-mapa-de-la-pobreza-en-colombia-que-debe-sortear-ivan-duque-2884637
- Bhatiasevi, V., & Naglis, M. (2020). Elucidating the determinants of business intelligence adoption and organizational performance. Information Development, 36(1), 78–96. https://doi.org/10.1177/0266666918811394
- Bouaoula, W., Belgoum, F., Shaikh, A., Taleb-Berrouane, M., & Bazan, C. (2019). The impact of business intelligence through knowledge management. Business Information Review, 36(3), 130–140. https://doi.org/10.1177/0266382119868082
- Brannon, N. (2010). Business intelligence and E-Discovery. Intellectual Property & Technology Law Journal, 22(7), 1–5. https://wenku.baidu.com/view/7cf2761b227916888486d728.html?re=view
- Iniciativa Aporta. (2017). Manual práctico para mejorar la calidad de los datos abiertos. Gobierno de España. https://datos.gob.es/sites/default/files/doc/file/manual_practico_para_mejorar_la_calidad_de_los_datos_abiertos_1.pdf
- Leal-Acosta, A. C. (2018). El Amazonas ya puede recibir el doble de turistas anuales | Tendencias | Portafolio. https://www.portafolio.co/tendencias/el-amazonas-ya-puede-recibir-el-doble-de-turistas-anuales-519934
- Flieder, K. (2012). Energy transparency by business intelligence. Productivity Management, 17(4), 33–34. http://www.productivitymanagement.org/archive.html
- Gawin, B., & Marcinkowski, B. (2017). Business intelligence in facility management: Determinants and benchmarking scenarios for improving energy efficiency. Information Systems Management, 34(4), 347–358. https://doi.org/10.1080/10580530.2017.1366219
- Gentry, A. (1986). Species richness and floristic composition of Choco Region plant communities. Caldasia, 15(71–75), 71–91. https://revistas.unal.edu.co/index.php/cal/article/view/35010
- Harison, E. (2012). Critical success factors of business intelligence system implementations: Evidence from the energy sector. International Journal of Enterprise Information Systems (IJEIS), 8(2), 1–13. https://doi.org/10.4018/jeis.2012040101
- Hasan, N. A., Rahman, A. A., & Lahad, N. A. (2016). Issues and challenges in business intelligence case studies. Jurnal Teknologi, 78(8–2), 171–178. https://doi.org/10.11113/jt.v78.9554
- Kučera, J., Chlapek, D., & Nečaský, M. (2013). Open government data catalogs : Technology-enabled innovation for democracy, government and governance, 8061, 152–166. Springer. https://doi.org/10.1007/978-3-642-40160-2
- Lin, J., Marshall, K. R., Kabaca, S., Frades, M., & Ware, D. (2020). Energy affordability in practice: Oracle Utilities Opower’s business Intelligence to meet low and moderate income need at Eversource. Electricity Journal, 33(2), 106687. https://doi.org/10.1016/j.tej.2019.106687
- MinAmbiente. (n.d.). Generalidades | ministerio de ambiente y desarrollo sostenible. Gobierno de Colombia. Retrieved June 19, 2020, from https://www.minambiente.gov.co/index.php/bosques-biodiversidad-y-servicios-ecosistematicos/reservas-de-la-biosfera
- MinComercio. (2020). Informes y estaditicas de turismo Colombia. Centro de Información Turistica -CITUR. https://www.mincit.gov.co/estudios-economicos/estadisticas-e-informes/informes-de-turismo
- MinTIC.(2020). Portal de datos abiertos de Colombia.
- Muntean, M., Dănăiaţă, D., Hurbean, L., & Jude, C. (2021). A business intelligence & analytics framework for clean and affordable energy data analysis. Sustainability, 13(2), 638. https://doi.org/10.3390/su13020638
- Naser, A., & Concha, G. (2012). Datos abiertos: Un nuevo desafío para los gobiernos de la región | Publicación | Comisión Económica para América Latina y el Caribe. Comisión Económica para América Latina (CEPAL). https://www.cepal.org/es/publicaciones/7331-datos-abiertos-un-nuevo-desafio-gobiernos-la-region
- ORACLE. (n.d.). ¿Qué es Inteligencia de Negocios? Retrieved May 14, 2020, from https://www.oracle.com/ocom/groups/public/@otn/documents/webcontent/317529_esa.pdf
- Pinheiro, L., Oliveira, P., Bernardino, J., & Pedrosa, I. (2020). Business intelligence applied in buildings energy efficiency. Iberian Conference on Information Systems and Technologies, CISTI, 2020-June. Seville, Spain. https://doi.org/10.23919/CISTI49556.2020.9141019
- Ramakrishnan, T., Jones, M. C., & Sidorova, A. (2011). Factors influencing business intelligence (BI) data collection strategies: An empirical investigation. Elsevier. https://doi.org/10.1016/j.dss.2011.10.009
- Redacción. (2018). Las zonas más afectadas por el conflicto | El Mundo. El Mundo. https://www.elmundo.com/noticia/Las-zonas-mas-afectadas-por-el-conflicto/369880
- Schinkinger, C. (2020). What business intelligence means to energy suppliers: The art of looking into the future. BWK energie, 72(12), 24–25. https://doi.org/10.37544/1618-193X-2020-12-24
- Solar, M., Concha, G., & Meijueiro, L., (2012). A model to assess open government data in public agencies bt – electronic government, H. J. Scholl, M. Janssen, M. A. Wimmer, C. E. Moe, & L. S. Flak (eds.), Springer Berlin Heidelberg. 210–221.
- TDWI. (2005). Enterprise business intelligence: Strategies and technologies for deploying bi on an enterprise scale (report excerpt) | Nce. https://tdwi.org/Articles/2005/10/13/Enterprise-Business-Intelligence-Strategies-and-Technologies-for-Deploying-BI-on-an-Enterprise-Scale.aspx?Page=1
- Stedman, C. & Burns, E. (2020). What is Business Intelligence (BI). Retrieved May 12, 2020, from https://searchbusinessanalytics.techtarget.com/definition/business-intelligence-BI
- Turan, A. H., & Ugur, N. G. (2018). Strategies for BI acceptance: Challenges and solutions. Pressacademia, 7(1), 237–240. https://doi.org/10.17261/Pressacademia.2018.888
- Zia, U. U. R., Zulfiqar, M., Azram, U., Haris, M., Khan, M. A., & Zahoor, M. O. (2019). Use of macro/micro models and business intelligence tools for energy assessment and scenario based modeling. 2019 4th International Conference on Emerging Trends in Engineering, Sciences and Technology, ICEEST 2019, Karachi, Pakistan. https://doi.org/10.1109/ICEEST48626.2019.8981691