
 ?Mathematical formulae have been encoded as MathML and are displayed in this HTML version using MathJax in order to improve their display. Uncheck the box to turn MathJax off. This feature requires Javascript. Click on a formula to zoom.
Abstract
As the world drives towards a resilient zero-carbon future, it is prudent for countries to harness their locally available renewable energy resources. This study has investigated the possibility of deploying a solar PV/Fuel cell hybrid system to power a remote telecom base station in Ghana. The study aims to lower the levelized cost of electricity (LCOE) and reduce greenhouse gas emissions produced from the hybrid power system. Hybrid Optimization Model for Electric Renewable (HOMER) software was used to conduct the viability analysis. The results show that the LCOE produced by the PV/fuel cell hybrid system is about 0.222 USD/kWh. This LCOE outshines the current average grid tariff (0.25 USD/kWh) paid by grid-connected telecom base stations. Moreover, the LCOE is 67% cheaper than the diesel power system at the site. Likewise, the LCOE is 30% cheaper compared to a PV/battery/diesel hybrid system. Furthermore, a switch to a PV/Fuel system saves nearly 43 tCO2/yr and 67 tCO2/yr than PV/battery/diesel and diesel power systems, respectively. Sensitivity analysis shows that the system LCOE is resilient to variations in the discount rate and capital subsidies. Based on these findings, off-grid telecom sites with insufficient wind and biomass resources could opt for a PV/fuel cell system since it has been shown to be more cost-effective than diesel generating power systems under locally available market data. The study findings are vital to stakeholders, decision-makers, policymakers, and investors in Ghana and worldwide to promote low carbon technologies.
PUBLIC INTEREST STATEMENT
Ghana has a plan to increase renewable energy installed capacity in the national generation mix to 1,363.63 MW by 2030. Therefore, exploring the possibility of harnessing all locally available renewable energy sources could help achieve this target. Presently in Ghana, base stations located in remote communities, islands, and hilly sites isolated from the utility grid mainly depend on diesel generators for their source of power. This study presents an analysis on deploying a PV/fuel hybrid system as a possible substitute for existing diesel power systems and even grid-connected base stations. The study has investigated the resilience of the hybrid system based on selected critical economic indicators. The study findings are pertinent to stakeholders, policymakers and investors towards utilizing low carbon technologies to achieve universal access to energy in Ghana.
1. Introduction
Electricity is an essential driver for economic growth and development. Thus, a nation’s development depends on the availability of electricity for consumption. The telecom sector relies on electricity to provide reliable services to potential customers.
The mobile telecom industry is among the strong penetrating businesses with outstanding improvement in Africa. (Hatsu et al., Citation2016). Ghana’s mobile telecom market is among the fastest-growing sectors due to its consistent and stable growth in recent years (Hatsu et al., Citation2016). Information, Communication Technology (ICT) contributed about 2.4% to Ghana’s Gross Domestic Product (GDP) for the year 2018 (Ghana Statistical Service, Citation2019).
Presently, there is swift attention to enhancing the energy efficiency of communication networks. According to Lambert et al. (Citation2013), global telecommunication networks’ power consumption rate is rising at a rate of 10% annually. ICT network operators account for about 600 TWh of global electricity consumed. This figure is projected to surge to about 1,700 TWh by 2030 (Humar et al., Citation2011). The telecom sector is responsible for its energy usage and greenhouse gases (GHG) emitted into the environment (Aris & Shabani, Citation2015). However, the global GHG produced from ICT matches those of the aviation industry (Postnote, Citation2008). ICT usage accounted for 0.53% of global CO2 emissions in 2015 and is expected to contribute about 3% to the global emissions for 2020 (Malmodin & Lundén, Citation2018; Postnote, Citation2008).
The mobile network operators (MNO) operating in Ghana are Scancom (MTN), AirtelTigo, Vodafone Ghana, and Globacom Ghana. The mobile voice subscriptions in Ghana surged from 17,436,949 subscriptions in 2010 to 41,113,131 at the end of June 2019 (NCA, Citation2020). However, this rapid surge is faced by expensive electricity for base stations found mostly in remote locations (Quansah et al., Citation2017). Furthermore, the rise in mobile voice subscriptions needs communication infrastructures such as cellular base transceiver stations (BTS) and towers to provide reliable network coverage in Ghana’s peri-urban and remote areas (NCA, Citation2010).
The swift increase in electricity demand, depletion of conventional fuels, depleting crude oil reserves, and environmental pollution has resulted in a keen worldwide interest in renewable energy (RE) resources for the power production and transportation sectors. Renewable energy is a perfect remedy for lowering and mitigating global GHG emissions (IRENA, Citation2015). Renewable energy is an environmentally friendly source of energy. It can provide reliable, affordable, and clean electricity for telecom base stations in remote areas lacking access to electricity (TH Energy, Citation2019). Renewable energy has attracted attention in most industrialized and emerging countries. Different policies and agreements have been signed to curb conventional fuels and promote renewable energy resources. The United Nation Framework Convention on Climate Change (UNFCCC) imposes on countries to protect the climate from hazardous human interference (UNFCCC, Citation1992). Also, the Kyoto Protocol enforces nations to reduce and limit GHG emissions by specific targets (UNFCCC, Citation2020). These policies and agreements give countries the urge to tackle the effect of climate change (UNFCCC, Citation2015). Ghana has drafted policies that promote and attract the deployment of renewable energy resources for potential investors. These policies make the country unique, with significant renewable energy regulatory and fiscal policies in Africa (Sakah et al., Citation2017). The Government of Ghana Renewable Energy Act 832 encourages developing and utilizing renewables for power and heat generation to diversify the national energy supply mix (Government of Ghana, Citation2011).
The intermittent nature of some renewable energy resources has impelled the development and deployment of hybrid power systems (HPS). Generally, HPS consists of not less than two power sources (e.g., solar/diesel, solar/fuel cell, solar/biomass/hydro, etc.), which work in a standalone or grid-connected form to attain a feasible and consistent power supply system (Aris & Shabani, Citation2015). HPS can address power system efficiency, reliability, fuel flexibility, and economics (Bajpai & Dash, Citation2012).
In Ghana, telecom base stations located in remote communities, islands, and hilly sites with no access to grid electricity mainly depend on diesel genset for their source of power. The combustion of diesel emits GHG, pollutes the environment, and negatively affects the climate. Investing in diesel genset is thrice expensive compared to grid electricity purchase (AfDB, Citation2016).
Presently, studies on hybrid power systems that incorporate fuel cell technologies exist in literature. For instance, Heydari & Askarzadeh (Citation2016) designed a PV/biogas/fuel cell hybrid system for Iran’s rural electrification. The study used the Loss Power Supply Probability (LPSP) technique to determine the system’s reliability. It was observed that minimizing fuel cell initial cost makes fuel cell technology promising for standalone systems. Ghenai et al. (Citation2018) optimized a PV/fuel cell system to electrify a house located in a desert area. The study aimed to yield a minimum electricity cost by minimizing GHG emissions. The hybrid system generates a low LCOE of 145 USD/MWh and produces zero CO2 emissions. Singh et al. (Citation2017) examined the financial viability of utilizing a hybrid system to meet the electrical load demand of an academic research building in Bhopal. The authors used a fuzzy logic program to estimate component capital and replacement costs and HOMER to size the hybrid system configuration. The study findings show electricity generation from the hybrid system is about 24,570.72 kWh, which has an LCOE of 0.203 USD/kWh. Özgirgin et al. (Citation2015) designed a solar PV/fuel cell grid-connected cogeneration hybrid system for a residential home. It was seen that integrating a hybrid power system into existing grid power offers a feasible prospect for powering standalone houses without polluting the environment. Dursun & Aykut (Citation2019) used HOMER to analyze a PV/fuel cell/wind turbine hybrid system to power a nursing home in Istanbul. It was estimated the optimal hybrid system sizing produces a competitive LCOE of 1.306 USD/kWh and an NPC of 607,298 USD. Also, an increase in solar radiation and wind speed strongly affected LCOE. Mohammed et al. (Citation2014) employed the LPSP concept and HOMER to design a solar PV/fuel cell power system to provide reliable electricity for Brest. The authors investigated that hybrid systems save about 1,390 kg of CO2 per annum. Furthermore, several works on hybrid power systems have been done to investigate and address electricity and environmental challenges associated with cellular base stations. Some of these notable works are summarized in . presents a review of studies on hybrid systems existing in literature for Ghana. It can be observed that only a few studies on hybrid power systems have been carried out for telecom base stations application in Ghana. The already existing studies for Ghana focused mainly on PV, battery, and diesel genset technologies. However, there are no feasibility studies in the open literature for Ghana that focus on employing solar PV/fuel cell hybrid systems to power telecom base stations.
Table 1. Related studies on hybrid systems for powering telecom base stations
Table 2. Review of existing studies on hybrid systems for Ghana
This study investigates the viability of deploying solar PV/fuel cell hybrid system to power telecom base stations in Ghana. Furthermore, the study tests the proposed power system resilience by comparing its technical, economic, and environmental performance to PV/diesel and diesel power systems. It is believed that the study findings will be valuable for stakeholders, policymakers, and investors as Ghana drives towards increasing its renewable energy capacity to 1363.63 MW by 2030 (Energy Commission, Citation2019).
2. Materials and method
2.1. Study area description and location
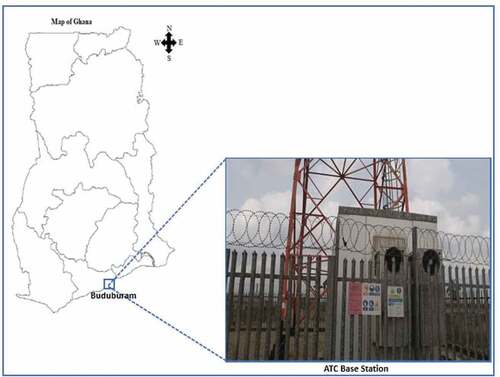
Buduburam ATC (American Tower Corporation) base station is the study area for this research. Buduburam is situated in the Gomoa East District in the Central Region of Ghana. The base station lies at latitude 5°52 N, longitude 0°47 W. The Gomoa East district depends on grid electricity (75.1%), kerosene lamps (16.4%), and flashlight/torch (5.7%) for lighting (Ghana Statistical Service, Citation2014). Buduburam ATC base station is isolated from the utility grid. Hence, it relies on diesel genset for its source of power. Gomoa East district experiences two main rainfall patterns. The first major pattern occurs between April and July and the minor one between September and November. Furthermore, it experiences a dry season from December to March (Ghana Statistical Service, Citation2014). shows the location of Buduburam ATC base station in the context of Ghana.
Figure 1. Map showing the location of the study area
2.2. Base station electrical load assessment
Primary data for base station electrical loads was collected by auditing electrical equipment/gadgets/appliances used at the base station. The base station electrical equipment/appliances in use at the site are summarized in .
Table 3. List of electrical appliances/equipment for base station load assessment
The daily electrical load is computed as follows:
where ELoad is the estimated electrical load in kWh/d. Prating represents power rating (W) for the electrical appliances, Qty represents the total quantity of appliances/equipment, and t represents usage hours of the electrical appliance/equipment in hr/d.
2.3. Resource assessment
The locally available renewable energy resources available at the study sites are solar, wind, and biomass. However, the site’s annual average wind speed is about 3.0 m/s, low for substantial wind power generation. Also, the primary biomass resources available are mainly cassava and plantain residues. However, crop residues for biogas production require attention. Furthermore, the collection of biomass feedstock for anaerobic digestion would be a challenge to sustain the system. Thus, hybridizing solar PV and fuel cells is ideal since the other resources are insufficient for reliable power generation. However, fuel cells are expensive and still attracting attention on the African continent, but they have already been tested and deployed in African countries like Kenya and South Africa (Crouch, Citation2011). This implies that it is prudent to access its technical and economic performance in Ghana’s context for future deployment.
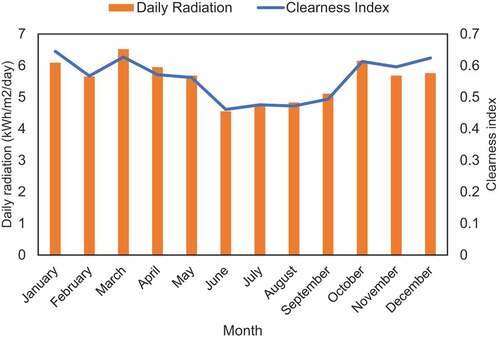
Ground data for solar resources was unavailable during this study. Hence, recent solar resource data was retrieved from the PVGIS-5 geo-temporal irradiation database for Buduburam located at latitude 5°52 N, longitude 0°47 W. The database provides solar resource data from 2005–2016. The annual average daily solar irradiation and clearness index available at Buduburam is about 5.56 kWh/m2/day and 0.56. The clearness index determines the clearness of the atmosphere. The months of June, July, August, and September have a low daily average low solar irradiation and clearness index, as shown in . These low solar irradiation and clearness index values are due to frequent rain and cloudy atmosphere at Buduburam during that season.
Figure 2. Clearness index and solar global horizontal irradiation for Buduburam
2.4. Hybrid system sizing with HOMER software
In this study, Hybrid Optimization Model for Electric Renewable (HOMER) software is utilized to model and size the hybrid power system. HOMER was selected because it is one of the most widely used software to design and analyze hybrid renewable energy systems (Okedu & Uhunmwangho, Citation2014). HOMER’s powerful optimizing function quickly estimates several hybrid system scenarios. Furthermore, its optimization and sensitivity analysis algorithms determine several possible system configurations (Okedu & Uhunmwangho, Citation2014). HOMER is utilized to accomplish three tasks: simulation, optimization, and sensitivity analysis, as shown in . During the simulation, HOMER models the system by running each system for one year every hour to determine the power systems that meet the electrical loads and constraints assigned to it. In optimization, HOMER decides the most cost-effective way to meet the electric load under technical, economic, and system conditions. Sensitivity analysis helps to investigate the impact of variation in input parameters on system performance (HOMER Energy, Citation2016). below displays comprehensive steps utilized in HOMER software for this study.
Figure 3. Steps utilized in HOMER software
2.4.1. Proposed hybrid power system operating strategy
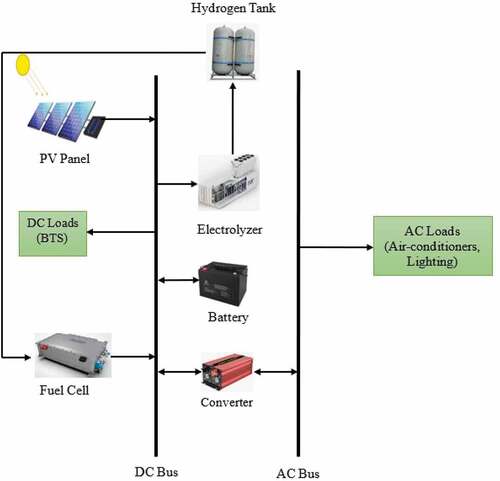
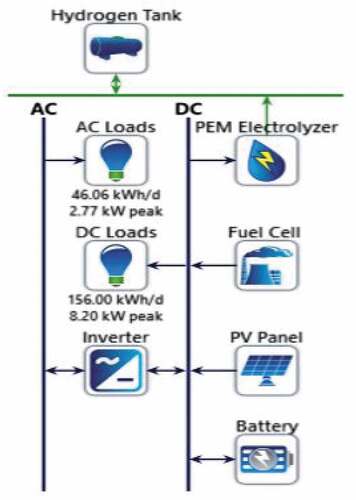
The proposed hybrid power system consists of PV panels, electrolyzer, hydrogen tank, fuel cell, battery, converter, AC bus, DC bus, and AC and DC loads, as shown in . The electrolyzer uses electricity generated from PV panels to split water into hydrogen and oxygen. After that, hydrogen tank stores produced hydrogen fuel. The stored hydrogen fuel is injected into the fuel cell to produce electricity. The PV and fuel cell systems operate concurrently to power the base station loads. The base station operates 24 h/d; hence, there should be a continuous electricity supply to meet electrical loads. The PV panels generate electricity to meet electrical loads but cannot work at night due to sunlight’s unavailability. Also, the PV panels charge the battery with excess electricity produced. During the night, electricity generated from the fuel cell meets the electrical loads. The battery bank, which acts as a backup power source, is required to compensate the fuel cell to meet electrical loads when there is insufficient solar radiation caused by rains and a cloudy atmosphere in the day.
Figure 4. The layout of the proposed hybrid power system
2.4.2. Hybrid power component specifications and cost details
2.4.2.1. Solar photovoltaic array
HOMER computes the PV array output using Equationequation 2(2)
(2) :
Where Rpv represents PV rated capacity (kW) under standard test conditions (STC), Upv represents PV derating factor (%), is the incident solar irradiation on PV panel (kW/m2),
,STC is the incident solar irradiation at STC (1 kW/m2),
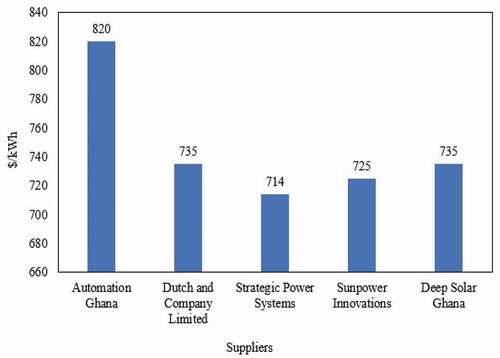
p represents temperature coefficient (%/oC), Tc represents PV cell temperature (oC), and Tc, STC is the PV cell temperature under STC (25 oC). In this study, PV panels would be mounted at a fixed angle equal to the study site’s latitude value. The azimuth, which defines the sloping direction, is 0° west of south. Also, the derating factor responsible for losses, shading, etc., is taken to be 80%. Furthermore, ground reflectance, which accounts for the percentage of solar radiation reflected, is taken to be 20%. A typical PV panel lifespan of 25 years is considered. The PV capital and replacement costs comprise the cost of panels, accessories, wiring, and labour. Globally, the cost of PV panels has declined drastically over the years due to advancements in solar cell efficiency and the rate at which new projects are being commissioned at a low absolute cost level (IRENA, Citation2019). At present, local and multinational companies exist in the Ghanaian market responsible for supplying PV systems. For this study, the cost of PV panels and accessories (cables, mounting structure) was obtained by soliciting price quotations from 5 different suppliers and installers in the Ghanaian Market. These suppliers and installers have been granted a permit from the Energy Commission of Ghana to supply and install PV systems. Per the data obtained in , the average cost of PV panels with accessories was estimated at 745 USD/kW. A 10% margin for installation was added, increasing PV capital cost to 820 USD/kW. Furthermore, the PV replacement cost is 0 USD/kW because the PV lifetime equals the project lifetime. The operation and maintenance cost is 8 USD/kW/year, mainly for cleaning/washing the PV panels.
Figure 5. Cost of PV panels with accessories (cables, mounting structure)
2.4.2.2. Diesel genset
The diesel genset consumes diesel to produce electricity. The fuel slope defines the volume of diesel consumed by the genset to generate electricity. HOMER computes the fuel consumption rate as follows:
Where Vc is the volume of diesel consumed by the genset per hour (L), i is the fuel curve intercept coefficient (L/h/kWrated), Agen is the genset capacity (kW), j represents fuel curve slope (L/h/kW), and Bgen represents genset power output in kW. The supply and installation cost for diesel genset was collected from notable local suppliers such as Cummins Ghana, Mantrac Ghana, and C. Woermann Ghana. Based on information received, the diesel genset capital cost is about 250 USD/kW. The replacement and O&M costs are about 200 USD/kW and 0.03 USD/h/kW. The price of diesel fuel in the Ghanaian market was about 0.937 USD/L (GlobalPetrolPrices, Citation2020) during this study. However, a 10% margin to cater for transportation and delivery costs increased the price to 1.03 USD/L.
2.4.2.3. Battery and power converter
The battery bank stores DC energy produced from PV panels and fuel cell systems. This energy meets the base station electrical loads when there are power shortages from the generating power systems. The battery bank autonomy and battery lifetime are very critical parameters when sizing the battery bank capacity. HOMER computes the battery bank autonomy as follows:
Zbatt is the battery bank autonomy in years. Abatt represents battery quantity, Bnom represents battery nominal voltage in V, Cnom is the nominal battery capacity in Ah, Pmin is the battery bank’s minimum state of charge in %, and PLave is the average primary load in kWh/d. HOMER uses Equationequation 4(4)
(4) to compute the battery bank lifetime:
Xbatt represents the battery bank’s lifetime in years. Zb represents the total quantity of batteries. Qls represents single battery lifespan throughput, Qth represents yearly battery throughput, and Rbf represents battery float life. The cost of a battery in the local market is about 200 USD/kWh (AIMS Power, Citation2020a; SUKA, Citation2020a). Hence, a 10% margin for installation was added, increasing the capital cost to 220 USD/kWh. Also, the battery replacement cost is taken as 200 USD/kWh (AIMS Power, Citation2020a; SUKA, Citation2020a). Proper operating and maintenance (O&M) cost of 5 USD/kWh/year is considered. The battery has a design lifespan of 10 years with proper maintenance.
The converter converts DC output from PV and fuel cell to AC output to meet the base station AC loads. The converter has an efficiency of 95% and a lifespan of 15 years. A converter’s cost in the local market is about 315 USD/kW (AIMS Power, Citation2020b; SUKA, Citation2020b). A 10% margin for installation increased the capital cost to 347 USD/kW. The replacement and O&M costs are 315 USD/kW and 7 USD/kW/yr.
2.4.2.4. Fuel cell unit
Fuel cells are energy conversion devices that operate electrochemically to produce DC electrical current. The Fuel cell absorbs hydrogen and oxygen in the air to generate electricity, water, and heat (Crouch, Citation2011). HOMER models a fuel cell as a generator that generates DC electricity using hydrogen and oxygen (HOMER Energy, Citation2016). The fuel slope defines the fuel (hydrogen) volume consumed by the fuel cell to generate electricity. The fuel consumption rate is calculated using Equationequation 5(5)
(5) : (HOMER Energy, Citation2016)
Where Fc represents the amount of fuel consumed by the fuel cell in an hour (L), k represents fuel curve intercept coefficient (L/h/kWrated), Ygen represents the fuel cell rated capacity in kW, s represents fuel curve slope (L/h/kW). Pgen represents the power output in kW. The electrolyzer breakdowns water into hydrogen and oxygen. Subsequently, a storage tank is used to store hydrogen. Currently, there are no local suppliers for (electrolyzer, hydrogen tank, fuel cell) in the Ghanaian market since the technology is now attracting attention in the African market. In this study, the fuel cell, electrolyzer, and hydrogen tank cost details were retrieved from a comprehensive review of notable works on fuel cell systems worldwide, as shown in . presents a summary of input technical parameters for HOMER simulation. summarizes the component cost, as discussed above.
Table 4. Review of cost for fuel cell, electrolyzer, and hydrogen tank for HOMER simulation
Table 5. Summary of technical input parameters for sizing optimal hybrid system
Table 6. Summary of components cost for simulation
2.4.3. Economic and project input parameters
Economic indicators such as the inflation rate and discount rate play a central role in renewable energy projects’ feasibility. HOMER uses the inflation rate and the discount rate to estimate the project annualized cost, NPC, capital recovery fraction, etc. The discount rate at the Central Bank of Ghana stood at 12% at the time of this study (Bank of Ghana, Citation2020a). Also, the inflation rate of 10% was used (Bank of Ghana, Citation2020b). A typical project lifetime of 25 years is considered. A project fixed capital cost of 10,000 USD is assumed for acquiring land and control panel (regulate the flow of energy from PV and fuel cell). An additional project fixed O&M cost of 100 USD/yr is estimated for maintaining the control panel.
2.4.4. Key economic metrics
In this study, total Net Present Cost (NPC) and levelized cost of electricity (LCOE) are key economic metrics essential for decision making. The total net present cost refers to the sum of components costs (capital, replacement, and operating and maintenance) minus revenues over the project lifespan (HOMER Energy, Citation2016). HOMER calculates the NPC for a project as follows:
where Ca,t represents the total annualized cost, i represents real interest rate per annum (measured from discount rate), Plifetime represents project lifetime, and CRF(i,N) represents capital recovery factor.
The CRF(i,N) is computed as follows:
where i represents the annual real interest rate, and N represents project lifetime.
The levelized cost of electricity (LCOE) is the cost of electricity ($/kWh) produced by the system (HOMER Energy, Citation2016). HOMER calculates the LCOE using Equationequation 8(8)
(8) :
2.4.5. System constraints
System constraints are conditions set for the hybrid power system to meet. HOMER rejects feasible power systems that refuse to meet the stated requirements, thus, omitted in the HOMER optimization results. In this study, the key selected system constraints are operating reserve, minimum renewable fraction, and minimum annual capacity shortage. Operation reserve is the excess operating capacity that meets the unexpected surge in electricity demand or decline in PV power output. For this study, 10% of the hourly electricity demand and 25% of PV power output are specified for operating reserve to guarantee consistent electricity supply for the base station. The minimum renewable fraction is 100%. Also, the annual capacity shortage, which accounts for the total electricity shortage expected to occur during the year, is taken as 0–0.5%.
3. Results and discussion
3.1. Electrical load and load profile for Buduburam ATC base station
displays the Buduburam ATC base station hourly load profile. The total electrical load demand for Buduburam ATC base station DC and AC loads are estimated at 156 kWh/d and 46.056 kWh/d. Therefore, the base station’s total electricity demand is about 202.056 kWh/d. It can be observed that DC and AC loads have a peak load of 6.5 kW and 1.98 kW. Also, DC loads have a constant load profile throughout the day. The DC loads are mainly consumed by the base transceiver stations (BTS) at the site, which operate 24 hr/d throughout the year unless they develop a fault and become non-functional. Moreover, for AC loads, there is a slight variation in the hourly load profile. The AC loads have a constant load of 1.98 kW from 18:00 to 5:00, mainly dominated by air-conditioner and lighting systems. Correspondingly, in the hours of 6:00–17:00, AC loads exhibit a constant load profile of 1.86 kW. The air-conditioner consumes 97%, outside lights (2.6%), and inner lights (0.4%) of the total AC loads. The base station works 24/7, therefore, weekday loads and weekend loads are assumed to be the same throughout the year. HOMER simulation allows adding of daily and hourly noise random variation into the load profile. In this study, a 10% day to day in a time step of 15% of random variability was added to the hourly load profile. This increased the DC peak load from 6.5 kW to 8.2 kW and the AC peak load from 1.98 kW to 2.77 kW, as shown in . This random variation would account for an unexpected rise in electricity demand to ensure a continuous supply of power for the base station.
Figure 6. Buduburam ATC base station hourly load profile
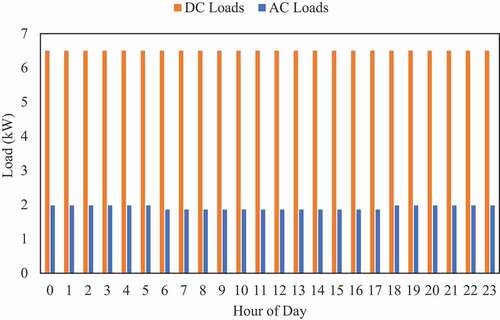
Figure 7. Screenshot of modelled PV/Fuel cell hybrid system using HOMER
3.2. HOMER simulation and optimization results
This study proposes a PV/fuel cell hybrid system to power a remote base station. However, the base station is already powered by a diesel genset to meet its daily electricity demand. For this study, an alternative power system, namely, PV/diesel/battery, is modelled in conjunction with the site’s diesel power system. The technical, economic, and environmental performance of these power systems is compared to that of the proposed system. This aims to justify and test the viability, resilience, and competitive advantage of the PV/Fuel cell system to PV/battery/diesel and diesel-only power systems. presents HOMER results for the power systems. The results are presented and analyzed for three power systems considered. It can be observed that the optimal hybrid system sizing configuration for PV/fuel cell that meets the base station desired loads comprises PV panels (79 kW), fuel cell (6 kW), battery (144 kWh), electrolyzer (30 kW), hydrogen tank (30 kg) and converter (3 kW). Likewise, the PV/battery/diesel system comprises PV panels (35 kW), battery (145 kWh), diesel genset (16 kW), and a converter (8 kW). Finally, adopting a diesel-only system requires a diesel genset capacity of 16 kW and a converter capacity of 8 kW. The total electricity production ranges from 160.838 MWh/yr for PV/fuel cell, 88. 242 MWh/yr for PV/diesel/battery and 80.64 MWh/yr for diesel genset only. Diesel genset power system produces no electricity excess. However, PV/diesel/battery and PV/fuel cell electricity excesses are 1.7% (6.902 MWh/yr) and 20% (32.351 MWh/yr), respectively. From the technical point of view, the three power systems can meet the base station loads.
Table 7. HOMER optimum results for hybrid power systems
From , the Buduburam base station diesel genset is expected to run for 8,760 hours and produce about 69,400 kg/yr of CO2 emissions. However, opting for PV/diesel/battery reduces the genset operating hours by about 85% and reduces CO2 emissions by 62% compared to the diesel-only system. Based on global concern about reducing CO2 emissions to mitigate climate change, deploying a PV/Fuel cell hybrid system emits no emissions, but it saves about 27 tCO2/yr than a PV/battery/diesel system and 67 tCO2/yr than a diesel power system. These CO2 savings can contribute to the Government of Ghana’s agenda on carbon savings of about 11 MtCO2 by 2030 as drafted in the Ghana Renewable Energy Master Plan (Energy Commission, Citation2019). Also, it is supported by Ghana’s Renewable Energy Act 832, which promotes the utilization of locally available renewable energy resources to cut down greenhouse emissions (Government of Ghana, Citation2011). This is a potential footprint for Ghana towards decarbonization for the telecom sector across the country.
From a purely economic standpoint, the two economic metrics for decision making are NPC and LCOE. Concerning , PV/Fuel cell NPC is 30% lower than PV/diesel/battery and 67% lower than diesel-only. Also, the PV/fuel cell has the lowest LCOE (0.222 USD/kWh), although it has the highest initial capital (185,712 USD). The LCOE is only 29% lower than PV/battery/diesel but 71% lower than the diesel-only power system (current power system). Additionally, PV/Fuel cell initial capital cost is about 94% higher than PV/batter/diesel and almost 186% higher than diesel-only power systems. The operating cost for PV/Fuel is 90% and 129% lower than PV/diesel and diesel power systems. In Ghana, the Public Utilities Regulatory Commission (PURC) categorizes telecom base stations connected to the national grid under the special load tariff—low voltage (SLT-LV) sector. The approved average electricity tariff for this sector is about 0.25 USD/kWh as of October 2020 (PURC, Citation2020). The LCOE generated from PV/fuel is about 12% cheaper than the average current tariff (0.25 USD/kWh) paid by grid-connected telecom stations. Key observations can be gleaned from similar studies that incorporate PV and fuel cells, as discussed above. For instance, this hybrid system LCOE (0.222 USD/kWh) is nearly comparable to the LCOE (0.145 USD/kWh) for a study in UAE (Ghenai et al., Citation2018). However, the authors excluded battery banks in the hybrid system, which could have increased the system cost to impact the LCOE. Likewise, a study in India with an LCOE (0.203 USD/kWh) (Singh et al., Citation2017) is comparable to system LCOE. Moreover, the system LCOE outshines the LCOE (1.306 USD/kWh) for a study conducted in Istanbul (Dursun & Aykut, Citation2019). Furthermore, significant observations can be gleaned from similar studies on hybrid systems for powering base stations in . It can be seen that most of the studies focused on the utilization of PV, battery, diesel components to the telecom sites. However, the study that comprises PV/battery/wind/fuel cell was conducted in India, and the LCOE is about 0.99 USD/kWh (Amutha & Rajini, Citation2015), which is far above the LCOE estimated in this study. Nevertheless, other LCOE estimated for telecom sites that are comparable to the current study LCOE are as follows: 0.372 USD/kWh in South Africa (Kusakana & Vermaak, Citation2013), 0.205 USD/kWh in Malaysia (Alsharif et al., Citation2015), and 0.218 USD/kWh in South Africa (Aderemi et al., Citation2018). A study on PV/diesel/battery hybrid systems for a telecom base station estimated an LCOE of 0.53 USD/KWh (Quansah et al., Citation2017) for Ghana’s case. This system LCOE is expensive compared to the LCOE generated from this study. Globally, the LCOE generated from low carbon generation technologies has declined and is gradually becoming lower than fossil fuel generation costs. Also, renewable energy costs have continually declined in recent years (International Energy Agency, Citation2020). The PV/fuel cell system LCOE is cost-effective, and telecom sites can opt to shift to this technology. Though it has a high initial cost, it is more cost-effective and lucrative than PV/diesel/battery and diesel-only systems in the long term.
3.2.1. PV/fuel cell hybrid system performance
presents electricity generation and consumption by the hybrid power system. The annual electricity production from this hybrid system is about 160.838MWh/yr, which comprises 132.151 MWh/year (82.2%) from solar PV panels and 28.687 MWh/yr (17.8%) from the fuel cell. About 52% of electricity generation from PV serves the electrolyzer to split water into hydrogen and oxygen. The remaining 48% meets the DC and AC loads during the daytime. Electricity production from PV yields a levelized cost of 0.029 USD/kWh. The PV panels rated capacity is 79 kW. It has a mean output of 15.1 kW and a capacity factor of 18.4%. The rated capacity of the fuel cell is 6 kW. It has a mean and minimum power output of 5.84 kW and 2.42 kW. The fuel cell’s capacity factor is 54.6% at a fixed generation cost of 0.54 USD/hr. The fuel cell consumes 1,071 kg of hydrogen with a specific hydrogen consumption of 0.0373 kg/kWh. Also, it consumes 2.93 kg of hydrogen per day (about 0.122 kg of hydrogen per hour). It has an operating time of 4,622 hrs/yr.
Table 8. Electricity produced and consumed
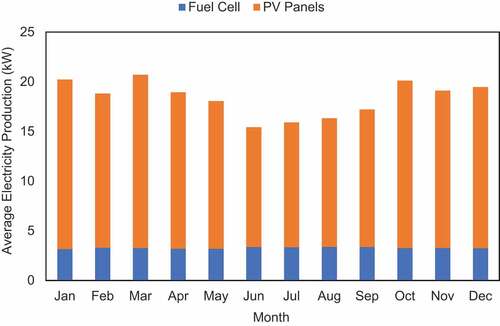
The overall electricity generated from this hybrid system is consumed as follows: AC loads (16.773 MWh/yr), DC loads (57.006 MWh/yr), and electrolyzer (50.885MWh/yr.). About 3.823 MWh/yr of electricity is lost during energy conversion in the battery and converter systems. displays the monthly electricity generated from PV panels and fuel cell. It can be seen that there is variation in electricity generated by each power system throughout the year. For instance, the months of June—September has low power produced from PV panels and fuel cells. This is due to low solar irradiation and clearness index at Buduburam, mainly caused by frequent rains and cloudy atmosphere during that season which likely to affect PV and fuel cell power output
Figure 8. PV and fuel cell monthly electricity generation
3.2.2. Economic analysis
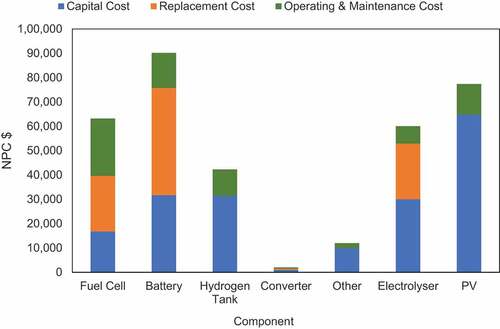
The solar PV/fuel cell hybrid system has a total NPC, initial capital, and operating cost of 326,193 USD 185,712 USD and 7,043 USD/yr, respectively, as presented in . shows the cost breakdown for all components. It can be observed that the battery component has the highest NPC ($90,178.57), followed by PV ($77,386.30), fuel cell ($63,213.13), electrolyzer ($60,075.83), hydrogen tank ($42,271.20), other ($11,994.67) and converter ($1,993.64) respectively. Also, it can be seen that capital cost contributes to 54% of the total NPC. The PV panels are the most expensive component, contributing 34% to the hybrid system’s capital cost. Next is the battery (17.5%) and the hydrogen tank (16.5%). The remaining component’s contribution to capital cost is as follows: electrolyzer (16%), fuel cell (9%), other (cost for acquiring land and control panel) (5%), and converter (1%).
Replacement cost contributes about 26% to the project total NPC. Replacement cost emanates from components such as fuel cell, battery, electrolyzer, and converter. The battery bank has the highest replacement cost of 49%. The remaining component’s contribution to replacement cost is as follows: fuel cell (25%), electrolyzer (25%), and converter (1%). Hydrogen tank and PV panels have no replacement because their lifetime equals the project lifetime (25 yrs). Operating cost has the lowest cost contribution to the project total NPC. The hybrid system’s operating cost emanates from fuel cell (33%), battery (20%), PV panels (18%), hydrogen tank (15%), electrolyzer (10%), others (3%), and converter (1%).
Figure 9. Cost breakdown for components
3.3. Sensitivity analysis
Sensitivity analysis was carried out on critical parameters to envisage its impact on the optimal hybrid system NPC and LCOE. This would help check the hybrid system’s resilience for decision-making. The key selected parameters are the discount rate and capital subsidy.
The discount rate is the interest rate at which money is borrowed from local and international banks. It measures the present value of future cash flows from the project. displays the impact of the discount rate on the system NPC and LCOE. It can be seen that the LCOE decreases with a decrease in the discount rate. There is almost a positive linear relationship between the discount rate and LCOE. As the discount rate decreases from 12% to 10%, the system LCOE decreases by about 30%, but NPC increases by about 24%. With a lower discount of 4%, the LCOE reduces by 71%, and the NPC increases by 64%. Similarly, the LCOE rises by 21%, and NPC decreases by 14% when the discount increases to 14%. These sensitive changes are due to the system’s total annualized being affected by the discount rate. The annualized cost decreases with the decreasing discount rate, thus, causing the LCOE to fall. Generally, capital-intensive technologies are sensitive to variations in the discount rate. However, a relatively high upfront cost technology could be more vulnerable to business uncertainties, thus increasing financing costs (International Energy Agency, Citation2020). Although the PV/fuel system is capital-intensive, it is resilient to discount rate fluctuations is significant. Moreover, the discount rate’s impact on the system would enable stakeholders and investors to break even on the project to gain appropriate investment returns. Hence, local and international banks should grant stakeholders and investors a low discount rate to attract this system’s deployment to yield a cost-effective LCOE for customers.
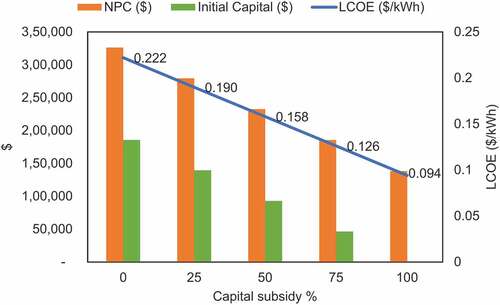
The effect of initial capital subsidies was accessed using the base case discount rate (12%) and inflation (10%). The initial capital is the total cost required to commence the project. However, renewable energy projects are capital intensive, which is likely to discourage stakeholders from deployment. Subsidizing the initial capital cost by either a local or international donor agency would help attract the system’s deployment by stakeholders since the high upfront cost is sometimes a barrier. displays the effect of the capital subsidy on the system NPC and LCOE. It can be seen that almost a linear relationship exists between the capital subsidy and the LCOE. A donor agency providing a 50% initial capital subsidy reduces both NPC and LCOE by 29%. A 100% fund for the entire initial investment cost significantly reduces the system LCOE by 59%. The results indicate that the hybrid system LCOE is more sensitive to capital subsidy and is attractive and cost-effective compared to LCOE paid by grid-connected base stations. Therefore, donor agencies could play a pivotal role in assisting stakeholders in deploying this system by providing funds to cut down initial capital costs. This would aid stakeholders in reducing CO2 emissions to achieve a carbon-neutral environment. Also, the capital subsidies would encourage grid-connected telecom sites to go off-grid to reduce grid dependency and increase renewable energy capacity in the national energy mix.
Figure 10. Effect of discount rate on NPC and LCOE
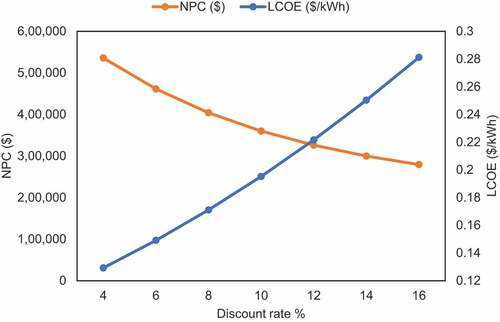
Figure 11. Effect of capital subsidy on NPC and LCOE
4. Conclusions
The depletion of fossil fuel reserves and high greenhouse gas emissions from fossil fuel combustion has compelled a global need to transit to cleaner energy systems like solar PV, wind turbines, hydropower, fuel cells, etc. This study presents an analysis of a solar PV/fuel cell hybrid system to power a base station located at Budumburam, in the Central Region of Ghana. HOMER was used to perform a complete parametric analysis of the system. The NPC and LCOE were selected as the principal economic indicators. The hybrid system’s technical, economic, and environmental performance was compared to PV/diesel/battery and diesel power systems.
From the study results, these findings are gleaned. The existing base station diesel power system initial capital ($6,796) is low compared to PV/diesel/battery ($67,278) and PV/fuel/cell ($185,712). However, PV/Fuel operating cost is 90% and 129% lower than PV/diesel/battery and diesel power systems. The LCOE generated from PV/fuel is only 29% lower than PV/battery/diesel but 71% lower than the diesel power system (current power system). Moreover, this LCOE is about 12% cheaper than the current average tariff (0.25 USD/kWh) paid by grid-connected telecom stations. Even at a lower discount rate of 6%, PV/fuel cell yields an LCOE of 0.149 USD/kWh, which is about 50% lower than the grid tariff. Deploying a PV/fuel cell system would cause the base station to save about 27 tCO2/yr than the PV/diesel/battery power system and 67 tCO2/yr than a diesel power system. This is a footprint for the Government of Ghana (GoG) towards decarbonization for the telecom industry. Sensitivity analysis shows that the PV/fuel system is sensitive to changes in the discount rate. Although the system has a high upfront cost, its economic feasibility is evident in its lower LCOE and zero CO2 emissions. Presently, this technology is new in Ghana. However, subsidizing the initial capital would drastically reduce the system NPC and LCOE to make it more attractive and lucrative. This would probably attract stakeholders to consider this system’s deployment to increase renewable energy penetration in Ghana.
The study findings are incredibly vital for stakeholders, policymakers, and investors to guide investment and deployment of PV/fuel cell power systems for Ghana’s telecom base stations. Though the upfront cost is high, stakeholders could be sensitized to understand the long-term profit of deploying renewable energy systems. The authors encourage the Ghana National Communication Authority to partner stakeholders to consider a hybrid system of this nature since the GoG has a target of saving 11 MtCO2 by 2030 (Energy Commission, Citation2019). Lastly, the authors encourage local and international banks to provide stakeholders, investors, and decision-makers with attractive incentives and packages not limited to a low discount rate, grants, tax credits, and loan programs to attract the deployment of a standalone renewable hybrid system of this nature. Future studies should focus on setting up a prototype to validate HOMER’s technical results. Likewise, further studies should focus on using measured ground data for solar irradiation to yield more precise and realistic simulation findings.
Acknowledgements
The authors are grateful to the team in charge of the Buduburam ATC base station for their sincere support during data collection for electrical load assessment.
Additional information
Funding
Notes on contributors
Flavio Odoi-Yorke
Flavio Odoi-Yorke is a Faculty Member at the Department of Renewable Energy Technology, Cape Coast Technical University. He has received his B.Sc. in Physics from Kwame Nkrumah University of Science and Technology and was awarded his M.Sc. in Energy Engineering from Pan African University Institute of Water and Energy Sciences (Including Climate Change). His research interests include Renewable Energy Systems, Energy Modelling, Rural Electrification, Energy Access & Planning, and Climate Change.
Atchou Woenagnon holds an MSc. in Renewable Energy Engineering from Regional Maritime University. Woenagnon is a Professional Engineer with research interests in Renewable Energy, Power Systems, and High Voltage Controls.
References
- Adaramola, M. S., Agelin-Chaab, M., & Paul, S. S. (2014). Analysis of hybrid energy systems for application in southern Ghana. Energy Conversion and Management, 88(2014), 284–25. http://doi.org/10.1016/j.enconman.2014.08.029
- Adaramola, M. S., Quansah, D. A., Agelin-Chaab, M., & Paul, S. S. (2017). Multipurpose renewable energy resources based hybrid energy system for remote community in northern Ghana. Sustainable Energy Technologies and Assessments, 22, 161–170. https://doi.org/10.1016/j.seta.2017.02.011
- Addo, E. O. K., Asumadu, J., & Okyere, P. Y. (2014). Optimal design of renewable hybrid energy system for a village in Ghana. Proceedings of the 2014 9th IEEE Conference on Industrial Electronics and Applications, ICIEA 2014, 1520–1526, https://doi.org/10.1109/ICIEA.2014.6931410.
- Aderemi, B. A., Daniel Chowdhury, S. P., Olwal, T. O., & Abu-Mahfouz, A. M. (2018). Techno-economic feasibility of hybrid solar photovoltaic and battery energy storage power system for a mobile cellular base station in Soshanguve, South Africa. Energies, 11(6), 1572. https://doi.org/10.3390/en11061572
- AfDB. (2016). African economic outlook 2016: Special theme: Sustainable cities and structural transformation. [Online]. https://www.afdb.org/fileadmin/uploads/afdb/Documents/Publications/AEO_2016_Report_Full_English.pdf
- Agyekum, E. B., & Nutakor, C. (2020). Feasibility study and economic analysis of stand-alone hybrid energy system for southern Ghana. Sustainable Energy Technologies and Assessments, 39(January), 100695. https://doi.org/10.1016/j.seta.2020.100695
- AIMS Power. (2020a). 12V 100Ah deep cycle battery heavy duty. Retrieved June 22, 2020, from https://www.aimscorp.net/agm-12v-100ah-deep-cycle-battery-heavy-duty.html
- AIMS Power. (2020b). 1000 watt pure sine power inverter 12 volt ETL listed to UL 458. Retrieved August 27, 2020, from https://www.aimscorp.net/1000_Watt_Pure_Sine_Power_Inverter_12_Volt.html
- Alsharif, M. H., Nordin, R., & Ismail, M. (2015). Energy optimisation of hybrid off-grid system for remote telecommunication base station deployment in Malaysia. EURASIP Journal on Wireless Communications and Networking, 2015(1). https://doi.org/10.1186/s13638-015-0284-7
- Amutha, W. M., & Rajini, V. (2015). Techno-economic evaluation of various hybrid power systems for rural telecom. Renewable and Sustainable Energy Reviews, 43, 553–561. https://doi.org/10.1016/j.rser.2014.10.103
- Ansong, M., Mensah, L. D., & Adaramola, M. S. (2017). Techno-economic analysis of a hybrid system to power a mine in an off-grid area in Ghana. Sustainable Energy Technologies and Assessments, 23(September), 48–56. https://doi.org/10.1016/j.seta.2017.09.001
- Aris, A. M., & Shabani, B. (2015). Sustainable power supply solutions for off-grid base stations. Energies, 8(10), 10904–10941. http://doi.org/10.3390/en81010904
- Babatunde, O. M., Denwigwe, I. H., Babatunde, D. E., Ayeni, A. O., Adedoja, T. B., & Adedoja, O. S. (2019). Techno-economic assessment of photovoltaic-diesel generator-battery energy system for base transceiver stations loads in Nigeria. Cogent Engineering, 1–19. https://doi.org/10.1080/23311916.2019.1684805
- Bajpai, P., & Dash, V. (2012). Hybrid renewable energy systems for power generation in stand-alone applications: A review. Renewable and Sustainable Energy Reviews, 16(5), 2926–2939. https://doi.org/10.1016/j.rser.2012.02.009
- Bank of Ghana. (2020a). Monthly interest rates. Retrieved June 23, 2020, from https://www.bog.gov.gh/economic-data/interest-rates
- Bank of Ghana. (2020b). Bank of Ghana monetary policy report inflation outlook and analysis. [Online]. https://www.bog.gov.gh/monetary_policy_rpts/inflation-outlook-and-analysis-report-may-2020
- Cotrell, J., & Pratt, W. (2003). Modeling the feasibility of using fuel cells and hydrogen internal combustion engines in remote renewable energy systems preprint. [Online]. https://www.nrel.gov/docs/fy03osti/34043.pdf
- Crouch, M. (2011). Fuel cell systems for base stations : Deep dive study. An exploration of the current and future potential of fuel cell systems to provide green power for the telecoms industry. [Online]. https://www.gsma.com/mobilefordevelopment/wp-content/uploads/2012/04/Fuel_Cell_Report_for_fomatting1.pdf
- Dursun, B., & Aykut, E. (2019). An investigation on wind/PV/fuel cell/battery hybrid renewable energy system for nursing home in Istanbul. Proceedings of the Institution of Mechanical Engineers, Part A: Journal of Power and Energy, 233(5), 616–625. http://doi.org/10.1177/0957650919840519
- Energy Commission. (2019). Ghana renewable energy master plan. [Online]. http://www.energycom.gov.gh/files/Renewable-Energy-Masterplan-February-2019.pdf
- Ghana Statistical Service. (2014). 2010 population and housing census Gomoa. District analytical report. East district. [Online]. http://www2.statsghana.gov.gh/docfiles/2010_District_Report/Central/GOMOAEAST.pdf
- Ghana Statistical Service. (2019). Rebased 2013–2018 annualgross domesticproduct. April 2019 edition. [Online]. http://www.statsghana.gov.gh
- Ghenai, C., Salameh, T., & Merabet, A. (2018). Technico-economic analysis of off grid solar PV/Fuel cell energy system for residential community in desert region. International Journal of Hydrogen Energy, 45(20), 11460–11470. https://doi.org/10.1016/j.ijhydene.2018.05.110
- GlobalPetrolPrices. (2020). Ghana diesel prices. Retrieved May 28, 2020, from https://www.globalpetrolprices.com/Ghana/diesel_prices
- Goel, S., & Ali, S. M. (2013). Hybrid energy systems for off-grid remote telecom tower in Odisha, India. International Journal of Ambient Energy, 36(3), 116–122. https://doi.org/10.1080/01430750.2013.823110
- Government of Ghana. (2011). Renewable energy act 2011: Act 832. [Online]. 1–27, http://energycom.gov.gh/files/RENEWABLEENERGYACT2011(ACT832).pdf
- Hatsu, S., Mabeifam, U. M., & Paitoo, P. C. (2016). Infrastructure sharing among Ghana’s mobile telecommunication networks: Benefits and challenges. American Journal of Networks and Communications, 2(2), 35–45. http://doi.org/10.11648/j.ajnc.20160502.14
- Heydari, A., & Askarzadeh, A. (2016). Techno-economic analysis of a PV/biomass/fuel cell energy system considering different fuel cell system initial capital costs. Solar Energy, 133, 409–420. https://doi.org/10.1016/j.solener.2016.04.018
- HOMER Energy. (2016, August). HOMER pro version 3.7 user manual. [Online]. http://www.homerenergy.com/pdf/HOMERHelpManual.pdf
- Humar, I., Ge, X., Xiang, L., & Jo, M. (2011). Rethinking energy—Efficiency models of cellular networks with embodied energy. IEEE Network, 25(2), 40–49. http://doi.org/10.1109/MNET.2011.5730527
- International Energy Agency. (2020). Projected costs of generating electricity 2020 edition. [Online]. https://www.iea.org/reports/projected-costs-of-generating-electricity-2020
- IRENA. (2015).REthinking energy: Renewable energy and climate change. [Online]. http://www.irena.org/-/media/Files/IRENA/Agency/Publication/2015/IRENA-_REthinking_Energy_2nd_report_2015.pdf
- IRENA. (2019). Renewable power generation costs in 2019. [Online]. https://www.irena.org/-/media/Files/IRENA/Agency/Publication/2020/Jun/IRENA_Power_Generation_Costs_2019.pdf
- Isa, N. M., Das, H. S., Tan, C. W., Yatim, A. H. M., & Lau, K. Y. (2016). A techno-economic assessment of a combined heat and power photovoltaic/fuel cell/battery energy system in Malaysia hospital. Energy, 112, 75–90. https://doi.org/10.1016/j.energy.2016.06.056
- Kebede, H. M., & Bekele, G. B. (2018). Feasibility study of PV-wind-fuel cell hybrid power system for electrification of a rural village in Ethiopia. Journal of Electrical and Computer Engineering, 2018. https://doi.org/10.1155/2018/4015354
- Kusakana, K., & Vermaak, H. J. (2013). Hybrid renewable power systems for mobile telephony base stations in developing countries. Renewable Energy, 51, 419–425. https://doi.org/10.1016/j.renene.2012.09.045
- Lambert, S., Van Heddeghem, W., Vereecken, W., Colle, D., & Pickavet, M. (2013). Worldwide electricity consumption of communication networks. 790(2010), [Online]. http://dx.doi.org/10.1364/OE.20.00B513
- Malmodin, J., & Lundén, D. (2018). The electricity consumption and operational carbon emissions of ICT network operators 2010–2015. [Online]. https://www.diva-portal.org/smash/get/diva2:1177210/FULLTEXT01.pdf
- Mohammed, O. H., Amirat, Y., Benbouzid, M., & Elbast, A. (2014). Optimal design of a PV/Fuel cell hybrid power system for the city of Brest in France. [Online]. 119–123. https://hal.archives-ouvertes.fr/hal-01023490
- NCA. (2010). Government of Ghana guidelines for the deployment of communications towers. [Online]. https://www.nca.org.gh/assets/Uploads/Communications-Towers-Guidelines3.pdf
- NCA. (2020). Telecom voice subscription. Retrieved January 01, 2020, from https://www.nca.org.gh/industry-data-2/market-share-statistics-2/telecom-voice
- Okedu, K. E., & Uhunmwangho, R. (2014). Optimization of renewable energy efficiency using HOMER. International Journal of Renewable Energy Research, 4(2), 421–427. https://doi.org/10.1234/ijrer.v4i2.1231.g6294
- Olatomiwa, L., Mekhilef, S., Huda, A. S. N., & Sanusi, K. (2015). Techno-economic analysis of hybrid PV–diesel–battery and PV–wind–diesel–battery power systems for mobile BTS: The way forward for rural development. Energy Science & Engineering, 3(4), 271–285. https://doi.org/10.1002/ese3.71
- Olatomiwa, L. J., Mekhilef, S., & Huda, A. S. N. (2014). Optimal sizing of hybrid energy system for a remote telecom tower: A case study in Nigeria. 2014 IEEE Conference on Energy Conversion (CENCON 2014), September, 243–247, https://doi.org/10.1109/CENCON.2014.6967509.
- Opoku, R., Mensah-Darkwa, K., & Samed Muntaka, A. (2018). Techno-economic analysis of a hybrid solar PV-grid powered air-conditioner for daytime office use in hot humid climates– A case study in Kumasi city, Ghana. Solar Energy, 165(February), 65–74. https://doi.org/10.1016/j.solener.2018.03.013
- Özgirgin, E., Devrim, Y., & Albostan, A. (2015). Modeling and simulation of a hybrid photovoltaic (PV) module-electrolyzer-PEM fuel cell system for micro-cogeneration applications. International Journal of Hydrogen Energy, 40(44), 15336–15342. http://doi.org/10.1016/j.ijhydene.2015.06.122
- Paudel, S., Shrestha, J. N., Neto, F. J., Ferreira, J. A. F., & Adhikari, M. (2011). Optimization of hybrid PV/wind power system for remote telecom station. 2011 International Conference on Power and Energy Systems, ICPS 2011, X, 1–11. https://doi.org/10.1109/ICPES.2011.6156618.
- Postnote. (2008). ICT and CO2 emissions, December 2008 Number 319 Parliamentary Office of Science & Technology. (319), 1–4. [Online]. https://www.parliament.uk/documents/post/postpn319.pdf
- PURC. (2020). Public Utilities Regulation Commission (PURC) electricity and water tariff [Online]. http://www.purc.com.gh/purc/sites/default/files/purc_q4_electricity_and_water_tariff_2020.pdf
- Quansah, D. A., Woangbah, S. K., Anto, E. K., Akowuah, E. K., & Adaramola, M. S. (2017). Techno-economics of solar pv-diesel hybrid power systems for off-grid outdoor base transceiver stations in Ghana. International Journal of Energy for a Clean Environment, 18(1), 61–78. https://doi.org/10.1615/InterJEnerCleanEnv.2017019537
- Sakah, M., Amankwah, F., Katzenbach, R., & Gyamfi, S. (2017). Towards a sustainable electrification in Ghana: A review of renewable energy deployment policies. The Indian Journal of Surgery, 79(April), 544–557. https://doi.org/10.1016/j.rser.2017.05.090
- Singh, A., Baredar, P., & Gupta, B. (2017). Techno-economic feasibility analysis of hydrogen fuel cell and solar photovoltaic hybrid renewable energy system for academic research building. Energy Conversion and Management, 145, 398–414. https://doi.org/10.1016/j.enconman.2017.05.014
- SUKA. (2020a). DEEP CYCLE ROCKET 12V 100AH. Retrieved June 22, 2020, from http://suka.com.gh/ecommerce/product-category/batteries
- SUKA. (2020b). 1.5KVA-24V inverter. Retrieved July 20, 2020, from https://suka.com.gh/ecommerce/product/axpert-1-5kva-24-inverter
- Tchao, E. T., Agyekum, K. A. P., & Diawuo, K. (2017). Techno-Economic evaluation of power systems for off-grid telecommunications infrastructure in remote locations in Ghana. Communications on Applied Electronics, 7(7), 22–27. https://doi.org/10.5120/cae2017652694
- TH Energy. (2019). Huge potential for renewables in the telecom sector. Retrieved September 06, 2020, from https://www.th-energy.net/2019/02/25/huge-potential-for-renewables-in-the-telecom-sector/#:~:text=Powering-telecom-towers-with-renewables,costs-for-operation-and-maintenance.&text=It-has-become-obvious-that,energy-solutions-is-therefore-huge
- UNFCCC. (1992). United Nations framework convention on climate change. [Online]. https://unfccc.int/files/essential_background/background_publications_htmlpdf/application/pdf/conveng.pdf
- UNFCCC. (2015). Paris agreement. [Online]. https://unfccc.int/files/essential_background/convention/application/pdf/english_paris_agreement.pdf
- UNFCCC. (2020). What is the Kyoto protocol? Retrieved August 20, 2020, from https://unfccc.int/kyoto_protocol