
 ?Mathematical formulae have been encoded as MathML and are displayed in this HTML version using MathJax in order to improve their display. Uncheck the box to turn MathJax off. This feature requires Javascript. Click on a formula to zoom.
Abstract
Decision-making based on expert’s opinion by data envelopment analysis (DEA) models requires crisp number. However, the assumption of expert might not always be accurate. This paper introduces fuzzy DEA credibility constrained and relative closeness (RC) index to cope with uncertainty data. The proposed approach transforms the traditional DEA models to be fuzzy events by using credibility measure. Furthermore, RC index was used to increase the discrimination power of traditional DEA. Two numerical examples with different credibility level are presented for demonstrate the proposed fuzzy DEA credibility constrained and RC index. The findings indicate that the credibility level impact on the RC index on both numerical examples. The increasing level of credibility value would drop the value of RC index.
PUBLIC INTEREST STATEMENT
Decision-making based on expert’s opinion by data envelopment analysis (DEA) model requires crisp number. Vagueness is the main source of uncertainty because the assumption of the experts might not always be accurate. Vagueness refers to fuzzy input and output data from experts. To solve this problem, the integration of fuzzy DEA credibility constrained and relative closeness (RC) index is introduced. This approach transforms the traditional DEA models to be fuzzy events by using credibility measure. RC index was used to increase the discrimination power of traditional DEA. The credibility level of the proposed approach provides the flexibility for decision-maker to set their own acceptable credibility level in making decision. Moreover, the efficiency score of each DMU is decreased by increasing the credibility level. The preserved output data applying by the integration of RC index and credibility level are the cause of the discrimination power improvement.
1. Introduction
Data envelopment analysis (DEA) was introduced by Charnes et al. (Citation1978) to measure the relative efficiency of decision-making units (DMUs). The relative efficiency of any DMU is obtained by using a maximum of ration of weighted outputs to weighted inputs. Nowadays, DEA still grow very fast, around 2000 more papers related with DEA have been published during 2010 to 2014 (Liu et al., Citation2016). The activities related to DEA grow rapidly because some advantages, such as DEA, does not need a set of weight either inputs or outputs (Mirhedayatian et al., Citation2013), DEA does not need to transform data to be same unit (Shabani et al., Citation2012), and DEA can handle quantitative and qualitative variables (Calik et al., Citation2018; Mousavi-Nasab & Sotoudeh-Anvari, Citation2017). However, the main issue of DEA is related with discrimination power that still low. DEA is still possible to have same efficiency score in the several DMU, and this cause impossible to know the exact ranking of DMUs.
To increase the discrimination power of DEA, Wang and Jean (Citation2006) proposed two virtual DMUs known as ideal DMU (IDMU) and anti-ideal DMU (ADMU) into the DEA. Furthermore, the two virtual DMUs are combined to relative closeness (RC) index, and the ranking of DMUs can be obtained. In their approach, all the data either inputs or outputs are assumed to be a crisp number. However, the assumption might not always be accurate or known as lack precision of judgment of the expert. Hence, enhancing their model is necessary to make it useful in uncertainty data.
Recently, some researchers develop fuzzy set theory and apply in many problem situations. For example, a study using a type-2 fuzzy network DEA for fast-moving consuming goods (FMCG) performance evaluation (Olfat & Pishdar, Citation2017), a fuzzy DEA-Vikor used for supplier selection (Karami et al., Citation2020; Mohaghar et al., Citation2013) and an interval type-2 fuzzy dynamic network DEA used for airports’ sustainability performance (Olfat et al., Citation2016). Furthermore, many methods that can to make fuzzy DEA models. Lertworasirikul et al. (Citation2003) provides for group of fuzzy DEA models, namely tolerance-based approach, α-based approach, fuzzy ranking approach, and possibility approach, while Olfat and Pishdar (Citation2017) modeled a type-2 fuzzy for dynamic network DEA considering double frontiers. Based on those approaches, the proper approach for solving the uncertainty data is possibility approach (Hatami-Marbini et al., Citation2013).
The main objective of this paper is to construct a new approach, namely fuzzy DEA credibility constrained and RC index. In the proposed approach, the models are modeled as fuzzy variable; hence, the constraints are considered as fuzzy events. In doing so, the credibility measure also will be used to handle the uncertainty data, it is more practical to determine either inputs or outputs variable. Finally, the numerical example also will be presented to illustrate the effectiveness of the proposed approach.
The paper is organized as follows. In section 2, recalling the basic concept of DEA and RC index model. After that, developing the proposed approach is presented in section 3. In section 4, focus on discussing the numerical example that is divided into two parts (simple and complex). Section 5 concludes the paper.
2. Basic concept
2.1. Data envelopment analysis (DEA) model
The main issue of conventional DEA cannot cope with uncertainty data. In the group, decision-making has two main uncertainty data, such as ambiguity and vagueness (Fasanghari et al., Citation2015). The ambiguity refers to multiple interpretations of the expert, and vagueness is due to the lack of expert opinion precision. In order to solve these problems, the DEA credibility constrained model is applied to solve ambiguity, and RC index technique is applied for solve vagueness. CCR (Charnes-Cooper-Rhodes) model is the most common DEA models (Charnes et al., Citation1978). Furthermore, suppose there are jth DMUs, and each of the DMUs has m inputs (i = 1, …, n) and s output
(r = 1, …, m). In order to solve CCR model, the fractional programming (FP) can be used as follows:
Subject to:
(1)
is the efficiency of jth DMU with inputs (
) and outputs (
). The vi is valued for input weight and the ur is the output weight. Supposed DMU has efficiency score equals 1 (Ej = 1), it means the DMU is efficient; otherwise, it is inefficient.
2.2. DEA and RC index model
DEA is an appropriate method, simple modeling, non-parametric solution, and an effective approach for multi criteria decision-making. Moreover, DEA does not require a decision-maker to set the weights of the inputs and outputs. However, on several occasions, it is still common to find the same DMU values so that it is difficult to decide the best criteria (Kim et al., Citation2019). In the conventional DEA, the efficiency score of DMUs is possible to have several same score, and this causes impossible to decide the exact ranking of DMUs. In other words, the discrimination power of DEA is not satisfactory. To improve the discrimination power of DEA, Wang and Jean (Citation2006) proposed integrated DEA and RC index. In their paper, they compare two virtual DMUs, namely ideal DMU (IDMU) and anti-ideal DMU (ADMU), and it ranks them by the RC. In this proposed model, the efficiency score of IDMU () must be calculated first and the model as follows:
Subject to:
and
are the input and output of IDMU which are determined by
=
, and =
, respectively. Furthermore, let
is the optimum efficiency score of IDMU, and the next step is to determine the score of each DMU compared to the efficiency score of
, and the model as follows:
Subject to:
denotes the efficiency score of jth DMU compared to the efficiency score of . In the next step, determine the efficiency score of ADMU (
) by the following model:
Subject to:
and
are the input and output of IDMU which are determined by
=
, and
=
, respectively. Furthermore, let
is the optimum efficiency score of IDMU, and the next step is to determine the score of each DMU compared to the efficiency score of
, and the model as follows:
Subject to:
denote the efficiency score of jth DMU compared to the efficiency score of
. After determining the score of
,
,
, and
, the RC of DMUs to IDMU as follows:
3. Proposed approach
The model (2–5) is traditional model of integrated DEA with RC index model. Moreover, all the inputs and the output assumed to be crisp number in the traditional model. However, in the real situation, the assumption is not always true. Vagueness, as the main sources of uncertainty, refers to fuzzy input and output data from expert. To cope with this problem, the fuzzy DEA credibility constrained and RC index model are developed as a linear programming model to be useful in real problem. Furthermore, Meng and Liu (Citation2007) adopted the concept of fuzzy chance constraints programming (FCCP) on the DEA to cope with uncertainty data. Subsequently, we take the basic concept of credibility theory used to apply in the model (2–5), and it becomes a new model that is fuzzy DEA credibility constrained and RC index.
Definition 1 Let is a fuzzy variable with the distribution function
. A fuzzy variable is said normal if there exists a real number r such that
.
Definition 2 Let Pos and Nec be two particular fuzzy measure defined on (,U), where U is power set of
. Furthermore, Pos and Nec are a pair of dual fuzzy measures, and the model is Pos {A} = 1—Nec{AC} with AC is the complement of A.
Definition 3 The credibility measure model as follows:
For any A U.
Consider as triangular fuzzy number
which is known so the membership function as follows:
Based on the definition, a general fuzzy chance constraints programming model can be formulated as follows (Xiang Li & Liu, Citation2006):
Subject to:
Based on model (9), the first constraint () should be greater than or equal to
.
is a scalar of credibility level, and normally the credibility level should be greater than 0.5 (Meng & Liu, Citation2007; Y. Zhang et al., Citation2012). Furthermore, the fuzzy chance constraints programming should become deterministic model to simplify the optimization model. Theorem 1 is utilized to convert FCCP to their equivalent crisp ones.
Theorem 1 Let be and independent triangular fuzzy number
and be independent triangular fuzzy number
. Moreover, for any given credibility level
.
According to FCCP concept, the models (2), (3), (4), and (5) can be transformed into the credibility constrained model as follows:
Subject to:
Subject to:
Subject to:
Subject to:
According to theorems 1, the model (14), (15), (16), and (17) are converted to equivalent crisp ones as follows:
Subject to:
Subject to:
Subject to:
Subject to:
The model (16), (17), (18), and (19) are equivalent to the following model:
Subject to:
is the results obtained by referring to Equationequations 16(16)
(16) to 20. It shows that the efficiency score of each DMU decrease by increasing the credibility level. The results also indicated that the discrimination power is improved significantly in this step because all the DMUs are fully ranked in each credibility level. The real cause for improving the discrimination power is that in this proposed model, the output data are preserved by applying both the RC index and the credibility level parameters. Therefore, the highly discriminated results are generated without any loss of information.
Table 1. Represents an example of the simple data used in the method developed in this article. The data set used in this study consisted of 5 DMU candidates with two fuzzy inputs and two fuzzy outputs as the selection criteria.1 Data of 5 DMUs with 2 fuzzy inputs and 2 fuzzy outputs as follows
Table 2. The RC score of 5 DMUs under a different credibility level
Subject to:
Subject to:
Subject to:
According to the model above, a novel decision-making method using fuzzy DEA credibility constrained and RC index can be summarized in the following form.
Step 1:Determine the efficiency score of IDMU through solving model (16) or (20).
Step 2:Determine the efficiency score of DMUs, in comparison with the IDMU score through solving model (17) or (21).
Step 3:Determine the efficiency score of ADMU through solving model (18) or (22).
Step 4:Determine the efficiency score of DMUs, in comparison with the ADMU score through solving model (19) or (23).
Step 5:Rank the DMUs by RC through solving model (6).
4. Numerical example and discussion
In this section, we present the illustration of the proposed model using two numerical examples. The first example is a simple problem and the second example is a complex problem. Moreover, the data set is taken from random number. Step 1 to step 4 were computed by the general algebraic modeling system (GAMS) software, and MS-Excel solved step 5. In the calculation, the credibility level should be satisfied with the same level ().
Example 1. This situation has five DMUs that each DMU consists of two fuzzy inputs () and two fuzzy outputs (
). Furthermore, the data set is shown in .
The result of proposed approach with different credibility level (0.6, 0.7, 0.8, 0.9, and 1) is presented in . By set , the following ranking order was obtained: DMU1
DMU4 DMU2
DMU3
DMU5, where “
” is “better than”. Furthermore, the ranking of each DMU is same by increasing the credibility level to 0.7, 0.8, 0.9, and 1. Need to be noted that if the score of
is decreased by increasing credibility level, whereas the score of
increase by increasing credibility level as shown in .
Table 3. Data of 33 DMUs with five fuzzy inputs and two fuzzy outputs as follows
Example 2. This situation has thirty-three DMUs that each DMU consists of five fuzzy inputs () and two fuzzy outputs (
). Furthermore, the data set is shown in .
The result of proposed approach with different credibility level (0.6, 0.7, 0.8, 0.9, and 1) is presented in . It is clearly seen in that the ranking of the DMU changes and it is caused by credibility level. However, the different ranking of DMU is not too significant and by this approach can recognize which DMU is either the best or the worst. Furthermore, same like simple example, the score of decrease by increasing credibility level, whereas the score of
increases by increasing credibility level. show a detailed the relationship between RC score and the credibility levels in different number of DMUs.
Figure 1. Relationship between credibility level and RC score
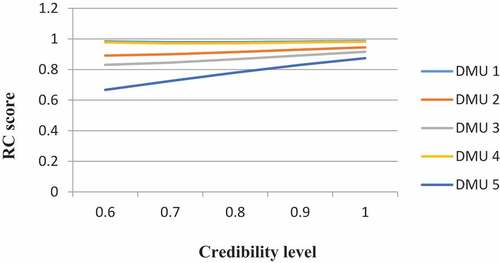
Figure 2. Pattern of the RC score in the different level of credibility
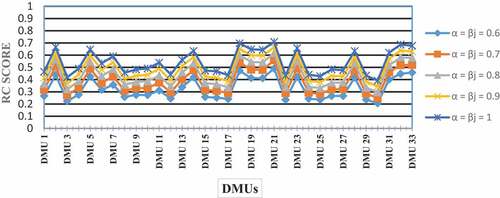
Table 4. The RC score of 33 DMUS under a different credibility level
The results of the simulation with small size data set indicate that each DMU has the same linear pattern in RC score when the level of credibility increases by 0.1. This result is in line with a study by Zhang and Guo (Citation2017) who found that there is a variation of results under different credibility levels on the flexible decision solutions. Other relevant study also shows that optimal decision-making could be obtained using the combination of the different level of credibility Li et al. (Citation2015).
The results of the simulation using 33 DMUs in the different of credibility levels result in a variation of RC scores (). The increasing value of credibility level from 0.6 to 1 produces a lower RC index, while the pattern of the graphs for each value of credibility level. In the case of the same value of RC score in DMUs such as in DMU 1 and DMU 2 which have the same RC score (0.765) in the credibility level of 0.6, the decision-making would be obtained by increasing the level of credibility. As seen in , by increasing the credibility level to 0.7, the RC score of DMU 1 drops to 0.674 and DMU 2 has the value of 0.653. Thus, the decision-making process would be easier to make after the credibility level changes.
These findings are in line with previous relevant studies results that indicate the function credibility level in decision-making process for different cases of applications such as in manufacturing industry for welding selection process (Wardana et al., Citation2020) and in agriculture industry for water allocation (Zamani et al., Citation2020; C. Zhang & Guo, Citation2017). Moreover, Fasanghari et al. (Citation2015) who incorporated the concept of Data Envelope Analysis (DEA) model into Enterprise Architecture (EA) with fuzzy credibility constrained program found that the model provide a useful solution for large-scale uncertainty decision-making problems. In the model of this article, the RC index would be the parameter to change the value of credibility level. As the value of RC scores for all the DMUs are different, it is not then necessary to change the credibility level to make decision.
5. Conclusion
To deal with uncertainty data, fuzzy set theory was proposed to combine with integrated DEA and RC index. Furthermore, this paper uses credibility constraint programming for solve fuzzy event, and finally the method that used is fuzzy DEA credibility constrained and RC index. Two cases such as simple and complex, are presented to demonstrate the implementation and interpreted the result with different credibility level. The credibility level of the proposed approach provides the flexibility for decision-maker to set their own acceptable credibility level in making decision. Moreover, the preserved output data applying by the integration of RC index and credibility level in this article are the cause of the discrimination power improvement. For further study, the number of experimental simulation would be beneficial to test the proposed approach for more robust results. In terms of the input and output data which are the conditions to be provided in this study, further experimental simulation might focus on the results of the conditions where input or output data is not provided.
Additional information
Funding
Notes on contributors
Ilyas Masudin
Rahmad Wisnu Wardana is a lecturer at Industrial Engineering department, University of Muhammadiyah Malang, Indonesia. His research interests are multi criteria decision making and operations management (E-mail: [email protected], tel: +62-341 464 318 ext. 166).
Ilyas Masudin is a Professor of logistics and supply chain at Industrial Engineering department, University of Muhammadiyah Malang, Indonesia. His research interests include logistics optimization and supply chain management (E-mail: [email protected], tel: +62-341 464 318, ext.166).
Dian Palupi Restuputri is a lecturer at Industrial Engineering department at the University of Muhammadiyah Malang. Her research interests are ergonomics and human factor engineering. (Email: [email protected], tel: +62-341 464 318 ext. 166).
Adhi Nugraha is a lecturer at Industrial Engineering department, University of Muhammadiyah Malang, Indonesia. His research interests are Industrial management and operations management (E-mail: [email protected], tel: +62-341 464 318 ext. 166).
References
- Calik, A., Pehlivan, N. Y., & Kahraman, C. (2018). An integrated fuzzy AHP/DEA approach for performance evaluation of territorial units in Turkey. Technological and Economic Development of Economy, 24(4), 1280–17. https://doi.org/10.3846/20294913.2016.1230563
- Charnes, A., Cooper, W. W., & Rhodes, E. (1978). Measuring the efficiency of decision making units. European Journal of Operational Research, 2(6), 429–444. https://doi.org/10.1016/0377-2217(78)90138-8
- Fasanghari, M., Amalnick, M. S., Taghipour Anvari, R., & Razmi, J. (2015). A novel credibility-based group decision making method for enterprise architecture scenario analysis using data envelopment analysis. Applied Soft Computing, 32(July 2015), 347–368. https://doi.org/10.1016/j.asoc.2015.03.052
- Hatami-Marbini, A., Tavana, M., Moradi, M., & Kangi, F. (2013). A fuzzy group Electre method for safety and health assessment in hazardous waste recycling facilities. Safety Science, 51(1), 414–426. https://doi.org/10.1016/j.ssci.2012.08.015
- Karami, S., Ghasemy Yaghin, R., & Mousazadegan, F. (2020). Supplier selection and evaluation in the garment supply chain: An integrated DEA–PCA–VIKOR approach. The Journal of the Textile Institute, 112(4), 1–18. https://doi.org/10.1080/00405000.2020.1768771
- Kim, S., Warinsiriruk, E., & Joy-A-Ka, S. (2019, 11-13 Dec). Estimation of welding machine flexibility by using Data Envelopment Analysis (DEA) with Relative Closeness (RC). Paper presented at the 2019 4th Technology Innovation Management and Engineering Science International Conference (TIMES-iCON). 1-5. Bangkok-Thailand. IEEE.
- Lertworasirikul, S., Fang, S.-C., Joines, J. A., & Nuttle, H. L. (2003). Fuzzy data envelopment analysis (DEA): A possibility approach. Fuzzy Sets and Systems, 139(2), 379–394. https://doi.org/10.1016/S0165-0114(02)00484-0
- Li, X., & Liu, B. (2006). A sufficient and necessary condition for credibility measures. International Journal of Uncertainty, Fuzziness and Knowledge-Based Systems, 14(5), 527–535. https://doi.org/10.1142/S0218488506004175
- Li, X., Lu, H., Li, J., Du, P., Xu, M., & He, L. (2015). A modified fuzzy credibility constrained programming approach for agricultural water resources management—A case study in Urumqi, China. Agricultural Water Management, 156(July), 79–89. https://doi.org/10.1016/j.agwat.2015.03.005
- Liu, J. S., Lu, L. Y. Y., & Lu, W.-M. (2016). Research fronts in data envelopment analysis. Omega, 58(January), 33–45. https://doi.org/10.1016/j.omega.2015.04.004
- Meng, M., & Liu, Y. (2007). Fuzzy data envelopment analysis with credibility constraints. Paper presented at the Fourth International Conference on Fuzzy Systems and Knowledge Discovery (FSKD 2007). 149-153. Hainan-China. IEEE.
- Mirhedayatian, S. M., Vahdat, S. E., Jelodar, M. J., & Saen, R. F. (2013). Welding process selection for repairing nodular cast iron engine block by integrated fuzzy data envelopment analysis and TOPSIS approaches. Materials & Design, 43(January), 272–282. https://doi.org/10.1016/j.matdes.2012.07.010
- Mohaghar, A., Fathi, M. R., & Jafarzadeh, A. H. (2013). A supplier selection method using AR- DEA and Fuzzy VIKOR. International Journal of Industrial Engineering,20(5–6), 387-400. https://journals.sfu.ca/ijietap/index.php/ijie/article/view/683
- Mousavi-Nasab, S. H., & Sotoudeh-Anvari, A. (2017). A comprehensive MCDM-based approach using TOPSIS, COPRAS and DEA as an auxiliary tool for material selection problems. Materials & Design, 121(1), 237–253. https://doi.org/10.1016/j.matdes.2017.02.041
- Olfat, L., Amiri, M., Bamdad Soufi, J., & Pishdar, M. (2016). A dynamic network efficiency measurement of airports performance considering sustainable development concept: A fuzzy dynamic network-DEA approach. Journal of Air Transport Management, 57(October), 272–290. https://doi.org/10.1016/j.jairtraman.2016.08.007
- Olfat, L., & Pishdar, M. (2017). Interval type-2 fuzzy dynamic network data envelopment analysis with undesirable outputs considering double frontiers: An application to Iran airports’sustainability evaluation. International Journal of Industrial Engineering, 24(6), 635–662. https://journals.sfu.ca/ijietap/index.php/ijie/article/view/3520
- Shabani, A., Saen, R. F., & Torabipour, S. M. R. (2012). A new benchmarking approach in Cold Chain. Applied Mathematical Modelling, 36(1), 212–224. https://doi.org/10.1016/j.apm.2011.05.051
- Wang, J.-T., & Jean, M.-D. (2006). Optimisation of cobalt-based hardfacing in carbon steel using the fuzzy analysis for the robust design. The International Journal of Advanced Manufacturing Technology, 28(9–10), 909–918. https://doi.org/10.1007/s00170-004-2123-6
- Wardana, R. W., Masudin, I., & Restuputri, D. P. (2020). A novel group decision-making method by P-robust fuzzy DEA credibility constraint for welding process selection. Cogent Engineering, 7(1), 1728057. https://doi.org/10.1080/23311916.2020.1728057
- Zamani, R., Ali, A. M. A., & Roozbahani, A. (2020). Evaluation of adaptation scenarios for climate change impacts on agricultural water allocation using Fuzzy MCDM methods. Water Resources Management, 34(3), 1093–1110. https://doi.org/10.1007/s11269-020-02486-8
- Zhang, C., & Guo, P. (2017). A generalized fuzzy credibility-constrained linear fractional programming approach for optimal irrigation water allocation under uncertainty. Journal of Hydrology, 553(October), 735–749. https://doi.org/10.1016/j.jhydrol.2017.08.008
- Zhang, Y., Huang, G., Lin, Q., & Lu, H. (2012). Integer fuzzy credibility constrained programming for power system management. Energy, 38(1), 398–405. https://doi.org/10.1016/j.energy.2011.11.035