
Abstract
Lakes and dams located in sediment-laden rivers infill with time which reduces the storage capacity and consequently the quality of aquatic life. Anthropogenic activities in Kenya’s Murera watershed have had significant impacts on storage capacity and water quality of Murera reservoir which inturn affects aquatic ecosystems. This study focused on the reservoir sedimentation assessment and examination of the sediment impacts on the storage loss in Murera reservoir dam. This was achieved by establishing the engineering concepts using the Bathymetric Survey System (BSS) comprising of navigation twin boat system (Dual Jon-boats) with an in-built Global Positioning System (GPS) for collecting spatial data. A multi-frequency acoustic system with frequencies of 200,50 and 12 kHz was used to determine the reservoir bed level, part of sediment layers, and deposited sediments, respectively, to pre-impoundment levels of the reservoir. Data processing and analysis were performed using Depthpic 5.0.2 Surfer 15.5, and ArcGIS 10.3 software. The results show that the reservoir depth increased from the North part to the South part of the reservoir with a maximum depth of 7.78 m and the reservoir water storage of 707,862.03 m3. Sediment deposition is concentrated in the southern part compared to the north part of the reservoir. The sediment layer thickness varied from 0 m up to 0.8 m (maximum) and the total sediment storage capacity of 117,683.39 m3, this implies that the reservoir lost 14% of its actual storage capacity. Results from this study provide pertinent information to policymakers in Kenya regarding the development, prioritization and assessment of mitigation and remediation strategies to address sedimentation problems in Kenya’s water resources.
PUBLIC INTEREST STATEMENT
Murera reservoir is located in Ruiru Sub-county, Kiambu County, Kenya. Anthropogenic activities in Kenya’s Murera watershed have had significant impacts on storage capacity and water quality of Murera reservoir which inturn affects aquatic ecosystems. This study focused on the reservoir sedimentation assessment and examination of the sediment impacts on the storage loss in Murera reservoir.
The results of the study show that there is high deposition of sediment at the southern part of the reservoir compared to the northern part. The sediment occupied a significant volume of the reservoir and this affected the storage capacity of the reservoir. If sedimentation is not checked in the watershed more storage volume will continue being lost to sediment which affects water ecosystems and livelihood that depend on the reservoir.
1. Introduction
Reservoirs are used worldwide to provide irrigation water, hydroelectricity, boating, fishing, flood management services, and multiple-use benefits or other forms of recreation. Lakes and reservoirs promote tourism and regulate seasonal flows by providing reliable flows (WMO, Citation2013; Sayers et al., Citation2015). During droughts or extended dry periods, the water level in the river may be very low and water is released from the reservoir so that downstream ecosystems can benefit. Reservoirs are a necessity in a world with high hydrologic variability, where the amount of water flowing in rivers varies seasonally and/or annually (Terakawa, Citation2003). In these areas, high-capacity reservoirs are required to store enough water for the dry spell.
Sedimentation affects the sustainability of operations and projects established in the reservoir or run of the river projects. Over time, sediments build-up in reservoirs and displace usable storage volume, which in turn negatively affects hydropower generation, reduces the reliability of the reservoir, irrigation, water supply, flood management services, and degrades aquatic habitat (Annandale et al., Citation2016; Icold, Citation2009; Rakhmatullaev et al., Citation2011). Soil erosion resulting from catchment athropogenic activities is a major contributor to reservoir sedimentation. The sediment is transported to rivers which later lead to reservoirs. The suspended solids are deposited in the settling zone of the reservoir when the settling velocity is exceeded. The gradual process of sedimentation proceeds with different speeds that depend on a large number of factors, such as hydrology of the catchments and the characteristics of the river basin (Kondolf et al., Citation2014).
Sediment is often both dissolved and solid with non-cohesive and cohesive properties. Dissolved loads are products of chemical weathering, and solid loads are delivered from the basins into the rivers through the action of rock weathering (Nichols, Citation2009; Webster, Citation2010). The quantity and type of sediment depend on the geology, topographic character, climate, vegetation type, and land use within the drainage basin (Dargahi, Citation2012; Webster, Citation2010). Sediment yield worldwide varies from one to more than 1,000 t/km2/year (Dargahi, Citation2012). Extreme high yields in the range 10,000–50,000 are reported for basins in China, Java, Kenya, New Guinea, and New Zealand (Dargahi, Citation2012)
The rate of loss to the storage capacity depends on the sediment yield of the river on which a reservoir is built, the morphologic factors of the reservoir, and the operational scheme of a project (Sundborg & White, Citation1982; Terakawa, Citation2003; White, Citation2005). Globally, the overall annual loss of reservoir storage capacity is estimated at 1 to 2% of the total storage capacity (Schleiss et al., Citation2008; Zarris & Lykoudi, Citation2017). In 1989, China’s large and medium-sized reservoirs had a total loss of 11.5 billion m3, accounting for 14.3% of the total capacity of 80.4 billion m3 (Terakawa, Citation2003). This shows that continuous monitoring of reservoir storage capacity is thus important to reservoir managers for it ensures a sustainable supply of water from the waterbodies (Maina et al., Citation2019).
The reservoir storage capacity loss and the periodic sedimentation rate are determined from the past and current bathymetric survey results or the status of sedimentation rate (Zarris & Lykoudi, Citation2017). The capacities and surface area differences derived from numerous bathymetric surveys for a reservoir provide an estimate of water capacity loss over time due to sediment deposition (Iradukunda et al., Citation2020; White, Citation2005).
Several scholars have carried sedimentation studies on lakes and reservoirs using various methods including mathematical modeling, bathymetric surveys, remote-sensing, sediment coring, and multi-frequency acoustic systems (Dargahi, Citation2012; Gadissa et al., Citation2018; Icold, Citation2009; Maina et al., Citation2019; Rahmani et al., Citation2018; Rakhmatullaev et al., Citation2011; Schleiss et al., Citation2008). However, little or no information is known about the Murera reservoir and yet the watershed is dotted with anthropogenic activities that would contribute to sedimentation and the consequent pollution of the water resource. The aim of this study therefore is to examine reservoir sedimentation and its effects on the storage capacity of the Murera reservoir using a bathymetric survey and a multi-frequency acoustic system.
2. Materials and methods
2.1. Description of the study area
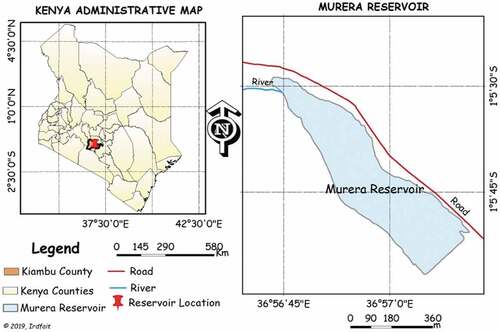
Murera reservoir is located in Ruiru Sub-county, Kiambu County, Kenya at Latitude 01°05′57”S to 01°05′28”S and Longitude 36°56′43”E to 36°57′10”E and at an elevation of 1,555 m above sea level. It is 32 km from Nairobi city and has a surface area of 22.2 ha. shows the location of Murera Reservoir in Kiambu County, Kenya.
Figure 1. Location of Murera reservoir
2.2. Hydrographic surveying of Murera Dam
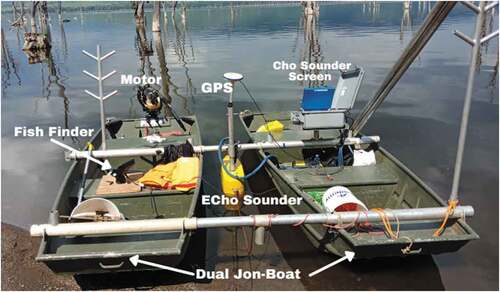
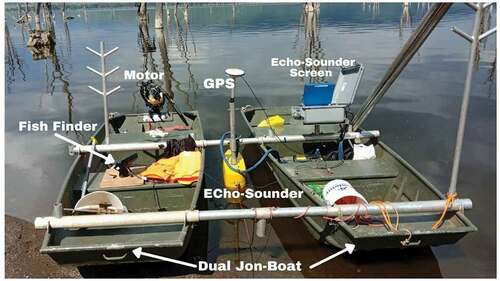
Hydrographic surveying was used in determining the reservoir storage capacity and reservoir sedimentation assisted by Bathymetric Survey System (). The depth measurements were taken with bathymetric survey equipment as one of the different ways of carrying out hydrographic surveying (Thissen, Citation2019; Yesuf et al., Citation2013). Sound pulses usually (200 kHz for surface detection) are sent from the transducer straight down into the water. The sound reflects off the reservoir floor and returns to the transducer. Acoustic penetration into the bed increases with decreasing frequency usually 50 kHz for subsurface detection and 12 kHz penetrated through the deposited sediment layers to pre-impoundment levels of the reservoir sedimentations (Iradukunda et al., Citation2020).
Figure 2. Bathymetry survey equipment set up
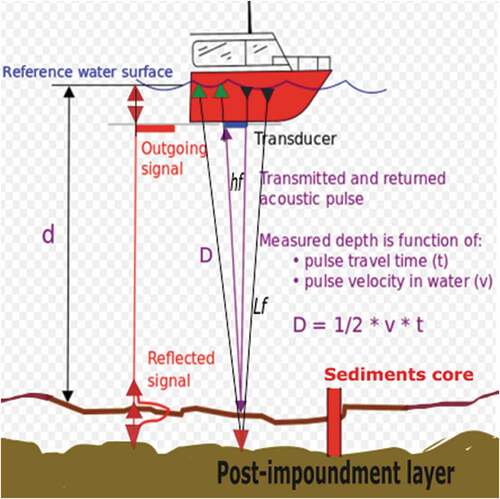
The data that were used in bathymetric maps come from an echo-sounder (sonar) attached beneath or over the side of a boat, pinging a beam of sound downward at the bottom of the lake. The time the sound takes to travel to the bottom and back is used to calculate the distance to the seafloor and to determine the geographic position (). The position information locating the boat at the time of the depth measurement is normally based on common land survey technology (Hassan et al., Citation2017; Iradukunda et al., Citation2020; Odhiambo & Boss, Citation2004; Sang et al., Citation2017; Yesuf et al., Citation2013). The determination of the reservoir’s actual water storage capacity is based on the proper estimation of the reservoir shape as accurately as possible. Therefore, by using water depth and sedimentation thickness, the extent of sediment in the reservoir is estimated (Odhiambo & Boss, Citation2004).
Figure 3. Acoustic depth measurement concept (Iradukunda et al., Citation2020) where the “d” is the depth of water, “D” is the depth to the post-impoundment layer, “t” is sound travel time and “v” is the sound velocity in water
2.2.1. Bathymetric survey data processing
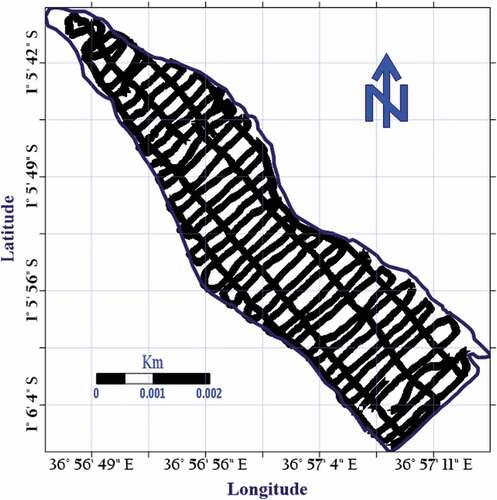
After collecting data using an acoustic multi-frequency system (Sonar-based device) in echo-sounding technology to determine the reservoir bed and sediments layers, the acquired data were first processed by editing the profiles in SDI’s Depthpic software (Specialty Devices Inc., Wyle, Texas) to extract geographic data for each navigation traces done in surveying. The Latitude, Longitude, and Altitude data were extracted in the form of X, Y, and Z as water depth. The final data from Depthpic were exported in ASCII text format and then imported in a Surfer 15 software (Golden Software, LLC; Colorado, USA) to track the waypoints followed in the bathymetric survey. The grid file was created from imported X, Y, Z data, and the Kriging interpolation method was used for accuracy purposes. The grid data file created in Surfer software was used to generate contour maps and to calculate the volume of water and sediment in Murera reservoir. The same process was used by (Iradukunda et al., Citation2020; Maina et al., Citation2018; Sang et al., Citation2017). The map presented in , shows the waypoints followed and recorded during the bathymetric survey of Murera reservoir.
Figure 4. Waypoints recorded during Murera reservoir bathymetric survey
All the necessary volumes together with surface areas were calculated consistently with their affiliative water depths. Using the built-in mathematical formulas, the volume and area were calculated by the software and report three different results from Trapezoidal Rule, Simpson’s Rule and Simpson’s 3/8 Rule (Hassan et al., Citation2017; Iradukunda et al., Citation2020; Maina et al., Citation2018; Sang et al., Citation2017; Yesuf et al., Citation2013). The surfer software reports were recorded successively at each 0.5 m depth intervals starting from Z = 0 as water surface level to 7.78 m as the deepest water level. In the case Z unit is not the same as X and Y units, the appropriate Z Scale Factor is used to convert from the Z units to the X and Y units. Because our Z unit was the same as our X and Y units, the appropriate Z Scale Factor remained to be 1. The reports were operated in a Microsoft Excel sheet to generate the cumulative and total volume of water and sediment in Murera Reservoir.
3. Results and discussion
3.1. Murera reservoir water storage
3.1.1. The reservoir profile and topographic characteristics
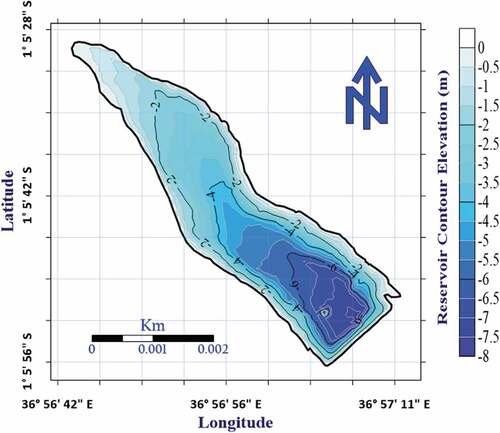
To illustrate the spatial distribution and to interpret the water depth variations that display the bottom relief features in the Murera reservoir, original surveyed data and XYZ data were overlaid on a grid-based file to produce a contour map (Hassan et al., Citation2017; Iradukunda et al., Citation2020; Odhiambo & Boss, Citation2004). The contour map showing present-day bathymetry and pre-impoundment topography of the Murera reservoir is presented in and clearly shows the topographic variation of the reservoir regarding the depth. The upper whitish color designates the reservoir surface from the shoreline to the reservoir depth, while the lower dark-blue color designates the deepest part of the reservoir. The contour map provides valuable information for irrigation, water supply, recreation purposes, and for monitoring long-term or temporal morphological changes for proper management and decision-making.
Figure 5. Murera reservoir contour map
3.1.2. Reservoir depth profile
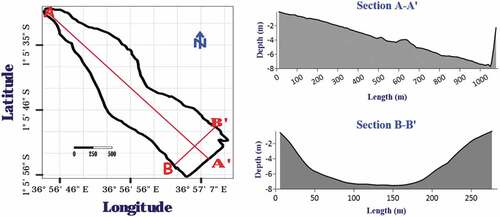
presents the longitudinal and transversal sections of Murera reservoir. The longitudinal sectional profile (Profile A-A’) shows that the reservoir depth increased from the North-West part to the South-East part of the Murera reservoir with a maximum depth of 7.78 m. The transversal section profile (Profile B-B’) that the reservoir depth increased from the shoreline to the central part and create a U-shaped curve.
Figure 6. Longitudinal and transversal water depth profile section for Murera reservoir
3.1.3. Reservoir water storage characteristics
The hypsographic curves and associated depth distributions were used to display the findings in an informative presentation. The curves were generated from the findings acquired during Murera bathymetric data analysis (Annex A1). They illustrate the data relationships between the reservoir depth, contour area, and the volume capacity of the reservoir dam. The affiliation has three figures: Volume-Area, Depth-Volume, and Depth-Area curves, then, their combination makes Depth-volume-area curve. The resulting volumes and contour areas against the depths of the reservoir in the interval unit are presented in .
Figure 7. A graphical representation chart of water depth, volume, Area (a) and volume, Area relationship for Murera reservoir
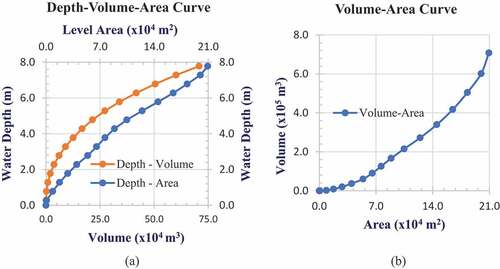
The increase in water volume and the water level area is proportional to the increase in the reservoir water depth. The total volume of Murera reservoir is 707,862.03 m3. The Depth-Volume-Area relationships present the findings in a significant and informative image of reservoirs that should be helpful in advanced analysis for operation, prediction of sediment distribution, and understanding of seasonal variations in water storage capacities. This is useful in determining the temporal variations in lake surface areas and volumes at different depths (Maina et al., Citation2018).
3.2. Murera reservoir sediment storage
3.2.1. Sedimentation profile in Murera reservoir
The map in shows the present-day sedimentation for Murera reservoir. It presents the sediment concentration or sediment dispersion regarding the thickness of the sediment layer in the reservoir dam. The longitudinal sections of Murera reservoir present the reservoir sedimentation profiles. To illustrate the spatial distribution and to interpret the variations of sedimentation in the reservoir for displaying the sediment concentration in the reservoir, the original surveyed XYZ data were overlaid on a grid-based file for producing a sediment dispersion map. The upper reddish color designates the thicker portion of the sediment layer, while the lower pallid color designates the thinner portion of the sediment layer in the dam.
Figure 8. (a) Map of Murera reservoir sediments dispersion and (b) the profile of sediment layer thickness
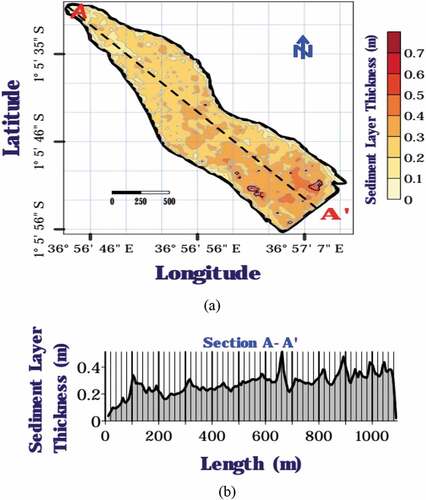
A series of sediment layer thickness varying from 0 to 0.8 m thick were used to show the detailed sedimentation profile of Murera Reservoir. The data analysis indicated that the maximum-recorded bed sediment layer thickness was observed in the southern part of the reservoir where the sediments attained a maximum thickness approximate to 0.7 m thick and above. The average sediment thickness observed in Murera reservoir was 0.28 m thick. Sediment in Murera reservoir is more concentrated in the southern part compared to the northern part of the reservoir. The amount of sediment in Murera reservoir originates from anthropogenic activity in the watershed particularly agriculture and then deposited in the dam by the river and runoff.
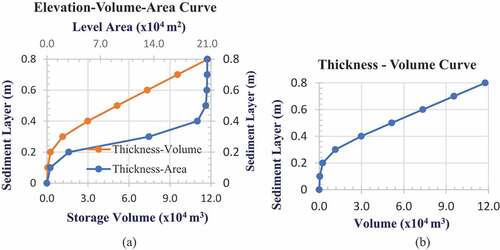
3.2.2. Reservoir sediment storage characteristics
The sedimentation map of Murera reservoir displays the sediment dispersal and layer thickness in the reservoir. The sediment layer thickness ranges between 0 m at the reservoir bed level to 0.8 m at the post-impoundment layer of the reservoir. The data table contains both partial and total volumes for the particular thickness of the sediments layer generated using surfer software and recalculated using the Prismatic method (Annex A2). The total storage capacity of sediments in the Murera Reservoir is 117,683.39 m3 as seen in . The sediment storage capacity is proportional to the sediment layer thickness, it increases as the layer thickness increase.
Figure 9. A graphical representation chart of sediment layer thickness, volume, area (a) and layer thickness, volume relationship for Murera reservoir
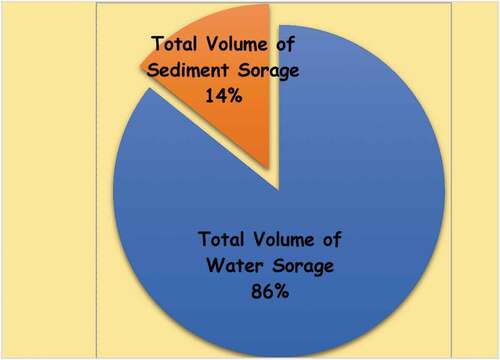
The changes in reservoir storage capacity are presented by the estimated quantity of accumulated sediment from the watershed and the quantity of the current water storage capacity in the reservoir. The total lost volume in Murera reservoir was estimated by the difference between the total volume of water in the reservoir and the total volume of sediment in the reservoir. The resulted findings show that Murera reservoir had lost 14% of its total storage capacity as seen in .
Figure 10. Murera reservoir storage loss
4. Conclusions and recommendations
Sedimentation and storage loss characteristics of Murera reservoir were examined using bathymetric survey and morphometric physiognomies based on echo-sounding of a mobile surveying system. The volume-depth, area, and length characteristics of Murera water and sediment were assigned. The results indicate an increasing sediment depth from the North part to the South part of the reservoir with a maximum depth of 7.78 m and the reservoir water storage of 707,862.03 m3. The total sediment storage capacity of Murera reservoir was found to be 117, 683.39 m3 and a sediment layer thickness varied between 0 and 0.8 m at the pre-impoundment layer of the reservoir. Sediment in Murera reservoir has occupied 14% of the total reservoir capacity attributed to the increase in anthropogenic activities around the dam. Multifrequency Acoustic Profiling System (APS) is a direct method useful for assessing sediment distribution within lakes or reservoirs. Although there were no prior comparable bathymetric surveys, the multifrequency APS method was used successfully to establish the thickness, distribution and volume of recent sediment in Murera reservoir. Results from this study provide pertinent information to policymakers in Kenya regarding the development, prioritization and assessment of mitigation and remediation strategies to address sedimentation problems in Kenya’s water resources.
Acknowledgements
The authors are grateful to Jomo Kenyatta University of Agriculture and Technology (JKUAT) and Pan African University, Institute of Science Technology and Innovation (PAUSTI) for all support made for this research study.
Additional information
Funding
Notes on contributors
Parfait Iradukunda
Parfait Iradukunda is a Ph.D. candidate of Construction Engineering and Management at University of Zambia. He is a consultant with CSHEI construction company ltd in Rwanda. He is a corporate member of Institute of Engineers Rwanda (IER). He has 5 years’ experience in hydrology and Civil Engineering. He obtained his BSc. degree in Civil engineering (With Honours) from INES-Ruhengeri, Rwanda and MSc. degree in Civil Engineering at Pan African University Institute for Basic Sciences Technology and Innovation (PAUSTI) and Jomo Kenyatta University of Agriculture and Technology (JKUAT); Kenya. His research interests are construction performance and sustainability, sedimentation studies, irrigation and drainage, flood modelling studies, environmental and climate change adaptations.
References
- Annandale, G. W., Morris, G. L., & Karki, P. (2016). Extending the life of reservoirs: Sustainable sediment management for dams and run-of-river hydropower. The World Bank.
- Dargahi, B. (2012). Reservoir sedimentation. In Encyclopedia of earth sciences series, L. Bengtsson, R.W. Herschy, and R.W. Fairbridge(Editors). Springer, Dordrecht, The Netherlands, pp. 628–14
- Gadissa, T., Nyadawa, M., Behulu, F., & Mutua, B. (2018). The effect of climate change on the loss of lake volume: Case of sedimentation in Central Rift Valley Basin, Ethiopia. Hydrology, 5(4), 67. https://doi.org/10.3390/hydrology5040067
- Hassan, R., Al‐Ansari, N., Ali, A. A., Ali, S. S., & Knutsson, S. (2017). Bathymetry and siltation rate for Dokan Reservoir, Iraq. Lakes & Reservoirs: Research & Management, 22(2), 179–189. https://doi.org/10.1111/lre.12173
- ICOLD (2009) Sedimentation and Sustainable Use of Reservoirs and River Systems Draft Icold Bulletin. International Commission on Large Dams (ICOLD), Paris
- Iradukunda, P., Sang, J. K., Nyadawa, M. O., & Maina, C. W. (2020). Sedimentation Effect on the Storage Capacity in Lake Nakuru, Kenya. JOURNAL OF SUSTAINABLE RESEARCH IN ENGINEERING, 51, 149–158. Retrieved from https://jsre1.jkuat.ac.ke/index.php/jsre/article/view/97
- Kondolf, G. M., Gao, Y., Annandale, G. W., Morris, G. L., Jiang, E., Zhang, J., Cao, Y., Carling, P., Fu, K., Guo, Q., Hotchkiss, R., Peteuil, C., Sumi, T., Wang, H.-W., Wang, Z., Wei, Z., Wu, B., Wu, C., & Yang, C. T. (2014, May). Sustainable sediment management in reservoirs and regulated rivers: Experiences from five continents. Earth’s Future, 2(5), 256–280. https://doi.org/10.1002/2013ef000184
- Maina, C. W., Sang, J. K., Mutua, B. M., & Raude, J. M. (2018). Bathymetric survey of Lake Naivasha and satellite Lake Oloiden using acoustic profiling system. Lakes & Reservoirs: Research & Management, 23(4), 324–332. https://doi.org/10.1111/lre.12247
- Maina, C. W., Sang, J. K., Raude, J. M., Mutua, B. M., & Moriasi, D. N. (2019). Sediment distribution and accumulation in Lake Naivasha, Kenya over the past 50 years. Lakes & Reservoirs: Research & Management, 24(2), 162–172. https://doi.org/10.1111/lre.12272
- Nichols, G. (2009). Sedimentology and stratigraphy (2nd ed.). Wiley.
- Odhiambo, B. K., & Boss, S. K. (2004). Integrated echo sounder, GPS, and GIS for reservoir sedimentation studies: Examples from two Arkansas Lakes. Journal of the American Water Resources Association, 40(4), 981–997. https://doi.org/10.1111/j.1752-1688.2004.tb01061.x
- Rahmani, V; Kastens, J.H.; DeNoyelles, F.; Jakubauskas, M. E.; Martinko, E.A.; Huggins, D.H.; Gnau, Christian; L., Paul M.; Campbell, Scott W.; Callihan, Ryan A.; Blackwood, Adam J. 2018. “Examining Storage Capacity Loss and Sedimentation Rate of Large Reservoirs in the Central U.S. Great Plains„ Water 10, no. 2: 190. https://doi.org/10.3390/w10020190
- Rakhmatullaev, S., Marache, A., Huneau, F., Le Coustumer, P., Bakiev, M., & Motelica-Heino, M. (2011). Geostatistical approach for the assessment of the water reservoir capacity in arid regions: A case study of the Akdarya reservoir, Uzbekistan. Environmental Earth Sciences, 63(3), 447–460. https://doi.org/10.1007/s12665-010-0711-3
- Sang, J. K., Raude, . J. M., Mati, B. M., Mutwiwa, U. N., & Ochieng, F. (2017). Dual Echo Sounder Bathymetric Survey for Enhanced Management of Ruiru Reservoir, Kenya. JOURNAL OF SUSTAINABLE RESEARCH IN ENGINEERING, 3(4), 113–118. Retrieved from https://jsre1.jkuat.ac.ke/index.php/jsre/article/view/64
- Sayers, P., Galloway, G., Penning-Rowsell, E., Yuanyuan, L., Fuxin, S., Yiwei, C., Kang, W., Le Quesne, T., Wang, L., & Guan, Y. (2015, April). Strategic flood management: Ten ‘golden rules’ to guide a sound approach. International Journal of River Basin Management, 13(2), 137–151. https://doi.org/10.1080/15715124.2014.902378
- Schleiss, A. J., De Cesare, G., & Althaus, J. J. (2008). Reservoir sedimentation and sustainable development. CHR Workshop Erosion, Transport and Deposition of Sediments.Berne, Switzerland
- Sundborg, A., & White, R. W. (1982). Sedimentation problems in river basins. Project 5.3 of the International Hydrological Programme. United Nations Educational, Scientific and Cultural Organization (UNESCO).
- Terakawa, A. (2003). Hydrological data management: Present state and trends (Vol. 48). The World Meteorological Organization (WMO).
- Thissen, J. J. M. (2019). Automating surface water detection for rivers the estimation of the geometry of rivers based on optical earth automating surface water. The University of Twente.
- Webster, R. (2010, May). Sedimentology and stratigraphy. European Journal of Soil Science, 61(2), 315–316. https://doi.org/10.1111/j.1365-2389.2009.01225.x
- White, S. (2005). Sediment yield prediction and modeling. In Encyclopedia of hydrological sciences. M G Anderso.John Wiley & Sons, Ltd
- WMO (2013). Integrated Flood Management Tools Series: Coastal and Delta Flood Management. (Issue 17)
- Yesuf, H. M., Alamirew, T., Melesse, A. M., & Assen, M. (2013). Bathymetric study of Lake Hayq, Ethiopia. Lakes & Reservoirs: Research & Management, 18(2), 155–165. https://doi.org/10.1111/lre.12024
- Zarris, D., & Lykoudi, E. (2017). Οptimum volumetric computation of fluvial sediment deposits in reservoirs by a comparative analysis of different hydrographic survey methodologies. IOSR Journal of Applied Geology and Geophysics, 5(3), 75–80. https://doi.org/10.9790/0990-0503017580
Annex
Table A1. Murera reservoir water storage and affiliative level area
Table A2. Murera reservoir sediment storage and affiliative level area