
 ?Mathematical formulae have been encoded as MathML and are displayed in this HTML version using MathJax in order to improve their display. Uncheck the box to turn MathJax off. This feature requires Javascript. Click on a formula to zoom.
Abstract
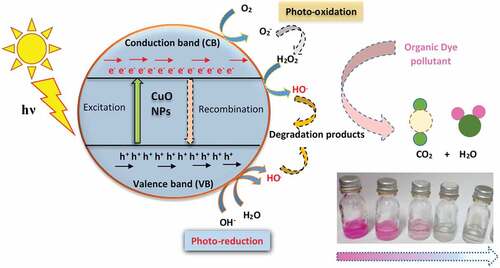
When organic dye-containing wastewater from textile industries are sometimes released into the environment, the liquids tend to pollute the environment whilst their solid residue accrues on land after the evaporation of the water. Most of these synthetic compounds are known to be poisonous and carcinogenic to living organisms. For this study, a relatively simple, sustainable and cost-effective approach have been utilized to synthesize CuO nanoparticles using copper precursor salts: (CuSO4.5H2O) and (Cu(NO3)2.3H2O), as a remedy for dye pollution reduction in water. Due to their simplicity of synthesis, insignificant harmfulness and cost, copper (II) oxide (CuO) nanoparticles were used to breakdown three generally utilized dyes; Rhodamine B (RhB), Methylene Blue (MB)- [Methylthioninium chloride] and Methyl Orange (MeO). The as-prepared nanoparticles were characterized to determine the ordered arrangement of atoms, functional groups, weight loss, thermal properties, microstructure and surface characteristics. Most significantly, the predominant preferential crystal growth was along the {002}/{-111} plane for the sulphate-based precursor whiles for the nitrate based precursor, it was preferentially grown along the {111} direction. The mesoporous nanoparticles had average crystallite sizes of 12 nm and 15 nm; and BET surface areas of 42.9 m2/g, and 69.6 m2/g respectively. The as-prepared nanoparticles were assessed for their photocatalytic behaviour in response to visible light exposure for 100 minutes at 25-min’ intervals. The nitrate precursor-based CuO photocatalysts showed relatively higher photodegradation efficiency (MeO-94.3%; MB- 90.6%; RhB - 99.6%) as compared with the sulphate precursor-based CuO photocatalysts (MeO-85.2 %; MB- 87.9%; RhB- 98.8%).
Public interest statement
Textile dye pollutants with the wastewater from industries which make use of such dyes are sometimes released into the environment. These contaminate both water bodies and the surrounding land environment. These chemicals are noted for their toxicity to living organisms and they can cause cancers in human beings when ingested. This paper explores the development of a worthwhile dye polluted waste water treatment process using a nanostructured photocatalysts (CuO) and the significantly accessible sun light. In the presence of water, photocatalysts when illuminated with light creates reactive species (radicals) which can attack and break down organic dye molecules into harmless compounds. This paper reports that photocatalysis using nanostructured cupric oxide produced under different conditions is very effective in breaking down textile dye pollutants in water when sunlight is shone on the mixture.
1. Introduction
Nanostructured semiconducting materials have over the years inspired intensive research activities for several applications because of their unique characteristics such as their high surface-to-volume ratio, and quantum confinement effects at the nanometre scale. As industrialization rapidly evolves, substantial quantity of waste keeps being discharged into the environment which tends to negatively affect the quality of water for everyday use (Agbe et al., Citation2018; Dodoo-Arhin et al., Citation2018; Omaish et al., Citation2015). Organic dyes (Azo and Xanthene) have a wide variety of applications in numerous industries such as the paper and pulp, edible confectionaries, and leather tanning industries. This makes their utilization on a large-scale, unavoidable. A primary characteristic of Azoic dyes is the unique N = N chromophoric units whiles that of Xanthene is the yellow solid organic compound with the formula CH2[C6H4]2O that is soluble in common organic solvents (Benkhaya et al., Citation2020). With the textile industry having about 60–70% usage of all available commercial dye products (Saggioro et al., Citation2011), the dye pollutants from these industries tend to contaminate the environment especially water bodies; when they are indecorously disposed-of (Habib et al., Citation2013; Rahman et al., Citation2014; Rezig & Hadjel, Citation2014). Furthermore, recent advances in environmental remediation strategies such as photocatalysis and flocculation have been researched as an alternative technique for purification of dye-polluted water (Agbe et al., Citation2018; Diko et al., Citation2020). Photocatalysis using porous nanostructured semiconducting transition metal oxide photocatalysts such as TiO2, SnO (Byberg et al., Citation2013), ZnO and Cu2O (Agbe et al., Citation2019) seem to be the most suitable approach due to the fact that these photocatalysts are energetically sustainable, and can be easily used in combination with other catalysts. These nanostructured semiconductors are environmentally benign, and possess suitable characteristics needed to facilitate dye decomposition; albeit, under specific process conditions.
When investigating complex cuprates, copper oxides can be used as reference materials, since most cuprates have shown high-Tc superconductivity due to a Jahn-Teller distortion associated with the structural characteristics of their divalent copper monoxide structure. This phenomenon tends to introduce strong electron–phonon interactions for the impartation of the required superconductivity and photocatalytic dye degradation process (Kamimura et al., Citation2005). To fully understand the origin and mechanism of this phenomenon, numerous studies have ensued on simple and complex copper oxides (Elwell et al., Citation2017). Cupric oxide (CuO) is unique amongst many of the oxides within the 3d transition series. This is largely because of its unique monoclinic structured planar square coordination. The copper bonds with oxygen in a four coplanar arrangement within a distorted tetrahedral environment, and at the same time being coordinated by four other copper atoms. Two sets of chains directed along the [110] and staggered along the [001] planes then form a three dimensional crystal structure of the CuO (Åsbrink & Norrby, Citation1970; Tunell et al., Citation1935). Overall, some research interest on Tenorite (CuO), a p-type semiconductor, is based on its ease of synthesis, benignity to organisms and ease of engineering to give it a variety of morphologies at the nanoscale level which can be enhanced for high catalytic activity by narrowing the energy band-gap within 1.2–1.8 eV (Bhattacharjeea & Ahmaruzzaman, Citation2016). in view of these, CuO has found applications in catalysis, solar energy systems, super-capacitors, and as electrode material for lithium-ion batteries (Shaikh et al., Citation2011).
Exposing the wastewater containing a dye to visible light in the presence of CuO culminates in their degradation via an oxidation reaction mechanism associated with valence-hole creation, with electrons in the conduction bands being responsible. Movement of electrons out of the valence band, generates unstable free radical species with a high oxidation potential. Their availability and contact with the dye molecules in the wastewater, results in its decomposition to by-products which are less harmful (Tran & Nguyen, Citation2014). Several techniques have been used to synthesize CuO nanostructures with different morphologies. The synthesis techniques include microemulsion synthesis, sonochemical deposition, chemical vapour deposition, double-jet precipitation, high-temperature synthesis, etc. (Black et al., Citation2010). In this research work, we investigate the influence of precursor salt (CuSO4.5H2O and Cu(NO3)2.3H2O) for the synthesis of CuO nanoparticles for the light-aided catalytic decomposition of the following dyes: Methyl Orange, Methylthioninium chloride (Methylene Blue), and Rhodamine B under varied durations of visible light illumination. Several characterization techniques were used to investigate the structural, thermal, optical and microstructural properties of the synthesized copper oxide samples.
2. Materials and methods
2.1. Synthesis of the copper oxide nanoparticles
In this research, analytical grade chemicals and reagents were used without further purification. These include copper(II) nitrate trihydrate (Cu(NO3)2.3H2O), copper sulphate pentahydrate (CuSO4. 5H2O), sodium hydroxide (NaOH), Rhodamine B dye (C28H31ClN2O3), distilled water, methyl orange (C14H14N3NaO3S), methylene blue [Methylthioninium chloride -(C16H18ClN3S)], 30% hydrogen peroxide (H2O2) and ethanol (C2H5OH).
Simple solution precipitation reaction method was adopted to synthesize the copper oxide (CuO) nanoparticles by using two (2) different precursors. In the typical synthesis process, the copper salts ((Cu(NO3)2.3H2O) and (CuSO4.5H2O)) were separately dissolved in deionised water to prepare 0.02 M aqueous precursor solution, heated to a temperature of 60°C and then 1.6 g/L NaOH pellets added under constant stirring. The sky blue solution changed to milky blue and then gradually changed into a dark-brown precipitate. The reaction was allowed to continue for about 30 min till all blue precipitate converted into the dark brown copper oxide particles. The solution was allowed to cool to room temperature; the precipitate subsequently centrifuged and rinsed with distilled water and ethanol (1:1) several times, then oven dried (70°C) to obtain CuO powder for analysis and photocatalytic application. The CuO powder obtained using the sulphate precursor is denoted as CuO-S60 whiles those obtained using the Nitrate precursor, denoted as CuO-N60.
2.2. Characterisation of the copper oxide nanoparticles
The obtained CuO nanoparticles were then characterised using X-Ray Diffraction (XRD), Fourier Transform Infra-Red (FT-IR) spectroscopy, TG-DTA, Scanning Electron Microscopy (SEM) and Brunauer–Emmett–Teller (BET) surface area analysis to determine some primary attributes, i.e. the ordered arrangement of atoms, functional groups, weight loss, thermal properties, the microstructure and surface characteristics (e.g., porosity), respectively. The detailed analytical methods (qualitative) included powder x-ray diffraction (PXRD) to generate profiles within a 20°- 70° 2θ range using 14 s per step at a step size of 0.017°. The attainment of diffraction profiles of all synthesized CuO powders was conducted using a theta-theta geometry aligned Panalytical Empyrean diffractometer with a Cu Kα (λ = 1.5406 Å) radiation tube (40 kV, 45 mA). Subsequently, a qualitative phase analysis was conducted based on the ICSD database using the X’Pert Highscore plus search match software (Panalytical, Netherlands). Furthermore, a NIST SRM 640d (Si) standard was used for the instruments’ resolution contribution to the diffraction profiles generated (Caglioti et al., Citation1958), with the finalised peak profiles being comparatively analysed, taking into consideration their shape and breadth, by applying constrained symmetrical pseudo-Voigt functions to the Caglioti equation (Leoni et al., Citation2006). For microstructure analysis, a one-step microstructure parameter refinement strategy in PM2K software (Scardi & Leoni, Citation2002) was adopted for whole powder pattern modelling (WPPM) (Luk et al., Citation2015).
The morphological examinations were conducted on a TESCAN Vega-3 Scanning Electron Microscope equipped with EDX analysis software operating within 0.2–30 kV and 2 × 10⁻⁵ ms—10 ms per pixel scanning speed on a 0.5 g sample. Prior to the analysis, the CuO powder samples were sputter covered with a thin carbon film to make them conductive and permit for higher magnifications.
The surface functional groups were recorded on a PerkinElmer Spectrum Two (PerkinElmer Inc., UK) Fourier Transform Infrared (FTIR) spectrometer. Spectra data were recorded within the 4000–400 cm−1 spectral range in transmission mode, resolution of 4 cm−1, and analyzed using the Spectrum 10 software.
The optical property of the nanoparticles was determined on a Thermo Fisher Scientific GENESYS™ 10S UV-Vis Spectrophotometer operated in absorbance mode within a scanning range of 200–900 nm and a 5 nm scan per step.
Specific surface area and porosity measurements were conducted on a Tristan II 3020 version 2 (Micrometrics, USA) sorption analyzer by means of the multipoint Brunauer-Emmett-Teller (BET) typical procedure. Preceding the data collection, 0.4 g of the powder specimens were degassed in vacuity at a temperature of 350°C for 24 h using a liquid nitrogen medium and an adsorbate at 77 K. Complete isotherm scans were run between the relative pressures of 4E−6 to 1. The information obtained from the BET profiles, i.e. monolayer adsorption/desorption adsorbate profiles, were used for surface area including pore size volume determined using a Barrett-Joyner-Halenda (BJH) analysis, respectively (Zhang et al., Citation2014).
2.3. Photocatalytic activity
The photocatalytic activity of the copper oxide nanoparticles from the two precursors were evaluated by determining the decomposition of Rhodamine B, Methyl Orange, and Methylene Blue dyes under visible light irradiation. The experiments were carried out in a 100 mL capacity glass photochemical reactor using a 400 Watt (W) medium pressure mercury visible light source. A solution (200 ml) containing Rhodamine B dye (0.01 g) was used by mixing the dye with distilled water subsequent to H2O2 (1.5 ml) addition as a mediator for increased free radical generation to enhance the photodegradation process using nanostructured CuO as a semiconductor (Modec et al., Citation2020). A suspension using 0.1 g of the as prepared CuO nanoparticles in distilled water (50 mL) was prepared separately to which a dye solution (30 ml) was added prior to visible light irradiation. This suspension was stirred for 30 min in the dark at 1000 rpm for optimised dye adsorption on the CuO particles. Thereafter, the suspension was exposed to visible light (400 W) with periodic sampling at 25 min intervals using polypropylene syringes. The sample aliquots were immediately centrifuged to separate the CuO from the water matrix at 5000 rpm for 10 min to obtain a particle free supernatant. To determine dye removal, a Pelkin-Elmer Two UV-Vis spectrophotometer was used at a scanning range of 200 to 800 nm with the light absorption of the supernatant being quantified in a 3 ml plastic cuvette. For photocatalysis, the light irradiation times were 0, 25, 50, 75, and 100 min. The photocatalytic procedure was repeated as described above for each of the dyes using the as-prepared nanoparticles.
3. Results and discussion
3.1. Synthesis of the copper oxide nanoparticles
In aqueous solution, Cu(NO3)2.3H2O and CuSO4. 5H2O dissociates into [Cu(H2O)6]2+ ions (responsible for the sky blue colorations) and NO3− or SO42- anions. Coordination of the NO3− or SO42- anions with other copper ions may partially occur in the solution. Concerning the [Cu(H2O)6]2+ complex, the structural geometry is such that the Cu2+ ion is completely surrounded by a number (n = 6) of water molecules which results in a shielding effect. Furthermore, the interaction of the water molecules with the dissolved Cu2+ ions form a square-planar solvation complex geometric structure (Cu(OH)42-) with the other water molecules (n = 4) situated at its axis. Such complexes are well described by the anionic coordination polyhedral theoretical model (Sambandam et al., Citation2005), with both the Cu2+ existing in the form of complexes whose ligands are OH− ions. For each growth unit, the coordination number will be equivalent to that of the crystal formed. The proliferation of these growth units and their incorporation into the crystal nucleus is largely dependent on dehydration. For this study, the growth unit of the synthesized CuO nanocrystals will then be the intermediate Cu(OH)64-ions which forms a coordinating octahedron structure with the NaOH in solution. Overall, the binding energies of the coordinating OH-groups are different based on their location in the octahedron structure: the binding energies of the OH− ions concentrated around the octahedron axis are higher than those located on the plane axis (Koehler et al., Citation2014). For this case, the arrangement is such that two OH− ions will be located on the perpendicular axis, with some OH- ions (n = 4) being arranged on a planar square geometry. Meaning, the OH− ions on the octahedron axis are easily replaceable which will culminate in higher dehydration-related CuO nanostructure growth on the axis than on the plane. Thus, the variance in the morphological structure of numerous CuO semiconductors (e.g., nanorods, nanobelts, nanowires, etc) is associated with variability in the growth rates along the crystallographic plane. Therefore, such a variation in the growth rates can be influenced by synthesis conditions one of which is temperature as illustrated elsewhere (Black et al., Citation2010), with the reactions leading to the formation of the CuO nanoparticles being illustrated as in EquationEquations 1 to 6.
Or
For example, when adding NaOH to a low-temperature synthesis precursor solution, interconnected hydrogen bonds may form within the hydroxyl groups of the Cu(OH)64- complex: one consequence of this will be the limited directional growth which will culminate into a variety of shapes for the formed nanocrystals (Vashistha et al., Citation2016). However, this is not observed at higher temperatures (25 °C < T < 100 °C) whereby nucleation and growth rates will not be hampered as the hydrogen bonds will be increasingly debilitated with temperature. In this research, and to avoid evaporation due to thermo-agitation effects, a median temperature of 60°C was chosen, which was also deemed sufficient for the reaction to proceed.
3.2. X-ray diffraction, electron microscopy, and energy dispersive X-Ray Spectroscopy (EDX) analyses
The XRD patterns () of the two synthesized CuO samples, showed that the tenorite phase was produced both for the nitrate and sulphate-based precursors with different crystal growth directions. Most significantly, the predominant preferential crystal growth was along the {002}/{-111} plane for the sulphate-based precursors whiles for the nitrate-based precursor, it was preferentially grown along the {111} direction. In light of the bigger dimension of the sulphate ion in contrast with the relatively small-sized nitrate ions in solution, there is the possibility that the solvated nitrate ions cause a shielding effect on the interaction between the Cu2+ ions and the water molecules leading to the formation of a Cu(OH)64- complex structure. The described phenomenon in the case of the nitrate precursor-based system, could bring about smaller and robust Cu-O bonds resulting in smaller crystallite sizes contrasted with those coming from the sulphate precursor-based system as seen in this work.
Figure 1. (a) XRD plots of the CuO nanoparticles showing different preferential crystallographic growth directions. (b) Modelled XRD patterns for (i) CuO-S60, and (ii) CuO-N60. (c) Lognormal distribution of crystallite sizes
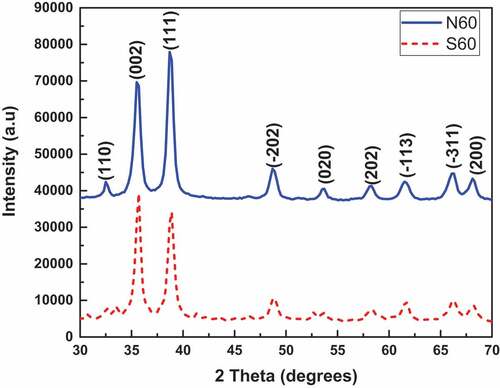
Figure 1. Continued
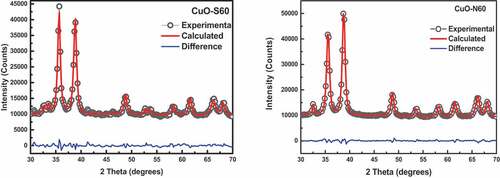
Figure 1. Continued
From , it can be discovered that for the CuO specimen prepared utilizing the nitrate-based precursor (CuO-N60), the most compactly packed crystal planes (preferential crystallographic plane for the growth of crystals) are the {111}. This could be attributed to that fact that the copper oxide keeps up the majority of its mainstay structure, which begins from a principal metallic copper crystal lattice (Modec et al., Citation2020) in which the {111} planes are the most compactly packed. For the sulphate precursor-based CuO nanoparticles (CuO-S60), the predominant preferential crystal growth was along the {002}/{-111} plane.
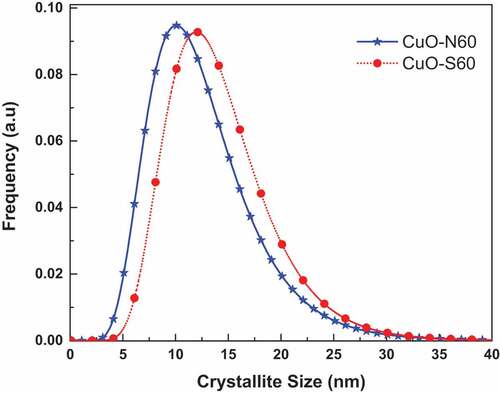
For whole powder profile modelling (WPPM) of the XRD profiles, using the one-step microstructure parameter refinement strategy in the PM2K software (Luk et al., Citation2015), the microstructures of copper oxide specimens are shown in (). The WPPM was conducted taking into consideration the presence a unimodal lognormal distribution of spherical crystallites (). The distribution function computes analytical Fourier coefficients corresponding to a distribution of crystallite of a given shape (e.g., sphere”, “cube”, “tetrahedron”, “octahedron”, “cylinder”, etc.). Typically, the normalised positively defined function g(D) for the lognormal distribution of crystallites is given as (Luk et al., Citation2015):
where D is the crystallite size, σ is the variance and µ is the lognormal mean of the distribution. The analytical Fourier coefficients for the distribution are obtained using EquationEquation. (8(8)
(8) ) (Luk et al., Citation2015):
where g (D) is the chosen crystallite size distribution, Ac (L, D) is the Fourier transform corresponding to the chosen crystallite shape and K is a constant depending on crystallite shape and orientation of the crystallite with respect to the unit cell (i.e., K = K (h, k, l, shape)).
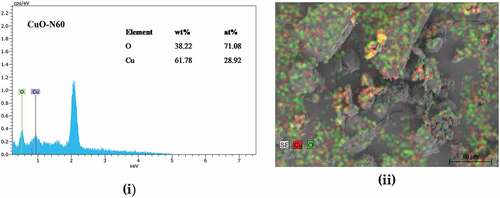
The outcome of the WPPM concurred with observed data, which suggested that the assumption made of a uniaxial shape was valid for the crystallites investigated. From the lognormal distribution of spheres (), the average crystallite size ranges from∼12 nm (CuO-S60) and 15 nm (CuO-N60). The SEM images in () indicate the synthesis of agglomerated “hairy” nanostructures for the two conditions investigated. This suggested the validity of an earlier explanation that the synthesized CuO nanocrystal at median temperature would have 2D-based axes growth, as observed in the images attained, which clearly demonstrate a self-alignment of nanostructured spherical particles arranged in a clearly observable hair-like structure. Further evidence was provided by the XRD spectra which was consistent with hair-like structure spectra of similar aligned and sized nanoparticles. From this, it was deduced that there was non-occurrence of a suitable epitaxy, i.e. that the nanocrystals were aligned along rods without a crystallographic relationship. and (b) exhibits the energy dispersive x-ray (EDX) spectra and the corresponding atomic weight distributions for the CuO-S60 and CuO-N60 specimens, respectively. The weight percent (wt %) and atomic percent (at %) demonstrate plainly that the atoms in the specimen exist in an almost 1:1 mole proportion which is the situation in the CuO compound. This subsequently further affirmed that the prepared particles were single phased CuO nanoparticles.
Figure 2. SEM images of (a) CuO-S60 and (b) CuO-N60
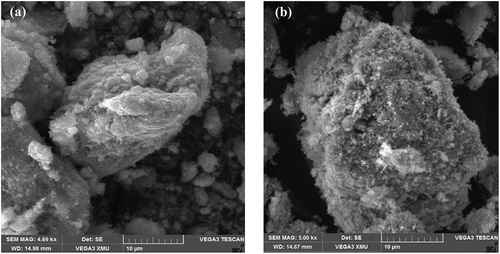
Figure 3. (a) (i) Energy dispersive x-ray spectrum and (ii) atomic weight distribution of Cu and O in CuO-S60 sample. (b) (i) Energy dispersive x-ray spectrum and (ii) atomic weight distribution of Cu and O in CuO-N60 sample
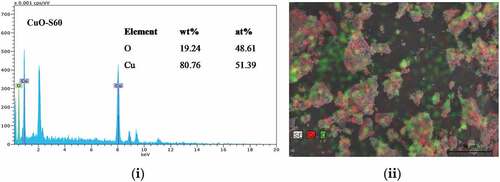
Figure 3. Continued
3.3. UV-VIS and FTIR spectroscopy analyses
The absorbance spectra for the CuO specimen as presented in exhibit wide shoulders from 255 nm to 450 nm.
Figure 4. UV-Vis spectra of the as-prepared nanostructured CuO specimen
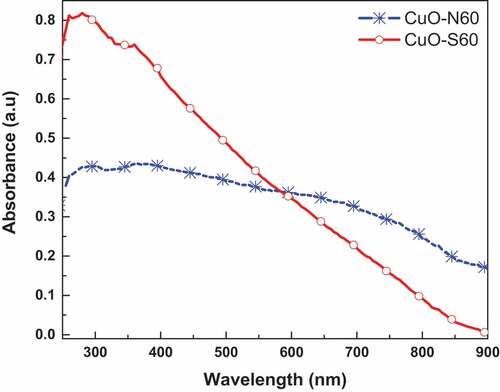
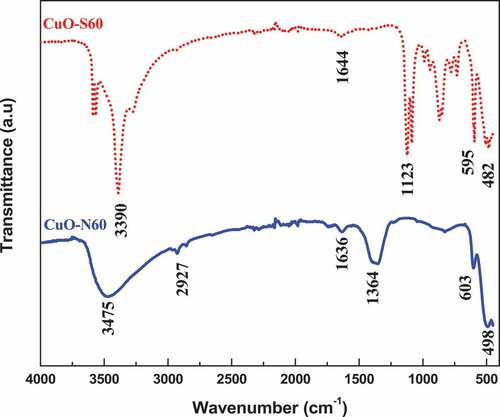
Utilizing the classical tauc approach, the optical energy band gaps were assessed to be 2.12–2.4 eV for CuO-S60 and CuO-N60, respectively. This counselled that the produced nanocrystals were most probable to efficiently take in photons within the visible-light range of the electromagnetic spectrum. Following the quantum size confinement phenomenon discovered in CuO (Himmetoglu et al., Citation2011; Raul et al., Citation2014) whereby the energy band-gap increments with diminishing crystallite size, the observed pattern in the energy band-gaps concurs with the information gotten from the XRD data. The FTIR spectra for the as-prepared CuO nanocrystals is presented in . The bands around 3475, 2927 and 3390 cm−1 relate to O-H stretching vibrations of the crystal water clung to the nanoparticles’ surface. The vibrational modes of the Cu-O bond are observed around 1636 cm−1 and 1644 cm−1 while those found around 482, 498, 595, 603 cm−1 and 1364 cm−1 can be allocated to the CuO finger print vibrational modes (Dollimore et al., Citation1976). These absorption bands thusly affirm the presence of CuO nanoparticles.
Figure 5. FTIR spectra for the synthesized CuO samples
3.4. Brunauer–Emmett–Teller (BET) Specific Surface area and Barrett–Joyner–Halenda (BJH) Porosimetry analysis
The Brunauer–Emmett–Teller (BET) specific surface area and the and Barrett–Joyner–Halenda (BJH) pore architecture of the as-prepared copper oxide samples were examined using the nitrogen adsorption–desorption isotherms (Sing et al., Citation1985).
The nitrogen adsorption–desorption isotherms of the prepared CuO nanocrystals as shown in , are of the distinctive type III and IV configuration with characteristic H2 and H3 hysteresis loops in the range of 0.45–0.8P/P0 and 0.85–1.0P/P0 respectively: an indication of pseudo-mesoporous structures (Archina et al., Citation2016). This pore structure and distributions can help in improving efficient oxidation processes as they result in faster diffusion of various reactants and by-products (Hasieh et al. Citation2003) into and out of the pores. The corresponding pore size distributions of the CuO nanoparticles were determined using the Barrett–Joyner–Halenda (BJH) method from the adsorption branch of the isotherm. The analysis results on the BET surface area, total pore volume and average pore size of the prepared specimens are shown in .
Figure 6. Nitrogen adsorption–desorption isotherms of (a) CuO-S60 and (b) CuO-N60
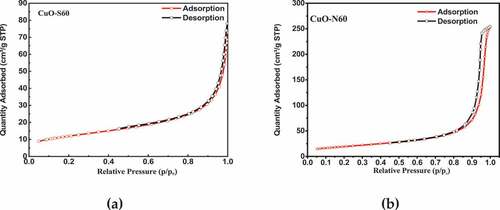
Table 1. Summary of the analytical parameters for the prepared nanostructured CuO crystals
3.5. Photodegradation of Methyl Orange (MeO), Methylene Blue (MB)and Rhodamine B (RhB)
A summary of the degradation efficiency of each of the synthesized CuO species in the respective dyes is shown in while the absorbance (degradation) plots for the individual samples in each dye (MeO, MB and RhB) in the presence of the visible light source are shown in . A general decrease in the absorbance (concentration) of dye is observed with time. Specifically, the N60 resulted in 94.3%, 90.6 %, and 99.6% degradation of MeO, MB and RhB dyes, respectively. Similarly, CuO-S60, led to 85.2%, 87.9 % and 98.8 % degradation MeO, MB and RhB dyes, respectively (). This is presumably due to the continuous production and consumption of reactive oxygen species (ROS) such as singlet oxygen molecules (1O2), superoxide anion radicals (•O2−), and hydroxyl radicals (•OH−) (in the breakdown of the dye). In terms of the rate of degradation, ~ 100 % RhB dye was degraded by both CuO-N60 and CuO-S60 under 75 minutes of visible light irradiation, compared to 91 % and 88 % MB by both CuO-N60 and CuO-S60 under 100 minutes, respectively. While as the slowest degradation rate was observed for MeO. Thus, 94% and 85% were observed by both CuO-N60 and CuO-S60 for MeO dye degradation after 100 minutes of visible light irradiation (). In general, degradation efficiency of the cationic dye such as RhB was relatively higher, compared to the anionic dye such as MeO. This may be due to strong adsorption between the hydroxyl radicals (•OH−) at the CuO-N60 active sites and cationic dyes, as opposed to weak adsorption for anionic MeO (Dodoo-Arhin et al., Citation2018).
Figure 7. Synopsis of mean percentage rate of dye degradations for each CuO specimen in each dye
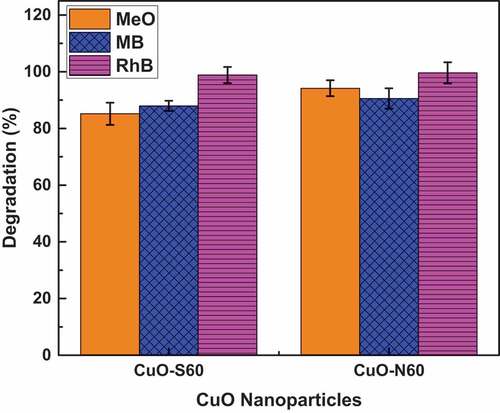
Figure 8. UV-Vis absorbance spectra for the degradation of (a)MeO, (b) MB and (c) RhB dyes using CuO-N60
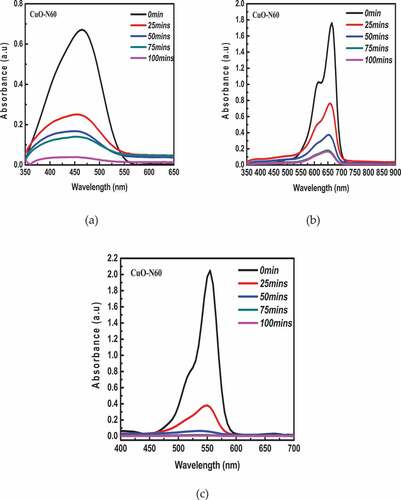
Figure 9. Variation in percentage dye concentration with time for MeO, MB and RhB (Inset: shows colour change for photocatalysis of: (a) MeO, (b) MB, and (c) RhB, respectively)
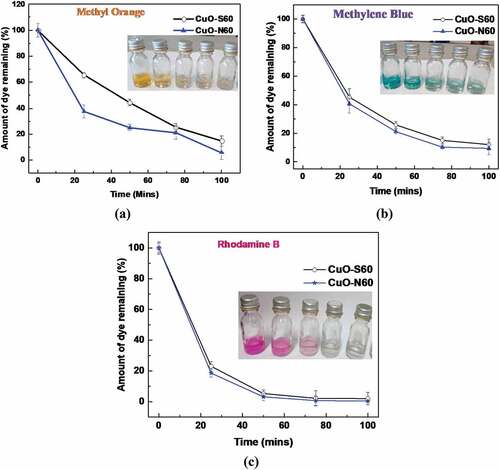
For each case, CuO-N60 demonstrated to unfailingly have a higher degradation efficiency, which may be directly linked to the {111} crystallographic facet, the BET surface area and smallest crystallite size when compared with the CuO-S60 specimen. By and large, all the classes of the dyes reacted positively to the photocatalytic degradation system applied in the presence of visible light and the as-prepared CuO nanocrystals. The Rhodamine B dye showed the utmost percentage degradation rates per CuO specimen by the close of the 100-min exposure time.
An overall reduction in the concentration of dye molecules in solution with the light exposure time can be seen across every one of the three dyes. As noted earlier, exposing the dyes to the photocatalytic system leads to their degradation by the action of ROS and in particular, hydroxyl radicals (•OH−). However, while CuO nanoparticles exhibited excellent degradation, it does not mean complete mineralization of dyes into inorganic CO2 and H2O occurred (Agbe et al., Citation2018). The percentage of the residual dye was determined using EquationEquation 9(9)
(9) taking into account the fact that the change in the amount of dye (concentration) with time is directly proportional to the change in absorbance as appeared in EquationEquation 10
(10)
(10) .
where A0 = Absorbance after 0 minutes of degradation; At = Absorbance after t minof degradation, C0 = Concentration after 0 minutes of degradation and Ct = Concentration after t minof degradation. The percentage of dye degraded was calculated by EquationEquation 11(11)
(11) :
where Cintial is the initial concentration of the dye solution and Cfinal is the concentration at time intervals of the irradiation time.
4. Conclusions
Ultimately, differently sized CuO nanoparticles had been correctly synthesized with the aid of a surfactant-free solvation technique with the usage of two exclusive copper precursor salts. The prepared porous nanoparticles were effectively tested and found to have average crystallite sizes of 12 nm and 15 nm, respectively. The porous nanostructured powder specimens were utilized to breakdown three organic dyes (Rhodamine B (RhB), Methylene Blue (MB)- [Methylthioninium chloride] and Methyl Orange (MeO)) in the under visible light irradiation for 100 minutes at a 25-min interval.
The CuO-N60 porous nanoparticles specimen, with the highest BET surface area performed reliably better in terms of the degradation of all the dyes evaluated substantially more contrasted with the CuO-S60 specimen. The nitrate precursor-based CuO photocatalysts demonstrated generally higher photodegradation effectiveness (MeO 94.3%; MB 90.6%; RhB 99.6%) as compared with the sulphate precursor-based CuO photocatalysts (MeO 85.2%; MB 87.9%; RhB 98.8%). It was accordingly the favoured photocatalyst as far as its predictable proficiency across both dye classes. The outcomes from this exploration propose that the prepared CuO nanoparticles could be reasonably used for dye waste water treatment.
Author contributions
For research articles with several authors, a short paragraph specifying their individual contributions must be provided. DDA: Conceptualization, Methodology, Formal analysis, Writing - Original Draft; EM: Conceptualization, Methodology, Formal analysis, Writing - Original Draft; SKN: resources, data collection, Writing - Review & Editing; EM: resources, Writing - Review & Editing; EFK: resources, Writing - Review & Editing; BAT: Writing - Review & Editing; AY: Writing - Review & Editing; HA: Writing - Review & Editing; EN: Writing - Review & Editing. All authors have read and agreed to the published version of the manuscript.
Acknowledgements
The authors acknowledge the funding support from the University of Ghana BANGA-Africa programme, the African Materials Science and Engineering Network (A Carnegie-IAS SIG-RISE Network), Cape Peninsula University of Technology (CPUT) Research Fund and the North West University (NWU-UID: RK16). The statements made and views expressed in this work are solely the responsibility of the authors.
Disclosure statement
The authors declare no conflict of interest.
Additional information
Funding
Notes on contributors

David Dodoo-Arhin
Prof. David Dodoo‐Arhin is an Associate Professor in the Department of Materials Science and Engineering, University of Ghana. His research interest is in ceramics and nanostructured materials for energy and environmental applications.
Etchu Esther Mbu is an MPhil graduate of the Department of Materials Science and Engineering, University of Ghana. Her research interest is in nanomaterials for water purification.
Prof. Seteno K. Ntwampe, Elvis Fosso-Kankeu and Edward Ntumba Malenga are researchers in the Water Pollution Monitoring and Remediation Initiatives Research Group of the North-West University, South Africa. Their research specializations are in Biological Wastewater Treatment and Green Chemistry Nanotechnologies.
Benjamin Agyei-Tuffour, Emmanuel Nyankson and Abu Yaya are researchers in the Department of Materials Science and Engineering. Their research interests include Composite Materials for Energy, Water Purification, and Environment.
Henry Agbe is a PhD student at the Centre Universitaire de Recherche sur l’Aluminium, Université du Québec à Chicoutimi, Québec, Canada. His research interest includes nanostructured materials for water purification and biomedical applications.
References
- Agbe, H., Raza, N., Dodoo-Arhin, D., Chauhan, A., & Kumar, R. V. (2018). H 2 O 2 rejuvenation-mediated synthesis of stable mixed-morphology Ag 3 PO 4 photocatalysts. Heliyon, 4(4), e00599. https://doi.org/10.1016/j.heliyon.2018.e00599
- Agbe, H., Raza, N., Dodoo-Arhin, D., Kumar, R. V., & Kim, K.-H. (2019). A simple sensing of hazardous photo-induced superoxide anion radicals using a molecular probe in ZnO-Nanoparticles aqueous medium. Environmental Research, 176, 108424. https://doi.org/10.1016/j.envres.2019.03.062
- Archina, B., Aziz, A., Raman, A., Daud, W., & Ashri, W. M. (2016). Recent advances and prospects of catalytic advanced oxidation process in treating textile effluents. Reviews in Chemical Engineering, 32(1), 1–17. https://doi.org/10.1515/revce-2015-0034
- Åsbrink, S., & Norrby, L. J. (1970). A refinement of the crystal structure of copper(II) oxide with a discussion of some exceptional e.s.d.’s. Acta Crystallographica Section B Structural Crystallography and Crystal Chemistry, 26(1), 8–15. https://doi.org/10.1107/S0567740870001838
- Benkhaya, S., M’rabet, S., & El Harfi, A. (2020). Classifications, properties, recent synthesis and applications of azo dyes. Heliyon, 6(1), e03271. https://doi.org/10.1016/j.heliyon.2020.e03271
- Bhattacharjeea, A., & Ahmaruzzaman, M. (2016). CuO nanostructures: Facile synthesis and applications for enhanced photodegradation of organic compounds and reduction of p-nitrophenol from aqueous phase. RSC Advances, 6(47), 41348–41363. https://doi.org/10.1039/C6RA03624D
- Black, D. R., Windover, D., Henins, D. G. A., Filliben, J., & James, P. C. (2010). Standard reference material 640d for X-Ray Metrology. National Institute of Standards and Technology, 25(2), 187-190. Gaithersburg, MD. http://www.icdd.com/resources/axa/vol53/V53_19.pdf
- Byberg, R., Cobb, J., Martin, L. D., Thompson, R. W., Camesano, T. A., Zahraa, O., & Marie-Noëlle, P. (2013). Comparison of photocatalytic degradation of dyes in relation to their structure. Environmental Science and Pollution Research, 20(6), 3570–3581. https://doi.org/10.1007/s11356-013-1551-y
- Caglioti, G., Paoletti, A., & Ricci, F. P. (1958). Choice of collimators for a crystal spectrometer for neutron diffraction. Nuclear Instruments, 3(4), 223. https://doi.org/10.1016/0369-643X(58)90029-X
- Diko, C. S., Qu, Y., Henglin, Z., Li, Z., Nahyoon, N. A., & Fan, S. (2020). Biosynthesis and characterization of lead selenide semiconductor nanoparticles (PbSe NPs) and its antioxidant and photocatalytic activity. Arabian Journal of Chemistry, 13(11), 8411–8423. https://doi.org/10.1016/j.arabjc.2020.06.005
- Dodoo-Arhin, D., Buabeng, F. P., Mwabora, J. M., Amaniampong, P. N., Agbe, H., Nyankson, E., Obada, D. O., & Asiedu, N. Y. (2018). The effect of titanium dioxide synthesis technique and its photocatalytic degradation of organic dye pollutants. Heliyon, 4(7), e00681. https://doi.org/10.1016/j.heliyon.2018.e00681
- Dollimore, D., Spooner, P., & Turner, A. (1976). The bet method of analysis of gas adsorption data and its relevance to the calculation of surface areas. Surface Technology, 4(2), 121–160. https://doi.org/10.1016/0376-4583(76)90024-8
- Elwell, C. E., Gagnon, N. L., Neisen, B. D., Dhar, D., Spaeth, A. D., Yee, G. M., & Tolman, W. B. (2017). Copper–Oxygen Complexes revisited: Structures, spectroscopy, and reactivity. Chemical Reviews, 117(3), 2059–2107. https://doi.org/10.1021/acs.chemrev.6b00636
- Habib, M., Muslim, M., Shahadat, M., Islam, M., Ismail, I. M., Islam, T. S., & Mahmood, A. (2013). Photocatalytic decolorization of crystal violet in aqueous Nano-ZnO suspension under visible light irradiation. Journal of Nanostructure in Chemistry, 3(1), 70. https://doi.org/10.1186/2193-8865-3-70
- Himmetoglu, B., Wentzcovitch, R. M., & Cococcioni, M. (2011). First-principles study of electronic and structural properties of CuO. Physical Review B, 84(11), 115108. https://doi.org/10.1103/PhysRevB.84.115108
- Hsieh, C. T., Chen, J. M., Lin, H. H., Shih, H. C. (2003). Synthesis of well-ordered CuO nanofibers by a self-catalytic growth mechanism. Appl. Phy. Lett. 82, 3316. https://doi.org/10.1063/1.1569043
- Kamimura, H., Ushio, H., Matsuno, S., & Hamada, T. (2005). Theory of copper oxide superconductors. Springer-Verlag Berlin Heidelberg.
- Koehler, J. M., Visaveliya, N., & Knauer, A. (2014). Controlling formation and assembling of nanoparticles by control of electrical charging, polarization, and electrochemical potential. Nanotechnology Reviews, 3(6), 553–568. https://doi.org/10.1515/ntrev-2014-0006
- Leoni, M., Confente, T., & Scardi, P. (2006). PM2K: A flexible program implementing whole powder pattern modelling. Zeitschrift für Kristallographie Supplements, 2006(suppl_23), 249. https://doi.org/10.1524/zksu.2006.suppl_23.249
- Luk, S., Samal, P., & Newkirk, J. (Eds): “Surface area, density, and porosity of powders”, In Powder Metallurgy 7. ASM International, Ohio, (2015). https://doi.org/10.31399/asm.hb.v07.a0006107
- Modec, B., Podjed, N., & Lah, N. (2020). Beyond the simple copper(II) coordination chemistry with quinaldinate and secondary amines. Molecules, 25(7), 1573. https://doi.org/10.3390/molecules25071573
- Omaish, M., Khan, M. M., Ali, S., & Cho, M. H. (2015). Polythiophene nanocomposites for photodegradation applications: Past, present and future. . Journal of Saudi Chemical Society, 19(5), 494–504. https://doi.org/10.1016/j.jscs.2015.06.004
- Rahman, M. M., Choudhury, F. A., Hossain, D., Islam, N., Mohsin, S., Hasan, M. M., Uddin, M. F., & Sarker, N. C. (2014). A comparative study on the photocatalytic degradation of industrial dyes using modified commercial and synthesized TiO2 photocatalysts. . Journal of Chemical Engineering, 27(2), 65–71. http://dx.doi.org/10.3329/jce.v27i2.17805
- Raul, P. K., Senapati, S., Sahoo, A. K., Umlong, I. M., Devi, R. R., Thakur, A. J., & Veer, V. (2014). CuO nanorods: A potential and efficient adsorbent in water purification. RSC Advances, 4(76), 40580–40587. https://doi.org/10.1039/C4RA04619F
- Rezig, W., & Hadjel, M. (2014). Photocatalytic degradation of vat green 03 textile dye, using the ferrihydrite-modified diatomite with TiO2 /UV process. ”. Oriental Journal of Chemistry, 30(3), 993–1007. http://dx.doi.org/10.13005/ojc/300310
- Saggioro, E. M., Oliveira, A. S., Pavesi, T., Maia, C. G., Ferreira, L. F. V., & Moreira, J. C. (2011). Use of titanium dioxide photocatalysis on the remediation of model textile wastewaters containing azo dyes. Molecules, 16(12), 10370–10386. https://doi.org/10.3390/molecules161210370
- Sambandam, A., Xiaogang, W., & Shihe, Y. (2005). Room temperature growth of CuO nanorod arrays on copper and their application as a cathode in dye-sensitized solar cells. Materials Chemistry and Physics, 93(1), 35–40. https://doi.org/10.1016/j.matchemphys.2005.02.002
- Scardi, P., & Leoni, M. (2002). Whole powder pattern modelling. Acta Cryst, A58(190), 1–18. https://doi.org/10.1107/S0108767301021298
- Shaikh, J. S., Pawar, R. C., Moholkar, A. V., Kim, J. H., & Patil, P. S. (2011). CuO–PAA hybrid films: Chemical synthesis and supercapacitor behavior. Applied Surface Science, 257(9), 4389–4397. https://doi.org/10.1016/j.apsusc.2010.12.069
- Sing, K. S. W., Everett, D. H., Haul, R. A. W., Moscou, L., Pierotti, R. A., Rouquerol, J., & Siemieniewska, T. (1985). Reporting physisorption data for gas/solid systems with special reference to the determination of surface area and porosity (Recommendations 1984). Pure and Applied Chemistry, 57(4), 603–619. https://doi.org/10.1351/pac198557040603
- Tran, T. H., & Nguyen, V. T. (2014). Copper oxide nanomaterials prepared by solution methods, some properties, and potential applications: A brief review. International Scholarly Research Notices, 2014(856592), 1–14. https://doi.org/10.1155/2014/856592
- Tunell, G., Posnjak, E., & Ksanda, C. J. (1935). Geometrical and optical properties, and crystal structure of tenorite. Zeitschrift fur Kristallographie, 90(1), 120–142. https://doi.org/10.1524/zkri.1935.90.1.120
- Vashistha, M., Kabra, K., Vyas, V., Kumar, R., Sharma, B. K., & Sharma, G. (2016). Electronic structure of cuo from first-principles and experiment. Quantum Matter, 5(5), 717–720. https://doi.org/10.1166/qm.2016.1370
- Zhang, Q., Zhang, K., Xu, D., Yang, G., & Huang, H. (2014). CuO nanostructures: Synthesis, characterization, growth mechanisms, fundamental properties, and applications. Progress in Material Science, 60(2013), 208–337. https://doi.org/10.1016/j.pmatsci.2013.09.003