
 ?Mathematical formulae have been encoded as MathML and are displayed in this HTML version using MathJax in order to improve their display. Uncheck the box to turn MathJax off. This feature requires Javascript. Click on a formula to zoom.
Abstract
In existing seismic design codes, base shear is measured using the elastic force requirement divided by the strength reduction factor. This factor is used to take account of structures’ ability to dissipate energy by inelastic deformations. The main objective of this study is to determine the response modification factor (R) for RC frames with non-uniform spans and heights and compare the values to the Egyptian Code of Practice ECP-201. The case study consists of three groups of RC frames with detailed structural design: uniform spans and heights, non-uniform spans, and non-uniform heights. A sum of 30 systems of frames is analyzed by nonlinear static analysis, “pushover analysis,” using SAP2000 with FEMA-356 provisions to assess the R factor. Also, a comparison is held with R factor in the Egyptian code. It was found, considering the limitations mentioned in the conclusions, that R factor decreases with increasing the height of selected floors and it is greatly affected by the non-uniformity of span lengths. The listed values of R factor in the Egyptian code are conservative and not economic. Thus, it is recommended to include the non-uniformity in spans and heights, to get more accurate values of R factor.
PUBLIC INTEREST STATEMENT
Although the earthquake-resistant design has recently gained more importance in Egypt, there are not enough studies that explain the behavior of various structural elements under seismic effect. Most of the previous studies were considering buildings with uniform spans and heights. That is not the case for commercial and administrative buildings. Generally, the floor lengths are different in the first and last few stories. Also, variations in span lengths often occurred. In this research, the response modification factor, which is the main component of the seismic analysis, was evaluated for RC frames with non-uniformity in span lengths and floor heights. The calculated values were compared to the conservative values of the Egyptian code. The results show a decrease in R values which affects the cost of the design. Therefore, taking into consideration the non-uniformity of dimensions in different codes and standards will help to have more accurate designs in the future.
1. Introduction
Factor R represents an empirical response decrease factor that takes account of damping, excess energy, and the structural system ductility at displacements that are sufficient to exceed the initial performance and approach the ultimate load displacement of the structural system. The idea of the response modification factor was developed based on the assumption that complex seismic framing systems would support large inelastic deformations without collapse and would produce side forces beyond their design capacity. The Equivalent Lateral Force Method and Response Spectrum Method is the main static analysis methods, and both techniques use R factor to measure the base shear of the system. A significant assumption of the two methods is that the inelastic response quantity is calculated by adding a factor using elastic analysis tools. This factor called the response modification factor is used to reduce the actual lateral load that can be resisted by the structures to control their permanent deformations. This is done using a pushover curve as shown in .
Figure 1. Bilinear idealization of capacity curve and calculation of R factor (Freeman, Citation1990)
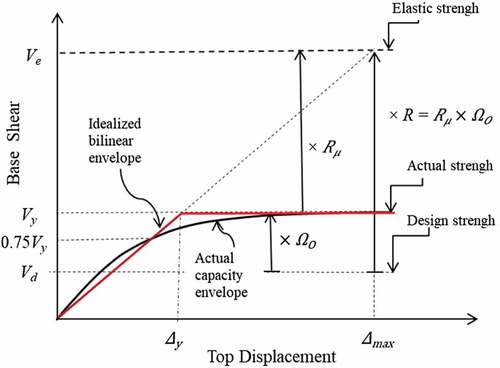
The overstrength ratio, Ω0, represents the ratio of apparent strength to design strength of the frame structure as given by EquationEq. (1(1)
(1) )
An idealized model is constructed with a straight line passing the origin and a point corresponding to the strength of 0.75Vy on the capacity curve (Freeman, Citation1990). The elastic strength of the frame structure (i.e., the base shear corresponding to the elastic response of the structure), Ve, is obtained at the point where the elastic line intersects Δ max (). In this research study, the maximum lateral displacement Δa is assumed to be consistent with the maximum permissible values with a life safety performance objective for an ordinary frame structure according to Standard 2800–91(Iranian Code of Practice for Seismic Resistant Design of Buildings, Standard No. 2800, Citation2014). These permissible values in terms of the building height, H, are as follows in EquationEqs. (2(2)
(2) –Equation3
(3)
(3) ). From EquationEq. (4
(4)
(4) ), Rµ is the displacement ductility ratio of the elastic strength to the apparent strength.
The response modification factor, R, represents the ratio of elastic strength, Ve, to the design strength, Vd, of structure. From EquationEqs. (1(1)
(1) ,Equation4
(4)
(4) ), R can be evaluated in EquationEq. (5
(5)
(5) )
Egyptian Code ECP201-(ECP-201, Citation2012) (ECP-201, Citation2012) uses a list of values for response modification factor “R factor” for RC frames according to the lateral resisting system of the structure as listed in .
Table 1. R factor according to lateral load resisting system in (ECP-201, Citation2012)
The Static Lateral Force Method accounts for nonlinear response in a seismic framing system by the use of a response modification factor. This factor, first introduced in ATC-3-06 (Hart et al., Citation1995), serves to reduce the base shear force (Ve) calculated by elastic analysis using a 5% damped acceleration response spectrum (Sa,5) to calculate a design base shear (Vb) in EquationEq. (6(6)
(6) )
Increasing the Response modification factor leads to decreasing the proposed base shear by the value of R factor consequently, the economic design of the structure can be obtained due to the precise value of R factor. The R factor is “an empirical response modification (reduction) factor intended to account for both damping and ductility inherent in a structural system at displacements great enough to approach the maximum displacement of the system”.
Over 4,600 nonlinear analyses using seismic data were performed in (Fanaie & Shamlou, Citation2015). They studied the effect of mixed structures with uniform dimensions and different numbers of concrete and steel floors, to determine the response factor. They found that the values of the response modification factor for mixed structures are lower than for full steel or concrete structures of the same height. In Louzai and Abed (Citation2015), the seismic behavior factor R for RC frame structures was estimated, founded on “comparative analysis between non-linear static pushover and non-linear incremental dynamic analysis”. RC frame structures with uniform dimensions and different heights were designed according to the Algerian seismic code. The results showed that the response modification factor depends, among other variables, on the height of structures, which is not considered in the seismic design codes. The behavior of six bays of a multi-story RC frame was investigated in (Elyamani, Citation2016). The effect of confinement is considered when modeling nonlinear RC sections: reinforcement of stirrups with 8 mm diameter is used in all beams and columns. The study focused on uniform spans and heights.
Next, researchers studied the effect of bracing systems on the response modification factor (R) for only uniform dimensions structures. A new bracing configuration of concentrically braced frames (CBFs) was presented in (Kheyroddin & Mashhadiali, Citation2018). This innovative bracing system is composed of a hexagonal pattern of braces. The analysis results confirmed the given value of R factor 6 for the X-braced frame system in design codes (ASCE 7) (Uang, Citation1991). Also, Abou-Elfath et al. (Citation2018) presented the R factors of low-to-mid-rise buckling restrained braced frames (BRBFs) designed according to the Egyptian code. In addition, (Sharifi & Toopchi-Nezhad, Citation2018) calculated the R factor of RC-frames that their earthquake design loads were evaluated by Standard 2800–91 (Iranian Code of Practice for Seismic Resistant Design of Buildings, Standard No. 2800, Citation2014), and their structural design is performed on the basis of the provisions of National Building Code of Iran (National Building Code of Iran (2013) Article 9: Design and Construction of Reinforced Concrete Buildings, 4th Edn., Citation2013). The R factors cited in Standard 2800–91 (Iranian Code of Practice for Seismic Resistant Design of Buildings, Standard No. 2800, Citation2014) are based on a USD-philosophy which is not quite similar to the limit state design (LSD) philosophy. Performances of incremental dynamic analysis (IDA) in BRBFs were studied through numerical analysis with different response modification factors (Güner & Topkaya, Citation2020). The results show that designs with higher R factors result in higher repair costs.
Previous studies have considered only uniform spans and heights in each structure. The main goal of this research is to fill that gap and study the effect of non-uniformity of span lengths and floor heights on the response modification factor R for ordinary RC frames, used in different types of buildings. The results were compared to the uniform bay length and floor height values. R factor was calculated uniquely for each frame and all values were compared to the Egyptian code ECP 201 (ECP-201, Citation2012). Plastic hinges were recognized and drawn for each frame to identify the failure modes. The outcome of this research has a good contribution to the accuracy of the calculation of the R factor in codes and standards.
2. Methodology
This section includes modeling of ordinary RC frames, materials and loads used in this study, design of frames, pushover analysis methodology, and the verification of the results. The pushover analysis of a structure is a static non-linear analysis under constant gravity loads and gradually rising lateral loads that represent approximately earthquake-induced forces. The top displacement versus base shear is plotted to get a pushover curve that would specify any early weakness. The analysis is conducted up to failure; thus, it allows determining the values of collapse load and ductility. The progress of plastic hinges is defined.
2.1. Pushover analysis
In a structural system, plastic rotation is controlled and the lateral inelastic forces versus the displacement response are calculated for the whole structure. Such an approach makes it possible to recognize structural weakness. The procedure followed for the pushover analysis consists of the following steps:
Building of the structural model. The frames considered in this study are designed following the provisions of Egyptian code ECP-203 (ECP 203-2007 Egyptian Code for Design and Construction of Reinforced Concrete Structures, Citation2007). The gravity and lateral loads were calculated according to ECP-201 (Citation2012) (ECP-201, Citation2012). The frame design is based on an empirical code formula and uses SAP 2000 (CSI Analysis Reference Manual: For SAP2000, ETABS, SAFE and CSiBridge™, Citation2012) modal analysis to obtain the fundamental vibration duration. . Seismic loads were computed as static loads according to ECP-201 (Citation2012) (ECP-201, Citation2012) assuming seismic zone 1 and the local site classification is assumed to be Z3. The effect of confinement is considered when modeling nonlinear RC sections: reinforcement of stirrups with 8 mm diameter is used in all beams and columns.
Assignment of material properties: for the concrete and high-grade steel used in the frames, the concrete unit weight (☐) = 2.48 t/m3, Fcu = 3000 t/m2, the concrete Poison ratio (☐) = 0.21, Steel modulus of elasticity (Es) = 200,00000 t/m2, Yield strength of high-grade steel (Fy) = 36,000 t/m2, Ultimate strength of high-grade steel (Fu) = 42,000 t/m2 and the steel Poison ratio (☐) = 0.33. For nonlinear analysis, the stress–strain curve for concrete according to ECP-203 (Citation2007) (ECP 203-2007 Egyptian Code for Design and Construction of Reinforced Concrete Structures, Citation2007) in compression consists of two segments: the first segment is a parabolic curve up to a strain value of 0.002. and the second segment is a horizontal line up to a strain value of 0.003. ECP-203 (Citation2007)(ECP 203–2007 Egyptian Code for Design and Construction of Reinforced Concrete Structures, 2007) presents an idealized elasto-plastic relationship to define the behavior of the reinforcement steel. Unlike concrete, the segments of the stress–strain curve for reinforcement steel are linear.
Application of loads: the following loads are applied to all studied frames which are considered as residential buildings. The gravity loads are the dead loads which include structural elements own weight, walls with plaster and floors finishing materials, and live loads: Dead load = 0.8 t/m2 and Live load = 0.2 t/m2.
Equivalent lateral load: the analysis of equivalent lateral load was according to ECP-201 (ECP-201, Citation2012). The base shear is determined with EquationEq. (7)
(7)
Where: T1 is the vibration fundamental period which can be calculated by EquationEq. (8)(8)
(8) or using computational model but not greater than 1.20.
Where, Ct is a factor depending on the construction material and the statistical system. For RC frames, this factor equals 0.075. H is the structure’s total height overhead the level of the foundation. γ is a correction factor equals 1. W refers to the load combinations of overall seismic weight over the base level of the structure and the total dead load plus the share of the live load according to the use of the building (EquationEqs. 9(9)
(9) –Equation10
(10)
(10) ). Structures in this analysis are considered to be residential buildings, where only 25% of the live load is included in the seismic weight measurement. Sd(T1) is the design elastic response spectrum (type 1) according to ECP-201 (Citation2012) (ECP-201, Citation2012). In the current study, all the frames in Cairo (seismic zone 3) with an ag (the design ground acceleration) value 0.15 g, the importance factor γ1 for residential buildings equal 1, R is the response modification factor. In this analysis, the factor is 5 and corresponds to frame systems with restricted ductile strength-resistant reinforced concrete moment (). The correction factor for the damping η equals 1.00 for RC structures with viscous damping 5%. The factor of soil S is selected for Type C soils, with a shear wave velocity of between 180 and 360 m/sec for response spectrum types 1.
Load combinations: the analysis was performed using several load combinations and the largest straining actions were used for the design of frames (EquationEqs. 9
Where α is a factor depending on the type of building and is 0.25 for residential building. D.L., L.L., and S.L. are dead, live, and seismic loads, respectively. Egyptian code ECP-201 (Citation2012) (ECP-201, Citation2012) recommends that beams and columns should be used as stiffness modifiers to consider the following cracks: the stiffness modifier for columns is 0.70, and the stiffness modifier for beams is 0.50.
Formation of plastic hinges and drawing the pushover curve: the location of plastic hinges along beams and columns are assigned using (FEMA 356 (American Society of Civil Engineers, Citation2000)). Target force or displacement control are preserved as shown in EquationEqs. (4
2.2. Verification of results
To validate the calculated values of the response modification factor, the pushover analysis results were checked with CitationLouzai and Abed (2015) and CitationElyamani (2016). In Louzai and Abed (Citation2015), the seismic behavior factor R of RC frame structures is evaluated based on a comparative analysis between two non-linear inelastic methods: static pushover and incremental dynamic analyses. Thus, three-, six-, and nine-story RC frame structures, considered as low-, medium-, and high-rise frame, respectively, were designed according to the Algerian seismic code. The IDA using a set of time-history earthquake records was also conducted to obtain the seismic behavior factor (Kita et al., Citation2020). The values of R factor obtained using the two methods were also compared to the value of R factor adopted by the Algerian code. Comparisons of the values of the R (response modification factor) based on the inelastic pushover analysis and the inelastic IDA showed a difference from 5% to 18%, but the trend observed is different. The value of the R decreases with the increase of height, whereas for the inelastic IDA, the value of R increases with the increase of height. This result shows that the value of R is greatly affected, by the height of the structure. The seismic behavior factor values in (Elyamani, Citation2016) were validated with (Louzai & Abed, Citation2015) and very close agreement values were obtained. In the current study, the pushover analysis results were checked with those of Elyamani (Citation2016) who investigated the behavior of six bays of a multi-story RC frame. A compared case study is presented in . Non-linear static pushover analysis using inverted triangular loading pattern was carried out to compute the R factor components, such as ductility and overstrength factors, with the consideration of failure criteria at both member and structural levels. A two-dimensional model of the frame structure is created in SAP2000 (CSI Analysis Reference Manual: For SAP2000, ETABS, SAFE and CSiBridge™, Citation2012) to carry out pushover analysis. Beam and column elements are modeled as nonlinear frame elements with lumped plasticity by defining plastic hinges at both ends of the beams and columns, where bilinear moment–rotation relationships are assigned. The effect of confinement is considered when modeling nonlinear RC sections: reinforcement of stirrups with 8 mm diameter is used in all beams and columns. Finally, the response modification factor is calculated using EquationEq. (5)(5)
(5) . Reinforcement and dimensions of beams and columns are presented in . The results obtained in the current research are very close to those of Elyamani (Citation2016) as illustrated in .
Figure 2. The elevation layout of frame in the study by Elyamani (Citation2016)
Table 2. Reinforcement of beams and columns in the study by Elyamani (Citation2016)
Table 3. Comparison between the current results and those of Elyamani (Citation2016)
3. Description of the case study
A parametric study was conducted for ordinary RC 2D frames with three bays of 5 m length each and floor heights of 3 m for the different number of stories (Gamal, Citation2020).
3.1. Group 1
Models 1 to 4 have uniform spans (5 m) and uniform heights (3 m) with numbers of stories of 4, 6, 8, and 10, respectively. As a sample, and show the layout, the concrete dimensions, and the reinforcements of the model 1. The analysis has been done using SAP2000 v20 (CSI Analysis Reference Manual: For SAP2000, ETABS, SAFE and CSiBridge™, Citation2012).
Figure 3. Elevation of four stories frames (model 1)
Table 4. Reinforcement of beams and columns for model 1
3.2. Group 2
In this group, the effect of non-uniform spans on the R factor is studied by increasing the lengths of selected spans from 5 m to 7 m and keeping the heights uniform. illustrates the layout of the model 5.
Figure 4. Elevation of four stories frame (model 5)
For each number of stories, different lengths were used for the three bays (5 m,5 m,7 m), (7 m,5 m,7 m), and (5 m,7 m,5 m) as shown in .
Table 5. Different models with non-uniform span lengths in group 2
3.3. Group 3
In this group, the effect of non-uniform heights on the R factor is investigated by increasing the heights of selected floors from 3 m to 5 m, keeping the spans uniform. shows the layout of the three bays frame with four stories with non-uniform heights in the model 17.
Figure 5. Elevation of four stories (model 17)
For each number of stories, some floors were selected with non-uniform heights (5 m).
All the other floors are 3 m in height and all spans are 5 m in length. Details for each model in group 3 are shown in .
Table 6. Floors with non-uniform heights (5 m) in group 3
4. Results and discussion
For each group, a sample of figures of plastic hinge formation to determine the failure mode at collapse, pushover curves along with R values tables is presented.
4.1. Group 1
shows the formation of the plastic hinges in model 1 of RC frames at failure utilizing triangular load pattern according to (American Society of Civil Engineers, Citation2000) provisions where the colors and letters in the legend indicate:
Figure 6. Plastic hinges for model 1
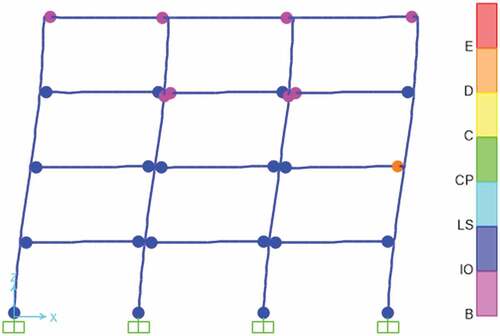
Point B represents the yield and point C represents the ultimate capacity of the hinge. While point D represents the residual strength of the hinge and point E represents the total failure of the hinge. Point IO on the above curve refers to immediate occupancy, point LS refers to life safety, and point CP refers to collapse prevention.
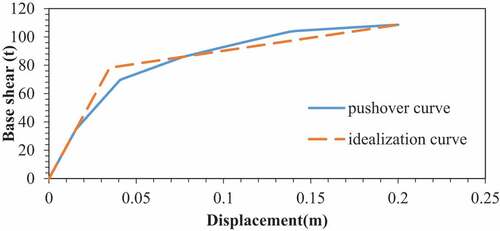
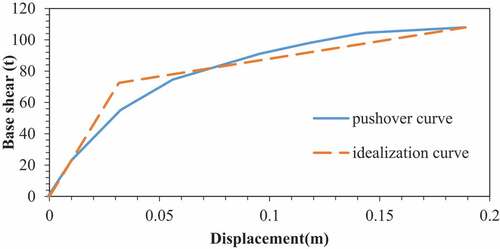
The pushover curve results and the idealization pushover curve for triangular load pattern utilizing Sap2000 for model 1 are illustrated in . From the figure, the values of ductility and idealized yield strength needed to calculate the R factor are obtained as presented inside .
Figure 7. Pushover curve and idealization curve for model 1
displays R values for frames of 4, 6, 8, and 10 stories with equal spans of 5 m and equal heights of 3 m. The fundamental period of vibration T is calculated according to SAP2000 software. For each model, the details of the values used to calculate R were demonstrated:
Table 7. R values for frames in group 1
Where
: Demand ductility ratio
: The idealized yield strength (EquationEq. (1
(1)
(1) ))
: The ductility reduction factor (EquationEq. (4
(4)
(4) ))
: Overstrength factor (EquationEq. (1
(1)
(1) ))
R: Reduction factor (EquationEq. (5(5)
(5) ))
shows the comparison of values of R for different numbers of stories in group 1 compared to ECP value.
Figure 8. Different values of R for group 1 compared to the value of ECP
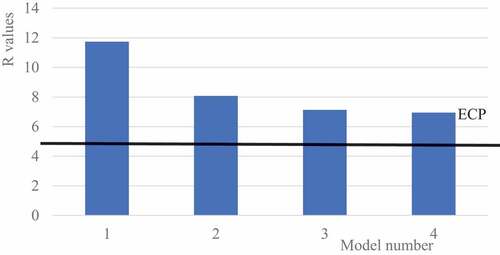
Several conclusions can be drawn from the results of group 1. For uniform spans and heights, the decrease of the R values from four stories to 10 stories is 40%. ECP values are very conservative: R factors for four stories are higher than that of the ECP by 134% for four stories, 61% for six stories, 42% for eight stories, and 38% for 10 stories.
4.2. Group 2
The formation of the plastic hinges for model 5 is defined in . The total failure begins in one beam on the second floor of this four-story frame, similar to model 1 in . Also, the pushover curve results and the idealization pushover curve used to calculate the R factor for model 5 are illustrated in .
Figure 9. Plastic hinges formation in model 5

Figure 10. Pushover curve and idealization curve for model 5
displays R values for different models of group 2. Besides, compares the value of R for every pattern of non-uniform spans. The analysis of the results of group 2 is defined next.
Figure 11. R values for different number of stories with non-uniform span lengths
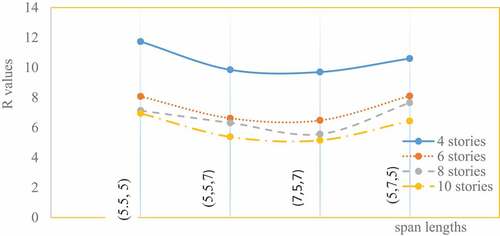
Table 8. R values for frames in group 2
An increase in bay lengths of one or two spans by 40% decreased the value of R factor from 17% for four stories to 25% in 10 stories compared to uniform spans.
The decrease of the R factor for uniform spans and heights from 4 to 10 stories in 40%. If only the middle span is non-uniform, the decrease of the R factor from 4 to 10 stories is almost the same as uniform spans. However, if one or both of the outer spans are non-uniform, the decrease reaches 45% and 47% respectively.
4.3. Group 3
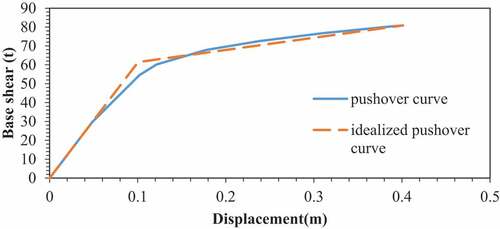
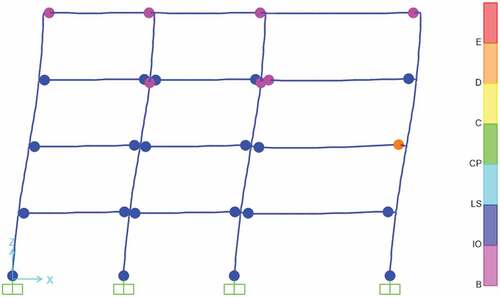
displays the formation of plastic hinges for model 17. The total failure begins in all the beams of the first floor of this four-story frame. Generally, the irregularity in plastic hinges increases with non-uniform dimensions in different structures, and some plastic hinges were formed in columns rather than beams. The pushover curve results and the idealization pushover curve used to define the R factor for model 17 are illustrated in .
Figure 12. Plastic hinge formation for model 17
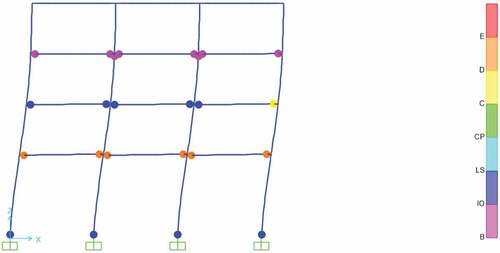
Figure 13. Pushover curve and idealization curve for model 17
compares the value of R for every pattern of non-uniform height for different numbers of stories. Moreover, displays R values for three bays frames for group 3. A discussion of the results of group 3 is elaborated as follows.
Figure 14. R values for different number of stories with non-uniform floor heights
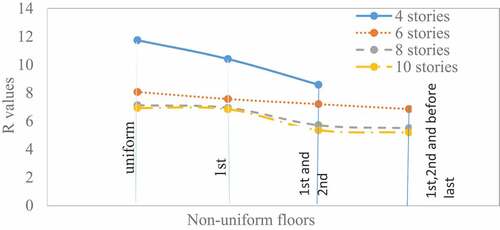
The decrease in R values due to non-uniformity in floor heights in studied cases varies from 11% for 4 stories to 40% for 10 stories compared to uniform heights.
For uniform heights, R values decreased by 40% from 4 stories to 10 stories. However, if only the heights of the first floor or the first two floors are increased by 66%, R values decrease from 4 stories to 10 stories by 34% and 37% respectively.
Table 9. R values for frames in group 3
5. Conclusions and recommendations
In the literature, there has been a lack of studies concerning the effect of non-uniform dimensions on the R factor. In this research, the response modification factor R components, such as the ductility and the overstrength factors were evaluated, for ordinary RC frames with non-uniform span lengths and non-uniform floor heights. This was achieved using a non-linear static pushover analysis, and inverted triangular loading pattern. The results were validated with a comparative analysis between non-linear static pushover and non-linear incremental dynamic analyses. The values of the R factor were compared to the uniform bay length and floor height values as well as to the Egyptian code ECP. The effect of non-uniformity of dimensions in the distribution of plastic hinges through the structure was analyzed. The following conclusions were drawn based on the findings of this research and the set of parameters examined:
Increasing the number of floors overall leads to a decreasing R factor.
When the non-uniformity in floor heights increases, the value of the R factor decreases up to 11% for 4 stories till 40% for 10 stories for studied cases.
The increase in non-uniformity of span lengths affects the value of R factor with a 17% decrease in 4 stories till a 25% decrease in 10 stories for studied cases.
For the same number of stories, the least value of R is achieved when both outer spans have non-uniform length followed by only one outer span than when the middle span length is different. The highest value of R occurred for uniform span length.
The listed values of the R factor in the ECP are conservative and not economic. The response modification factor of four stories is greater than the value of ECP up to 134% for 4 floors, 61% for 6 floors, 42% for 8 floors, and 38% for 10 floors.
According to plastic hinge formation, increasing the number of stories from four to six leads to not creating plastic hinges on the last floor, increasing the number of stories from 6 to 8 leads to not creating plastic hinges on the last two floors. Also, increasing the number of stories from 8 to 10 leads to not creating plastic hinges in the last three floors. These plastic hinges are formed mainly in beams.
By increasing the spans widths and floor heights. The structure showed a faster collapse mechanism and irregular distribution of plastic hinges in frames as some of them occur in columns instead of beams.
It is recommended that the non-uniformity in spans and heights will be taken into consideration in the value of R in ECP and other standards.
For important structures, it is recommended to calculate the R factor for every frame because, for a high degree of non-uniformity, it could be less than ECP.
From the above findings, we can conclude that the amount of decrease in the R factor due to non-uniformity in dimensions decreased the cost of design. Thus, the research added an economic impact to the seismic design of structures as well as an approach to improve the seismic codes.
This study is limited to regular building models. The focus is only on the effect of the non-uniformity in dimensions on the seismic behavior factor of ordinary RC frame structures. Substantial research works are required with the main objective to estimate the seismic behavior factor in an exhaustive parametric study considering a larger set of geometrical parameters, different types of structures and materials, irregularity of structures in plans, and elevation. The results presented in this research only express the trend. Naturally, different building arrangements could change the actual value.
Declaration of conflict of interests
The authors have declared no conflict of interest.
Cover Image
Source: Author
Additional information
Funding
Notes on contributors
Manar M. Hussein
Dr. Manar M. Hussein has been working as an associate professor in the Department of Structural Engineering, Faculty of Engineering, Cairo University. Her research interest includes piezoelectric material, soil–structure Interaction, fuzzy logic, tall buildings, and codes and standards.
Eng. Manar Gamal is a Master of Science student in the Department of Structural Engineering, Faculty of Engineering, Cairo University. Her research interest is the analysis and design of structures under seismic effect.
Professor Walid A. Attia is a professor of structural analysis and mechanics in the Department of Structural Engineering, Faculty of Engineering, Cairo University, Egypt. He has a very long experience in the analysis and design of different kinds of structures. He is also an expert in seismic design, bridges, and tall buildings.
References
- Abou-Elfath, H., Shamel Fahmy, A., & Mohamed Khalifa, K. (2018). Response modification factors of buckling-restrained braced frames designed according to the Egyptian code. Alexandria Engineering Journal, 57(4), 2851–20. https://doi.org/10.1016/j.aej.2018.07.001
- American Society of Civil Engineers. (2000). Federal emergency management agency FEMA 356/November 2000 prestandard and commentary for the seismic rehabilitation of buildings.
- CSI analysis reference manual: for SAP2000, ETABS, SAFE and CSiBridge™. (2012). https://www.scribd.com/document/369892088/CSI-Analysis–Reference-Manual–2011–12
- ECP 203–2007 Egyptian code for design and construction of reinforced concrete structures. (2007).
- ECP-201. (2012). Egyptian code of practice for calculation of loads and forces in structures and buildings.
- Elyamani, A. (2016). Evaluation pr seismic response modification factor of reinforced concrete frames in the Egyptian code based on nonlinear static analysis. Cairo University.
- Fanaie, N., & Shamlou, S. O. (2015). Response modification factor of mixed structures. Steel and Composite Structures, 19(6), 1449–1466. https://doi.org/10.12989/scs.2015.19.6.1449
- Freeman, S. A. (1990). On the correlation of code forces to earthquake demands. In Proc. 4 Th U.S.-Japan Workshop on Improvement of Building Structural Design and Construction Practices, ATC-15-3 Report. Redwood City, California.
- Gamal, M. (2020). The effect of non-uniformity of dimensions on the evaluation of seismic response modification factor for reinforced concrete frames. Cairo University.
- Güner, T., & Topkaya, C. (2020). Performance comparison of BRBFs designed using different response modification factors. Engineering Structures, 225, 111281. https://doi.org/10.1016/j.engstruct.2020.111281
- Hart, G. C., Hwang, H. H. M., Krawinkler, H., Kustu, O., Mayes, R. L., Merovich, A. T., Nicoletti, J. P., Nordenson, G. J. P., Shinozuka, M., Theiss, J. C., & Wen, Y.-K. (1995). ATC-34 A critical review of current approaches to earthquake-resistant design.
- Iranian code of practice for the seismic-resistant design of buildings, standard no. 2800. (2014). Road, Housing and Urban Development Research Center.
- Kheyroddin, A., & Mashhadiali, N. (2018). Response modification factor of concentrically braced frames with a hexagonal pattern of braces. Journal of Constructional Steel Research, 148, 658–668. https://doi.org/10.1016/j.jcsr.2018.06.024
- Kita, A., Cavalagli, N., Masciotta, M. G., Lourenço, P. B., & Ubertini, F. (2020). Rapid post-earthquake damage localization and quantification in masonry structures through multidimensional non-linear seismic IDA. Engineering Structures, 219, 110841. https://doi.org/10.1016/j.engstruct.2020.110841
- Louzai, A., & Abed, A. (2015). Evaluation of the seismic behavior factor of reinforced concrete frame structures based on comparative analysis between non-linear static pushover and incremental dynamic analyses. Bulletin of Earthquake Engineering, 13(6), 1773–1793. https://doi.org/10.1007/s10518-014-9689-7
- National building code of Iran (2013) Article 9: Design and construction of reinforced concrete buildings (4th ed.). (2013). Ministry of Housing and Urban Development.
- Sharifi, S., & Toopchi-Nezhad, H. (2018). Seismic response modification factor of RC-frame structures based on limit state design. International Journal of Civil Engineering, 16(9), 1185–1200. https://doi.org/10.1007/s40999-017-0276-6
- Uang, C. (1991). Establishing R (or Rw) and Cd factors for building seismic provisions. Journal of Structural Engineering, 117(1), 19–28. https://doi.org/10.1061/(ASCE)0733-9445(1991)117:1(19)