
 ?Mathematical formulae have been encoded as MathML and are displayed in this HTML version using MathJax in order to improve their display. Uncheck the box to turn MathJax off. This feature requires Javascript. Click on a formula to zoom.
Abstract
Floods are hazard which poses immense threat to life and property. Identifying flood-prone areas, will enhance flood mitigation and proper land use planning of affected areas. However, lack of resources, the sizable extent of rural settlements, and the evolving complexities of contemporary flood models have hindered flood hazard mapping of the rural areas in Ghana. This study used supervised Random Forest (RF) classification, Landsat 8 OLI, and Landsat 7 ETM + images to produce flood prone, Land Use Land Cover (LULC), and flood hazard maps of the Nasia Watershed in Ghana. The results indicated that about 418.82 km2 area of the watershed is flooded every 2–3 years (normal flooding) and about 689.61 km2 is flooded every 7–10 years (extreme flooding). The LULC classification produced an overall accuracy of 92.31% and kappa of 0.9. The flood hazard map indicated that land areas within hazard zones of the river include the Nasia community, Flood Recession Agricultural (FRA), rainfed and woodlands. When compared with a Modified Normalized Difference Water Index (MNDWI), the RF supervised classification had an edge over the MNDWI in estimating the flooded areas. The results from this study can be used by local administrators, national flood disaster management and researchers for flood mitigation and land use planning within the watershed.
Public interest statement
One of the major consequences of climate change and climate extremes in Ghana is increased frequency of extreme flood events. However, an important resource for effectively managing floods is a flood risk map, which serves as an information system for enhancing the understanding and awareness of risk. This study used random forest algorithm and Landsat images to produce flood hazard maps of the Nasia watershed in Ghana. The flood hazard map indicated that land areas within hazard zones of the river include the Nasia community, Flood Recession Agricultural (FRA), rainfed and woodlands. The results from this study will be used by local administrative authorities and the national disaster management organization for flood control and mitigation. It can also be used by policy makers for land use planning within the rural communities.
1. Introduction
Over the past decades, flooding has caused severe destruction to humans, their health and properties, infrastructures, ecological systems, and economic activities over the globe (Ghoneim & Foody, Citation2013; Messner & Meyer, Citation2006; Nicholls et al., Citation2015). It is estimated that floods have caused about 7 million deaths and more than USD 600 billion losses between 1900 and 2013 (CRED). Despite the damages already caused, the frequency and intensity of flooding events are still expected to increase in the coming years due to climate change, rising sea levels, and increase rainfall extremes (IPCC, Citation2007; Jonathan et al., Citation2013; Ramin & McMichael, Citation2009; Stijn et al., Citation2013).
In the northern and north east regions of Ghana, flooding is mostly caused by excessive rainfall which often leads to dam breaks or rivers overflowing its natural banks and engulfing the dry lands in the area (Yiran and Stringer, Citation2016). This is coupled with the non-existence of drainage systems, improper disposal of refuse on waterways and building in waterways to cause extensive economic and other capital losses to the inhabitants of the area (Armah et al., Citation2010). Additionally, flooding destroys farmlands, which is the main source of livelihood for most families, creating a threat to food security (Armah et al., Citation2010). While it is imperative that early flood warning systems are developed to safeguard lives and properties, lack of data in most rural areas have impeded local authorities, national agencies, and researchers in their flood hazard assessment efforts.
In response to the lack of data, many applications have used remote sensing methods to provide both primary and supplementary data for mapping (Goldberg et al., Citation2013). Landsat images for example, have been used for flood mapping since the launch of the first satellite in the early 1970s (Schumann et al., Citation2018). While there has been a proliferation of satellite sensors since then, Landsat images remains one of the most used satellite data for flood hazard assessment due to the continuous free availability of the data, the moderate resolution of the images (mostly 30 m), the ease with which data from different sensors can be integrated for over time analysis, and most importantly, the availability of different spectral bands that allows measuring spectra across from different earth features (Roy et al., Citation2014; Wulder et al., Citation2019). This permit deriving the different components of a flood hazard map such as the exposure, inundation extent and LULC from the same sensor over rural areas where hydrodynamics information of rivers systems is usually scare and conventional method of gathering such information will not be cost effective.
In addition to satellite data, the selection of an appropriate flood mapping method is equally useful for successful application of remote sensing method for flood hazard mapping. To this, water indices such as Normalized Difference Water Index (NDWI) and Modified Normalized Difference Water Index (MNDWI) have been traditionally used to delineate flood extent from images due to their ease of use and the accuracy they provide (Cian et al., Citation2018; Memon et al., Citation2015). However, the emergence of Machine Learning (ML) algorithms and the evolution of computer system with high processing power has enhanced the usage of ML supervised classification methods for flood mapping. Among the commonly used ML algorithms is Random Forest (RF). Random Forest (RF) is an ensemble ML algorithm that works based on statistical learning theory (Breiman, Citation2001) and has been efficient and effective in many flood hazard mapping applications. However, despite the advantages mentioned above, very few applications have combined Landsat images and RF to derive flood hazard information within the West African sub region.
In this study, we bridged the flood data gap in the Northern and North-East regions of Ghana by combining Landsat images and RF model to produce flood hazard maps. We focused our study on the transboundary Nasia Watershed. We acquired wet Landsat 7 and Landsat 8 images and applied supervised RF classification to extract the normal and extreme flood prone extent of the watershed. We also acquired dry season Landsat 8 image to produce a LULC map of the watershed. The flood prone maps were superimposed on the LULC map to produce a flood hazard map of the watershed. The result was a spatial information providing insight about the flooding characteristics of the Nasia River and the land areas prone to flooding.
2. Materials and methods
2.1. Study area
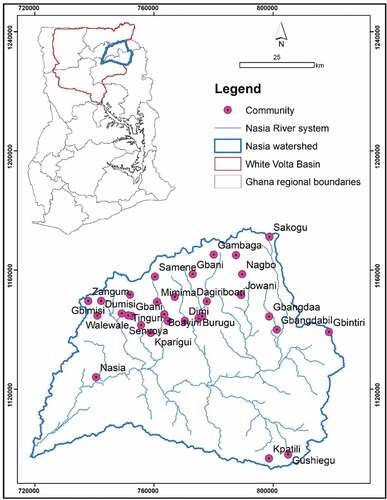
The Nasia River is one of the main tributaries of the White Volta Basin in Ghana (). This river system creates a catchment area of about 5348 km2 within the West Mamprusi, East Mamprusi, Saveligu, Nanton, Salaga, and Gushiegu administrative districts of the newly created Northern and North East Regions of Ghana (GOG Offical Portal (Government of Ghana), Citation2019). There are several communities within the watershed, with the Nasia community being the most prominent. According to the 2010 Ghana population census, the watershed is inhabited by about 359,888 people (Addai et al., Citation2016). The main occupation of the people in this area is agriculture, which mainly depends on rainfall. The topography of the area reflects that of the whole of northern and north-east regions of Ghana, being relatively flat with the rivers flowing downstream into the main White Volta River. Average temperature is around 29°C, with one rainy season, and total annual rainfall of between 1000 and 1300 mm (Addai et al., Citation2016). Conventional rainy season starts from May to October in a typical year, with peak rainfall occurring in late August and early September. However, recent climatic changes have caused the rainfall pattern to be erratic, and as such it is common to have the first rains occurring in late June or July (Addai et al., Citation2016). Land Cover/Land Use (LULC) types of the Nasia watershed include settlement, water, woodland, Rainfed agriculture, Flood Recession Agriculture (FRA) and Savanna. Savanna resulted from the integration of the open cultivated Savanna which takes into consideration agricultural produce of the original LULC of the area that will be affected during flooding (Forkuo, Citation2011). The FRA are discontinuous patches of flood-prone lands located along river systems which retains moisture after flooding and extensively used for cultivation. However, farmers also plant on farmlands along rivers through irrigation. These makes them vulnerable to the flooding events of the river system, with significant disruption to their livelihoods when farmlands become flooded.
Figure 1. The Nasia Watershed and surrounding communities. Insert: White Volta Basin and Ghana regional boundaries
2.2. Data sets
2.2.1. Field survey
Before the field survey, a desktop study using literature and other previous surveys of the region were used to gather information about the flooding regimes of the study area. Two main flooding regimes were identified; normal flooding and extreme flooding, which occur in the peak of the rainy season between August and September. The normal flooding of the river, which was identified to have a 2–3 years return period overtops the river but inundates a relatively lesser land area. Recent years of this flood included 2016 and 2018. The September 2018 flooding was considered in this study. Extreme flood event was identified to have a return period of 7–10 years, with 2007 and 2013 being some of the recent years of this flood. Extreme flooding regime also overtops the banks of the river but inundates a much wider land area and causes more havoc than the normal floods. According to Armah et al. (Citation2010), the September 2007 extreme flood was one of the most destructive in recent years, directly claiming the lives of at least 20 people and displacing over 400,000 people in northern Ghana. An estimated 3.2 USD billion worth of properties including farmlands were also destroyed. The September 2007 flooding was considered in this study.
The survey took place in late September 2018 just when the rains stopped. During this survey, a Garmin handheld GPS of accuracy between 0.3 and 3 m was used to track sections of the inundation extent of the receded floods, indicated by the watermarks left on the vegetation and soil. In all, about 32 km sections of inundation along the main Nasia River and some of the tributaries were tracked by recording the GPS coordinates. A total of 4034 watermark areas were collected in total and later used to generate a flood polygon for the normal flood. Simultaneously, GPS coordinates of water and other LULC were recorded during the tracking of the inundation extent. A total of 2,491 coordinates LULC were collected. These coordinates were used in supervised classifications to generate flood prone areas from satellite image and also for LULC mapping of the watershed. Additionally, focused group discussions were held with some community members to gather more information about the flooding characteristics of the river, especially on the return periods.
2.2.2. Landsat images and pre-processing
Three Landsat images that covered the study area were downloaded from the Earth Explorer website (https://earthexplorer.usgs.gov/). The first was a rainy season Landsat 7 ETM+ (L7) image that captured the September 2007 floods of the area. The second was another rainy season Landsat 8 OLI (L8) image that captured the September 2018 flooding. These images were used to delineate the extreme and normal flooding of the river, respectively. Though the September 2018 image had significant level of cloud in it, most of the area of interest (the Nasia River) had less could and did not have significant effect of the flood extraction process. The third image was a cloud free L8 image captured in December 2018 and was used for the LULC classification. The characteristics of the images used are shown in ). Atmospheric correction of the images was performed with the Semi-Automatic Classification tool in the QGIS software. The corrected images were clipped to the boundary of the watershed.
Table 1. Characteristics of Landsat images used in the study
2.3. Method
2.3.1. Flood prone mapping using random forest
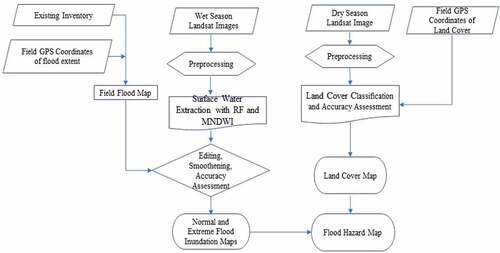
The flowchart of the methodology used in the study is showed in . Random Forest (RF) supervised image classifications were performed on the three images to drive the flood extents and LULC of the study area. Random Forest is an ensemble learning method for classification and regression that works by creating a number of decision trees during training time and outputting the class that is the mode of the classes (classification) or mean prediction (regression) of the individual trees (Ho, Citation1995). Each tree in the forest is independently constructed using a unique bootstrap sample of the training data (Breiman, Citation2001). Random Forest predicts a response from a set of predictors by creating multiple decision trees and aggregating their results (Forkuor et al., Citation2017). They are non-parametric models that do not require variables to be normally distributed (Mullainathan & Spiess, Citation2017).
Figure 2. Flowchart summarizing the methodology used in producing the flood prone and hazard maps
A binary RF model was used to extract surface water from the two wet season images to map the normal and extreme flood prone of the river. The model was built and trained with the train function in the caret package. The field samples (2,491 LULC coordinates) were categorized into two main types; water and all other LULC, which were then split into training set (70%) and test set (30%) using the sample.split function in the caTools package. Tuning of the data was done by growing a number of trees (ntrees) in the forest and setting the number of variables randomly sampled at each stage (mtry) (Janitza & Hornung, Citation2018; Probst & Boulesteix, Citation2018). Cross validation, which determines how the model will generalize to an independent dataset, was performed using K-fold cross-validation. After building the model, classification was executed on the preprocessed images.
Accuracy assessments were performed to assess the results of the classification. A confusion matrix was used to compute the Overall Accuracy (OA), Producer’s Accuracy (PA), User Accuracy (UA) and Kappa coefficient (Foody, Citation2002). Further, F1—score, which indicates the accuracy of binary classification were computed from the precision and recall using Equationequations (1)(1)
(1) and (Equation2
(2)
(2) ). The outputs were binary water maps of the river. These maps were then converted into vector files and edited, by trimming off tributaries where the ground survey did not cover.
2.3.2. Flood prone mapping water indices
Per the objective of this study, Modified Normalized Difference Water Index (MNDWI) was also used to delineate the normal and extreme flood extents of the river. MNDWI was developed by Xu et al., .Citation2013) and uses the green and shortwave infrared (SWIR) bands to extract open water from images. MNDWI was built on the earlier Normalized Difference Water Index—NDWI (McFEETERS, Citation1996), but overcomes some limitations of NDWI by enhancing open waterbodies and suppressing built up features. MNDWI values ranges between −1 and 1, with negative values signifying the presence of built or soil and positive values reflecting clear water (Singh & Kumar, Citation2013. It has been widely used to delineate open waterbodies in many studies. MNDWI was executed on the wet season L8 image to extract the normal flood prone and on the wet season L7 image to extract the extreme flood extent. MNDWI was created using Equationequation (1)(1)
(1)
After creating the MNDWI, a threshold value of zero (0) was used to slice the layers into waterbody and background after several trials. The decision to use 0 was also informed by some studies that used automatic way of selecting thresholds such as OTSU, which found 0 to be an optimal threshold value (e.g., Du et al., Citation2013). The extracted water layers were then converted into vector file to obtain flood prone layers for the normal and extreme flooding regimes of the river. Similar editing, cutting some tributaries was performed.
2.3.3. Validating flood-prone layers
The watermarks (tracked coordinates) of the flood prone recorded during the field survey were used to generate a polygon depicting the normal flood-prone areas of the river. The surface area covered by this layer was used to validate the accuracy of the normal flood extents delineated from the RF classification and MNDWI-threshold. This was achieved by overlaying the two maps and tracing and calculating the common normal flood-prone areas. Additionally, the area covered by the extreme flood-prone areas extracted using the RF classification and the MNDWI-threshold method were also validated with an existing flood-prone dataset created by HKV Consulting and contained in the Water Resources Commission of Ghana’s GIS database. This HKV flood-prone dataset was derived from a pre-2010 Landsat data of the White Volta Basin, and calibrated with ground truth data observed from the 2003 and 2007 extreme flooding of the White Volta River (Nsor et al., Citation2019). The section of the flood data that covers the Nasia River was extracted and used for the comparison. By this method, both normal and extreme flood-prone areas were properly estimated based on the matching.
2.3.4. Land cover/land use classification with random forest
A similar RF model built for extracting the flood prone areas was built and trained for the LULC classification. However, this model contained the six classes (woodland, savanna, water, FRA, rainfed, settlement/bareland) instead of the binary model. Accuracy assessment was performed with a confusion matrix. Accuracy assessment was performed using the OA, PA, UA, and Kappa coefficient.
2.3.5. Flood hazard assessment
The flood hazard zones of each flooding type (normal and extreme flood-prone areas) were assessed by overlaying the satellite-derived flood polygons on the LULC map of the watershed. The land areas of the LULC types enclosed in each polygon was computed to indicate the hazard created by the floods in each flooding regime.
3. Results
3.1. Land cover/land use mapping
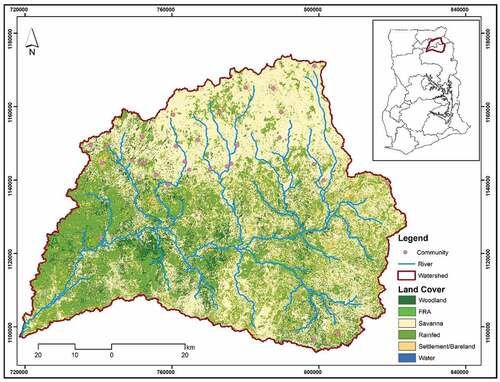
The results of the RF image classification () show the spatial extents (area) of each of the six LULC classes considered in the study with total area estimated to be 5348.54 km2. shows the area of each land class and proportions, respectively. The dominant land use/land cover in the Nasia watershed is savanna, occupying 54.96% of the land area and widely distributed throughout the watershed. The cultivated savanna areas experience periodic farming which are sometimes left for about 10 years without any cultivation. A greater percentage of cultivated areas falls in the low-lying areas which makes them prone to flood. The next dominant LULC is rainfed, constituting 28.04 of the total area. Rainfed specifically refers to farmlands that operate under annual or biannual cultivation, which include irrigated lands used to grow crops. The result indicates that majority of the farmlands are located around the river systems of the watershed, with others distributed at low-lying areas considered to be high flood zone (). These two classes accounted for about 83% of the total land area. However, FRA and water constitute 0.4 and 0.08% of the total mass, respectively, with the water covering the smallest area in the watershed. Woodland and settlement cover 12.52 and 4.09% respectively of the total land mass in the watershed. The woodlands are distributed through the lowlands of the basin with much clustering along the rivers, usually forming riparian vegetation. Most of the settlements/barelands are clustered up the upper parts of the watershed, with the exception of the Nasia community, which is located on lowland, close to the main river. The settlement areas form about 4.06% of the total land mass, with very few falling in very high flood zones and many of them very far from the Nasia River. The villages at the Northern part of the watershed are likely to face a lower level of flood risk partly explained the physical characteristics of the area, they are found on gentles slopes and relatively at high elevation and located at far distance from the main river ().
Table 2. Flood hazard areas for the different LULC
Figure 3. Land use land cover map of the Nasia watershed
3.2. Accuracy assessment of LULC classification
The confusion matrix results produced from the random forest classification is shown in . The RF classifier produced an OA of 92.32% and a kappa of 0.91. Water recorded the highest PA and UA of 100%. This was followed by Rainfed recording both PA and UA of 98.04%. Savanna recorded the lowest PA of 79.79%. The high commission and omission errors produced by the woodland class stem from the algorithm confusing the woodland with other classes, mainly savanna. This is however not surprising as closed trees formed part of the savanna class.
Table 3. Accuracy assessment of the LULC classification
3.3. Flood prone mapping
The results of the binary classification returned F1—scores of 0.76 and 0.71 for the L8 and L7 images, respectively (). The binary classification also delineated an area of 418.82 km2 for the normal flood prone compared to 423.98 km2 from the water indices. Also, the RF classification of the L7 image returned an area of 689.61 km2 compared to 691.22 km2 from the water indices. When compared with the validation datasets which covered water area of 412.63 and 686 km2 for the normal and extreme flood prone areas, respectively, the RF binary classification were closer to the validation values than the water indices. In both classifications, the water indices overestimated the area (). Thus, from , the L8 flood prone areas precisely delineated the normal flood regime of the Nasia River, whiles ETM flood prone areas precisely delineated the extreme flood prone areas of the river (). c and d shows the delineated areas overlayed on an aerial image.
Figure 4. (a) L8 precise delineation of the normal flood-prone area; (b) ETM precise delineation of the extreme flood-prone areas both validated with field data sets. (c) Extent of the normal flood-prone area on an aerial image; (b) extent the extreme flood-prone areas over an aerial image
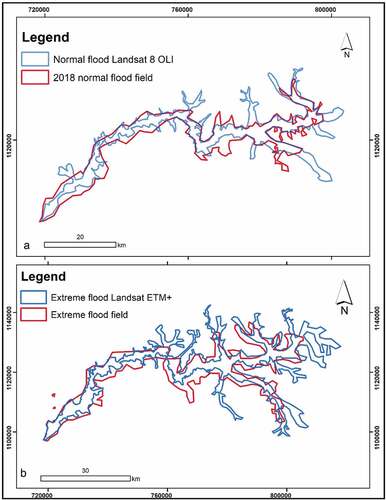
Figure 4. Continued
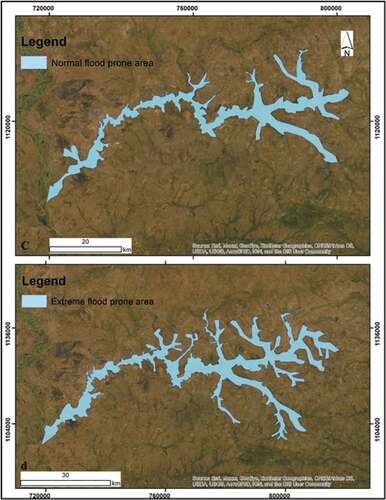
Table 4. Accuracy assessment of the random forest binary classification
Table 5. The extreme flood map inundated an area almost a twice of the normal flood regimes
3.4. Flood hazard assessment
shows the statistics of LULC affected by each flooding regime. and c also show the flood hazard map of the catchment with the affected LULC and communities. From the statistics, the LULC that was greatly affected by the normal flooding was Savanna, spanning a land area of 174.99 km2 which represents 41.45% of the total flooded area. This increased to 322.66 km2 (84.39% rise) during the extreme flooding. The next major affected LULC was rainfed with the flood inundating area of 123.63 km2 (29.45%) which increased to 178.61 km2 (44.47%). Other LULC such as woodland, settlement, and FRA had 23.08, 4.03, and 1.06% of their areas affected, respectively, during the normal flood, but increased by 36.83, 54.77, and 40.89% during the extreme flood. Additionally, from , it can be seen that the normal flood affected only the periphery/small section of the Nasia settlement but it extends greatly to affect almost all the settlement in the Nasia community in the case of the extreme flood ()
Figure 5. Flood hazard maps of the Nasia watershed showing the extent of normal and extreme flood and affected communities (a) Nasia village affected by normal flood, (b) Zoom in of Nasia village under normal flood extent (c) Nasia village under extreme flood (d) Zoon in of Nasia village under extreme flood extent
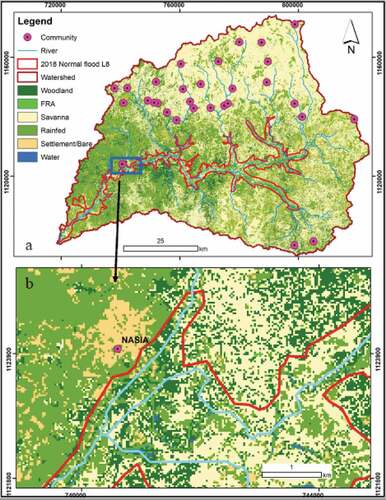
Figure 5. Continued
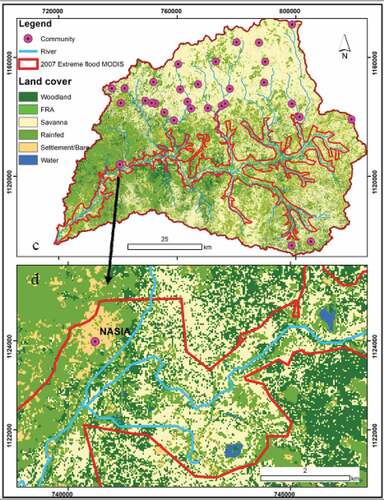
Table 6. Statistics of the hazard areas
4. Discussion
The high OA and kappa achieved showed that the model was optimized to produce high accuracies. This combined with the 30 m resolution of the L8 image, was appropriate for the development of LULC map for the watershed. The results present an improvement over the existing 1 km low resolution maps of the area developed as part of national and regional LULC mapping. Such low-resolution maps could not delineate pertinent LULC units such as FRA though these LULC type plays crucial roles in the livelihoods of the people within the watershed. Additionally, the high F1—scores and the precise estimation of the inundated areas from the supervised classification compared to the indices underscores other studies that indicated that supervised image classification has some edge over indices methods (Gautam et al., Citation2015; Pan et al., Citation2020; Yang et al., Citation2011).
The flood layers and hazard maps produced in this study provide a ready data useful to local authorities and the national disaster management organization to develop flood early warning systems within the watershed. They also serve as ready maps for disaster reliefs and disaster mitigation strategies for inhabitants within the Nasia watershed and other riparian areas. The data and methodology used in deriving these flood layers and hazard maps can be used to develop similar layers for the many rural parts of the country faced with similar challenge of flood-related disasters due to lack of timely data for early warning and mitigation planning. This will be useful for the many rural areas around the world that are in proximity of rivers but lack adequate government data to assess the flood dangers posed by rivers.
The flood hazard maps helped to determine the villages that are exposed to flooding in both the normal and extreme cases. For example, the normal flood-prone map showed that the boundaries of Nasia community is the highest potential hazard area, while, the extreme flood-prone map indicated that the entire Nasia community and the peripheries of Gbangdil and Gbimsi communities in the south eastern part of the watershed are exposed. This result is in line with other studies (Armah et al., Citation2010) which indicated that, the 2007 extreme flooding inundated the Nasia community and cut-off road access to some other communities. Additionally, the hazard maps also showed that properties such as rainfed lands, FRA and other cultivated area will be inundated by both the normal and extreme flood regimes of the river. Again, previous studies have indicated that flood events, especially the extreme category have submerged and destroyed thousands of tons of farm products and agricultural assets (Armah et al., Citation2010) which has become a threat to food security since the floods destroys most of the crops. Furthermore, the maps showed that other LULC such as Savanna and Woodland will be inundated. Though these LULC types are not directly cultivated, they offer many ecological importance such as runoff reduction and erosion control, providing protective mechanism and reducing vulnerability of the area to flooding and other adverse environmental effects (Shabani et al., Citation2014).
5. Conclusion
Flooding is mostly disastrous for humans, and their negative footprints continue to increase in recent times. Many rural areas around the world lacks established flood hazard systems and are still in initial stages of mitigating flood hazards. The availability of data will make it possible to identify areas susceptible to flooding and predict future occurrences to help prevent impending catastrophe. This study presented a procedure for assessing potential flood hazards areas in rural communities by applying remote sensing and machine learning, and utilizing the Nasia watershed in northern Ghana as a case study area. The study used wet season Landsat images and RF binary classification to delineate the normal and extreme flood-prone area of the Nasia watershed. The results indicated that an area of 418.82 km2 is flood prone in the normal case of flooding, while 689.61 km2 area is flood prone in the extreme case of flooding. A dry season Landsat image was also combined with another RF model to produce land use/cover information which was used to check the susceptibility of inundated areas in the watershed. The LULC classification produced an overall accuracy of 92.31% and kappa coefficient 0.90. A flood hazard map developed by overlaying the flood maps on the LULC maps showed that cultivated savanna and rainfed lands are the most affected by flooding of the river, bearing implications for agricultural production in the watershed. The flood hazard map further showed that whiles only some periphery of the Nasia community is inundated by water under normal flood regime, the extreme flood will inundate significant portion of the community and cut off road access to main towns. The data produced in this study will be beneficial to local administrative authorities and the national disaster management organization for flood control planning and search and rescue efforts. This study can also be used by policy makers when making plan toward rural communities. We recommend future studies that incorporate the geology, rainfall intensity, and soil type in the model and extend the method to other watershed catchment for sustainable flood control.
Additional information
Funding
Notes on contributors
Benjamin Ghansah
I am a Spatial Analyst at the Center for Urban and Community Design- University of Miami (UM), Coral Gables, and research associate at Department of Geomatic Engineering, Kwame Nkrumah University of Science and Technology, Kumasi-Ghana. I am broadly interested in geospatial data analysis with particular emphasis on developing GIS/Remote Sensing (RS) models, change detection, and machine learning. I also collaborate with researchers from different institutions. One of such research collaborations is the result of this paper, where I teamed with staff from Koforidua Technical University to work on one of the prevalent environmental problems in Northern Ghana.
References
- Addai, M. O., Yidana, S. M., Chegbeleh, L. P., Adomako, D., & Banoeng-Yakubo, B. (2016). Groundwater recharge processes in the nasia sub-catchment of the white volta basin: analysis of porewater characteristics in the unsaturated zone. Journal of African Earth Sciences, 122, 4–16. https://doi.org/10.1016/j.jafrearsci.2015.04.006
- Armah, F. A., Yawson, D. O., Yengoh, G. T., Odoi, J. O., & Afrifa, E. K. (2010). Impact of floods on livelihoods and vulnerability of natural resource dependent communities in Northern Ghana. Water, 2(2), 120–139. https://doi.org/10.3390/w2020120
- Breiman, L. (2001). Random forests. Machine Learning, 45(1), 5–32. https://doi.org/10.1023/A:1010933404324
- Cian, F., Marconcini, M., & Ceccato, P. (2018). Normalized difference flood index for rapid flood mapping: taking advantage of EO big data. Remote Sensing of Environment, 209, 712–730. https://doi.org/10.1016/j.rse.2018.03.006
- Du, J., Fang, J., Xu, W., & Shi, P. (2013). Analysis of dry/wet conditions using the standardized precipitation index and its potential usefulness for drought/flood monitoring in Hunan Province China. Stochastic Environmental Research and Risk Assessment : Research Journal, 27(2), 377–387. https://doi.org/10.1007/s00477-012-0589-6
- Foody, G. M. (2002). Status of land cover classification accuracy assessment. Remote Sensing of Environment, 80(1), 185–201. https://doi.org/10.1016/S0034-4257(01)00295-4
- Forkuo, E. K. (2011). Flood hazard mapping using aster image data with GIS. International Journal of Geomatics and Geosciences, 1(4), 932-950. http://citeseerx.ist.psu.edu/viewdoc/download?doi=10.1.1.422.269&rep=rep1&type=pdf
- Forkuor, G., Hounkpatin, O. K., Welp, G., & Thiel, M. (2017). High resolution mapping of soil properties using remote sensing variables in South-Western Burkina Faso: A comparison of machine learning and multiple linear regression models. PloS One, 12(1), e0170478. https://doi.org/10.1371/journal.pone.0170478
- Gautam, V. K., Gaurav, P. K., Murugan, P., & Annadurai, M. (2015). Assessment of surface water dynamicsin Bangalore using WRI, NDWI, MNDWI, supervised classification and KT transformation. Aquatic Procedia, 4, 739–746. https://doi.org/10.1016/j.aqpro.2015.02.095
- Ghoneim, E., & Foody, G. M. (2013). Assessing flash flood hazard in an arid mountainous region. Arab. J. Geosci, 6 (4), 1191–1202. [CrossRef]. https://doi.org/10.1007/s12517-011-0411-7
- GOG Offical Portal (Government of Ghana). (2019). Ghana.gov.gh
- Goldberg, M. D., Kilcoyne, H., Cikanek, H., & Mehta, A. (2013). Joint polar satellite system: the United States next generation civilian polar‐orbiting environmental satellite system. Journal of Geophysical Research: Atmospheres, 118(24), 13–463. https://doi.org/10.1002/2013JD020389
- Ho, T. K. (1995). Random decision forests. In #60;italic#62;Proceedings of 3rd international conference on document analysis and recognition, Montreal, Canada#60;/italic#62; (Vol. 1, pp. 278-282). IEEE. https://doi.org/10.5555/844379.844681
- IPCC. (2007). Climate Change. Impacts, adaptation and vulnerability. Contribution of Working Group II to the Fourth Assessment Report of the Intergovernmental Panel on Climate Change. Intergovernmental Panel on Climate Change.
- Janitza, S., & Hornung, R. (2018). On the overestimation of random forest’s out-of-bag error. PloS One, 13(8), p.e0201904. https://doi.org/10.1371/journal.pone.0201904
- Jonathan, D. W., Jennifer, L. I., & Suzana, J. C. (2013). Coastal flooding by tropical cyclones and sea-level rise. Nature, 504(7478), 44–52. https://doi.org/10.1038/nature12855
- McFEETERS, S. K. (1996). The use of the normalized difference water index (NDWI) in the delineation of open water features. International Journal of Remote Sensing, 17(7), 1425–1432. https://doi.org/10.1080/01431169608948714
- Memon, A. A., Muhammad, S., Rahman, S., & Haq, M. (2015). Flood monitoring and damage assessment using water indices: A case study of Pakistan flood-2012. The Egyptian Journal of Remote Sensing and Space Science, 18(1), 99–106. https://doi.org/10.1016/j.ejrs.2015.03.003
- Messner, F., & Meyer, V. (2006). Flood damage, vulnerability and risk perception–challenges for flood damage research. In Schanze J., Zeman E., Marsalek J. (Eds.), Flood Risk Management: Hazards, Vulnerability and Mitigation Measures (pp. 149–167). Springer.
- Mullainathan, S., & Spiess, J. (2017). Machine learning: An applied econometric approach. Journal of Economic Perspectives, 31(2), .87–106. https://doi.org/10.1257/jep.31.2.87
- Nicholls, R., Burcharth, H. F., Zanuttigh, B., Andersen, T. L., Orcid, L., Lara, J. L., Steendam, G. J., Roul, P., Sergent, P., & Ostrowski, R. (2015). Developing a holistic approach to assessing and managing coastal flood risk. In Coastal Risk Management in a Changing Climate (pp. 9–53). Elsevier—Butterworth-Heinemann.
- Nsor, C. A., Ashiagbor, G., & Danquah, E. (2019). Quantifying recent floodplain vegetation change along the white Volta river in the Northern region of Ghana. Ghana Journal of Geography, 11(1), 150–170. https://www.ajol.info/index.php/gjg/article/view/186827
- Pan, F., Xi, X., & Wang, C. (2020). A comparative study of water indices and image classification algorithms for mapping inland surface water bodies using landsat imagery. Remote Sensing, 12(10), 1611. https://doi.org/10.3390/rs12101611
- Probst, P., & Boulesteix, A. L. (2018). To tune or not to tune the number of trees in random forest. Journal of Machine Learning Research, 18(181), 1–18. https://www.jmlr.org/papers/volume18/17-269/17-269.pdf
- Ramin, B. M., & McMichael, A. J. (2009 March). Climate change and health in sub-Saharan Africa: A case-based perspective. Ecohealth, 6(1), 52–57. https://doi.org/10.1007/s10393-009-0222-4. Epub 2009 May 6. PMID: 19418098.
- Roy, D. P., Wulder, M. A., Loveland, T. R., Woodcock, C. E., Allen, R. G., Anderson, M. C., Helder, D., Irons, J. R., Johnson, D. M., Kennedy, R., & Scambos, T. A. (2014). Landsat-8: science and product vision for terrestrial global change research. Remote Sensing of Environment, 145, 154–172. https://doi.org/10.1016/j.rse.2014.02.001
- Schumann, G. J.-P., Brakenridge, G. R., Kettner, A. J., Kashif, R., & Niebuhr, E. (2018). Assisting flood disaster response with earth observation data and products: A critical assessment. Remote Sens, 10(8), 1230. https://doi.org/10.3390/rs10081230
- Shabani, F., Kumar, L., & Esmaeili, A. (2014). Improvement to the prediction of the USLE K factor. Geomorphology, 204, 229–234. https://doi.org/10.1016/j.geomorph.2013.08.008
- Singh, O., & Kumar, M. (2013). Flood events, fatalities and damages in India from 1978 to 2006. Nat Hazards, 69(3), 1815–1834. https://doi.org/10.1007/s11069-013-0781-0
- Stijn, T., Patrick, M., Tjeerd, J. B., Peter, M. J. H., Ysebaert, T., & Vriend,, H. J. D. (2013). Ecosystem-based coastal defence in the face of global change. Nature, 504(7478), 79–83. https://doi.org/10.1038/nature12859
- Wulder, M. A., Loveland, T. R., Roy, D. P., Crawford, C. J., Masek, J. G., Woodcock, C. E., Allen, R. G., Anderson, M. C., Belward, A. S., Cohen, W. B., & Dwyer, J. (2019). Current status of Landsat program, science, and applications. Remote Sensing of Environment, 225, 127–147.https://doi.org/10.1016/j.rse.2019.02.015#x00A0;
- Xu, C., Chen, Y., Chen, Y., Zhao, R., & Ding, H. (.2013). Responses of surface runoff to climate change and human activities in the arid region of Central Asia: A case study in the Tarim River Basin, China. Environ Manag, 51(4), 926–938. https://doi.org/10.1007/s00267-013-0018-8
- Yang, H., Wang, Z., Zhao, H., & Guo, Y. (2011). Water body extraction methods study based on RS and GIS. Procedia Environmental Sciences, 10(PARTC)), 2619–2624. https://doi.org/10.1016/j.proenv.2011.09.407
- Yiran, G. A. and Stringer, L. C. (2016). Spatio-temporal analyses of impacts of multiple climatic hazards in a savannah ecosystem of Ghana. Climate Risk Management, 14, 11–26