
 ?Mathematical formulae have been encoded as MathML and are displayed in this HTML version using MathJax in order to improve their display. Uncheck the box to turn MathJax off. This feature requires Javascript. Click on a formula to zoom.
Abstract
Knowledge on hydraulic characteristics of fractured crystalline basement aquifers is limited resulting to lack of reliable information for effective groundwater management. This is crucial as these aquifers provide good sources of potable water in most rural communities. Heterogeneous nature of these aquifers requires detailed understanding and accurate estimation of hydraulic characteristics. This study estimated hydraulic characteristics of a fractured crystalline basement aquifer and inferred their influence on groundwater storage potential and flow. Aquifer Test Solver was used for automatic curve matching to identify appropriate aquifer models and test solutions for estimating hydraulic characteristics. Root-mean-square error (RMSE), mean absolute error (MAE) and correlation coefficient (R) were used to evaluate the performance of the fitted models. Plotted derivative curves were used to identify the presence of fracture dewatering in the aquifer. The R, RMSE and MAE ranged from 0.702 to 0.995, 0.31–3.45 m and 0.23 to 3.06 m, respectively. The fits between measured and estimated drawdowns were good and performance mostly acceptable and comparable to those of related studies. Storativity, transmissivity and hydraulic conductivity ranged from 0.0003 to 0.0680, 0.78 to 12.3 m2/day and 8.56 × 10⁻⁷ to 5.32 × 10⁻⁶ m/s, respectively. The storage potential of the aquifer varied from low to high, ability to transmit water per unit area was mostly medium though the ability to transmit water through its entire thickness was mostly low. The study area is dominated by leaky aquifer and fracture dewatering. Groundwater use should be monitored and managed effectively to avoid fracture dewatering and its associated risks.
PUBLIC INTEREST STATEMENT
Fractured crystalline basement aquifers are main sources of potable water supply in most rural communities. Despite this, there are limited studies in these areas resulting to poor understanding of their hydraulic characteristics and influence on their potential for groundwater supply. This study is, therefore, crucial as it contributed to further knowledge on hydraulic characteristics of fractured crystalline basement aquifers and their influence on groundwater storage potential and flow in semi-arid areas. This information assists in avoiding risks associated with groundwater mismanagement such as fracture dewatering and aquifer depletion. Estimation of aquifer hydraulic characteristics provides information required for sustainable use of groundwater and supports groundwater modelling and assessment studies in semi-arid areas.
1. Introduction
Fractured crystalline basement aquifers are good sources of potable water in many parts of the world (Badmus & Olatinsu, Citation2010). Between 60% and 90% of communities in rural southern Africa are dependent on groundwater sources from these basement aquifers (Braune & Mutheiwana, Citation2009). In Limpopo Province of South Africa, groundwater from fractured crystalline basement aquifers accounts for almost 70% of rural domestic water supply (W. Du Toit et al., Citation2012). Due to the low intrinsic primary permeability and porosity of the bedrock, crystalline aquifers differ from other aquifer types, and demand-specific knowledge and techniques if groundwater is to be extracted and managed efficiently (Holland, Citation2011). In addition, Lee and Kim (Citation2015) reported that sustainable use of groundwater in fractured rock aquifers requires detailed knowledge of their hydraulic properties (transmissivity, storativity and hydraulic conductivity).
Pumping tests are typically used to estimate aquifer hydraulic characteristics. These provide simultaneous information on hydraulic behaviour of the well (borehole), the reservoir and its boundaries, which are essential for efficient aquifer and well field management (Khadri & Moharir, Citation2016). Aquifer hydraulic characteristics are some of the important parameters needed for developing numerical groundwater flow models (Mace & Smyth, Citation2003) and they aid in quantitative prediction of the hydraulic response of the aquifer to recharge and pumping (Senior & Goode, Citation1999). Two main approaches to pumping test analysis are inverse modelling and curve matching (Kresic, Citation2006). In inverse modelling, variables that can be obtained more accurately (for example, hydraulic head) are modelled and aquifer parameters are inversely estimated from them (Bateni et al., Citation2015). Although inverse modelling, using MODFLOW for example, generally estimates aquifer parameters more accurately as compared to curve matching methods (Moharir et al., Citation2017; Van Tonder et al., Citation2002), data required for such models may not be readily available. Application of such models also requires an experienced user and construction of the correct conceptual model for the geological set-up (Van Tonder et al., Citation2002). Another principal difficulty of inverse models (estimation schemes coupled to numerical groundwater flow models) is that the deterministic structure of the aquifer must be known a priori (Li et al., Citation2005). Makungo and Odiyo (Citation2017) also noted that data required to quantify aquifer parameters from physically based models is rarely available and expensive to acquire in most developing countries. In addition, approximations, assumptions and simplifications that are made in physically based models result to errors and uncertainty in the outputs. In cases where inverse models cannot be applied, curve matching methods offer an alternative approach to estimation of hydraulic parameters.
Curve matching involves fitting theoretical type curves to observed drawdown data. The model that compares best with the real system is then selected for the calculation of hydraulic characteristics (Kruseman & De Ridder, Citation2000). To circumvent the difficulty in choosing an appropriate conceptual model (type curve), diagnostic plots (semi-log and log-log plots and derivatives) are also used to interpret pumping test data. Logarithmic derivatives of the drawdown as a function of time were used to identify the flow regime, fracture intersections and boundary conditions in the crystalline basement aquifers of Namaqualand, South Africa, in a study by Pietersen et al. (Citation2009). Double porosity behaviour of the aquifer was apparent in the derivative plot after initial borehole storage effects and radial flow regimes were observed at later times of the pumping test (Pietersen et al., Citation2009). Holland (Citation2011) visually compared pumping test datasets from 2 359 boreholes to a set of typical diagnostic plots. The boreholes were from selected crystalline basement aquifers within the Limpopo Province, South Africa. Theis, double porosity, leaky aquifer, generalised radial flow models were identified. The results of the latter study showed that double porosity behaviour was displayed in 1082 boreholes within the study area.
Diagnostic plots were used to determine aquifer parameters based on best-fit theoretical models for boreholes located in crystalline rocks of Serre Massif, southern Italy in a study by Baiocchi et al. (Citation2014). Theis, double porosity and leaky aquifer models were identified from comparison of diagnostic plots and theoretical models. Roques et al. (Citation2014) obtained hydraulic parameters of the crystalline aquifer system in Saint-Brice en Coglès in Mancellian Domai, France by fitting the drawdown data with classic analytical models. Double porosity and radial flow were identified during the 63 days pumping periods. Nyende et al. (Citation2016) used semi-log, log-log plots of drawdown versus time and derivative to describe flow behaviour in crystalline fractured rocks of Pallisa District within the Kyoga Basin, Uganda. The results indicated that while response at the pumping well, suggested linear single fracture flow, with availability of more data, later time showed that the aquifer responds to what would seem to be radial flow (Nyende et al., Citation2016). Machiwal et al. (Citation2017) developed spreadsheet programmes for estimating aquifer parameters by matching of observed time-drawdown curve with theoretical curves in hard-rock aquifer system of Ahar River catchment, Udaipur, India. The best-fit model accurately estimated the aquifer parameters.
This study estimated hydraulic characteristics of a fractured basement crystalline aquifer within Nzhelele semi-arid area, which is dependent on groundwater for community water supply. Estimation of hydraulic characteristics is essential to provide information on groundwater storage potential required for sustainable use of groundwater in the study area. The study contributed to inferring groundwater storage potential, determining the ability of the aquifer to transmit water and identifying potential problems associated with groundwater over abstraction in fractured basement crystalline aquifers, based on aquifer hydraulic characteristics. The heterogeneous nature of fractured crystalline basement aquifers requires that analyses of their characteristics are done at several sites as these aquifers are characterised by high spatial variability. More studies are therefore required to capture spatial variation of hydraulic characteristics in these aquifers and their implications on groundwater storage and movement. The findings of this study are therefore crucial and will aid management of groundwater resources in fractured basement crystalline aquifers. Aquifer hydraulic characteristics are also crucial in supporting groundwater modelling and assessment studies in semi-arid areas which can be limited by lack of data.
Hydraulic characteristics of fractured basement crystalline aquifers are rarely evaluated prior to their development resulting to lack of knowledge on risk of resource over-exploitation and reliable data for formulating effective groundwater management policies (Howard & Karundu, Citation1992). Holland (Citation2011) also noted that hydrogeology of crystalline aquifers is not yet fully understood. The study therefore further contributed to knowledge on hydraulic characteristics of fractured crystalline basement aquifers in semi-arid areas which will aid in providing understanding of their groundwater systems prior to further developments and the associated risks. Studies that have been done in Limpopo Province including Dippenaar (Citation2008) and Holland (Citation2011) mostly covered areas within Sand, Luvuvhu and Letaba River Catchments. Thus, the hydraulic characteristics of Nzhelele area are still unknown. In addition, the studies did not determine the groundwater storage potential which gives an indication of potential groundwater availability. This area is highly dependent on groundwater due to scarce surface water resources associated with its semi-arid nature. Sustainable use and management of groundwater resources in this area is therefore crucial and this can only be achieved if the groundwater system is understood.
Most studies that have applied AQTESOLV did not evaluate the performance of the fitted models based on statistical measures as done in the current study. For example, Gross (Citation2008) only compared hydraulic characteristics computed by manual method and AQTESOLV while Taher (Citation2021) also just compared transmissivity estimated based on spreadsheet analytical model and AQTESOLV. Statistical measures assist in determining the relationship between observed and estimated values as well as model errors. This is crucial as they determine the accuracy of the hydraulic parameters estimated by the model. AQTESOLV has become one of the commonly used software for analysing pumping test data, hence determining its accuracy is important.
2. Study area
The study area covers selected boreholes within the vicinity of villages in Nzhelele area in Limpopo Province of South Africa (). The main river in study area is Nzhelele River, which originates from the Soutpansberg Mountains and flows north to Limpopo River. Its tributary is Mutshedzi River. The flow pattern of Nzhelele River is highly variable because of low and unpredictable rainfalls (average 350–400 mm/annum) in the catchment and the river is not perennial (Ashton et al., Citation2001), with no water for several months. The rainfall is seasonal and occurs during summer months from October–March. During dry years, the river can remain without water for several months. Summer rainfalls cause dramatic increase in flows, though the tributary streams are mostly episodic and only contain water after rainfalls (Ashton et al., Citation2001). The mean annual evaporation varies from 1300 to 1400 mm (Makungo et al., Citation2010). Limited rainfall and high evaporation indicate the semi-arid nature of the study area which results in scarcity of surface water. Nzhelele area is characterized by high temperature variations with summer temperatures range from 22°C to 40° C while winter temperatures range from 16°C to 22°C.
Figure 1. Pumping test boreholes within the study area
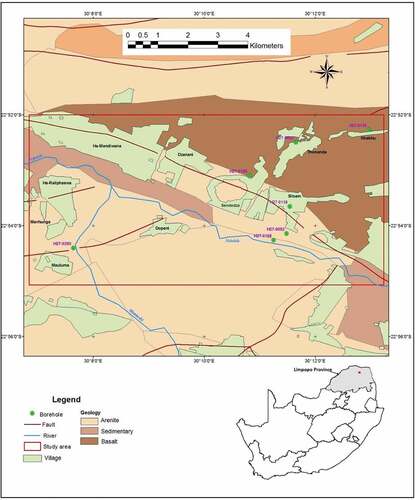
At a regional scale, the study area is located within the younger cover of the Limpopo Mobile Belt (LMB) of southern Africa. The LMB is an extensive high-grade terrain subdivided into three lithologically and structurally distinct zones, which are the northern, central and southern marginal zones. The 250 km, East–North East to West North West (ENE-WNW) trending LMB, is thought to represent a Himalayan-style collision event between the Kaapvaal craton and the Zimbabwe craton (Singh et al., Citation2009). At a local scale, the area is found within the severely faulted Soutpansberg Group of the Mokolian age, which forms part of the fractured crystalline basement aquifers of Limpopo Province in South Africa (Makungo & Odiyo, Citation2017). Bumby et al. (Citation2002) suggested that the Soutpansberg Group may have been related to a half-graben bound to the south by a northwards-dipping normal fault, perhaps associated with orogenic collapse of the Limpopo Belt. Soutpansberg Group emerges as a large east-west trending mountain range (escarpment) from the Kruger National Park in the east to Vivo in the west. Main rock types include basalt of the Sibasa formation, and arenite of the Nzhelele and Tshifhefhe formations. Sedimentary deposits are also found within the vicinity of Nzhelele River. Groundwater occurs in fractured aquifers with median borehole yield of 0.5–2 l/s (W.H. Du Toit et al., Citation2002)
A geological cross-section () from Makungo (Citation2019) indicates the presence of dykes and faults including the Siloam fault in the study area which play a significant role in controlling groundwater flow and storage. Faults create linear zones of high secondary porosity which may act as preferred channels of groundwater flow (Singhal & Gupta, Citation2010). Fractures exposed to the surface can also create preferential flow paths, which short circuit the path to the water table (Holland, Citation2011). Morel and Wikramaratna (Citation1982) reported that if dykes contain more fractures than the host basement rock, they improve the potential yield of the aquifer. A study by Holland (Citation2012) showed that dykes were important water-bearing features in the Limpopo Plateau. Dykes are also likely to serve as water-bearing features in the study area which is within the Limpopo Plateau. There is limited data on borehole logs in the study area. The lithology from two boreholes drilled in the study area (Onipe, Citation2018) indicates the presence of argillaceous sand, grey wacke, clay, basalt, sandy clay and depth to groundwater (water table) at 28 and 40 m ().
Figure 2. Geological cross section of the study area (Makungo, Citation2019)
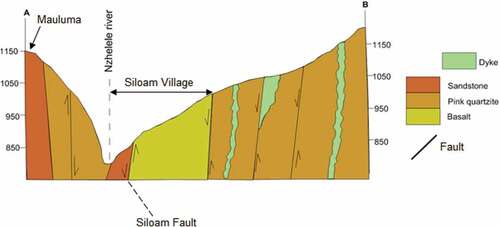
Figure 3. Borehole lithology (Onipe, Citation2018)
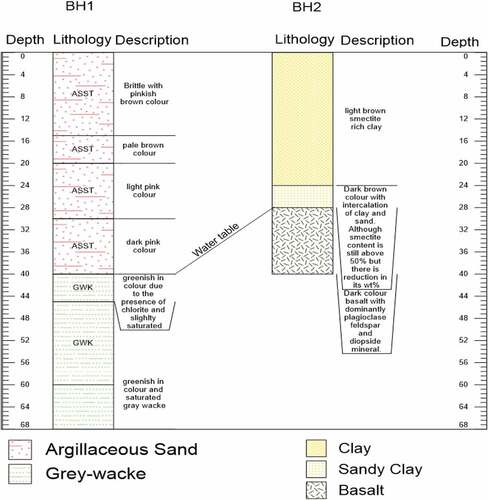
Figure 3. Continued
3. Methodology
Pumping test data for single-well tests boreholes located within the study area () were obtained from VSA Leboa Consulting Pty Ltd. Details of the pumping tests are provided in . Aquifer Test Solver (AQTESOLV) Pro version 4.5 was used for automatic curve matching to identify appropriate aquifer models and test solutions for estimating hydraulic characteristics following Duffield (Citation2007). The software automatically selects an aquifer model (for example, confined, unconfined, leaky and fractured) and aquifer test solution that gives the best fit of observed and estimated drawdowns. This aids in improving the accuracy of estimated hydraulic characteristics. Non-linear least squares fitting (automatic curve matching) procedure based on the Gauss–Newton linearization method was used as an optimisation method, to obtain the best model parameters. Moustafa (Citation2011) and Yang (Citation2020) also used non-linear least square fitting method to fit different type curves to the measured drawdown searching for the best model that matches the observed data. The objective function used in curve fitting was to minimise the residual sum squares (RSS) (Equation 1). Residuals are measures of the error in the curve matching and they indicate the difference between observed and simulated drawdown.
Table 1. Details of pumping test
where xi and yi are the ith values of observed and estimated drawdowns, respectively.
The root-mean-square error (RMSE), mean absolute error (MAE) and correlation coefficient (R) (Equations 2–4) were used to evaluate the performance of the fitted models. The RMSE is the most frequently used measure of the deviation between observed and estimated values, expressed in the units of the variable. MAE measures the average absolute value of the model errors. The RMSE and MAE equal to 0 indicate a perfect agreement between observed and estimated values. Increase in RMSE values indicates an increasingly poor agreement between observed and estimated values (Viaroli et al., Citation2019). Correlation coefficient (R) indicates the strength and direction of a linear relationship between observed and simulated values (Viaroli et al., Citation2019). R values ≥0.5 are acceptable while those >0.9 indicate satisfactory model performance (Singh et al., Citation2004).
where xi and yi are the ith observed and estimated drawdowns, respectively, and n is the number of estimated parameters and n is total number of observations. Aquifer hydraulic characteristics (storativity, transmissivity and hydraulic conductivity) were computed based on the aquifer test solution model selected by the software for each set of pumping test data. Cooper–Jacob solution was also used to compute transmissivity from flow characteristics (FC) programme. Storativity values could not be estimated based on the methods used in the FC programme. This was because the methods used in the FC programme are very insensitive to changes in drawdown and the calculated storativity values are therefore biased (Dippenaar, Citation2008). Hydraulic conductivity was computed from the relationship:
where K is hydraulic conductivity, T is transmissivity and b is aquifer thickness. The hydraulic characteristics were used to infer groundwater storage potential and the ability of the aquifer to transmit water in the study area. Krasny (Citation1993) classification of was used to infer groundwater supply potential for the study area. This classification has also been used in recent studies including Adeniji et al. (Citation2017) and
Ige et al. (Citation2018) for estimating groundwater potential. Derivatives plotted in AQTESOLV were used to identify the presence of fracture dewatering from the pumping test data. This was essential in understanding risks such as drying out of boreholes and surface water resources as well as fracture and well clogging which are associated with fracture dewatering.
4. Results
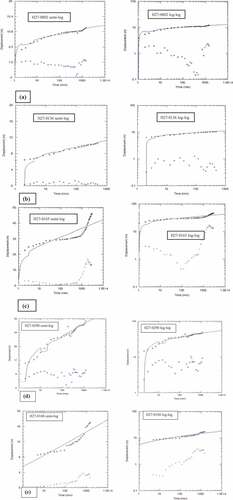
The computed performance measures R, RMSE and MAE values for all the boreholes ranged from 0.702 to 0.995, 0.31–3.45 and 0.23 to 3.08 m, respectively (). Graphical fits of observed and estimated drawdowns, particularly on log-log scale, were comparable for most of the boreholes (). However, observed drawdown curves for boreholes H27-0165 and H27-0168 on semi-log scale did not match very well with estimated ones. Good fit of the model to the data suggests a sound conceptual model and increased confidence in the estimated parameters as explained in Holland (Citation2011). Leaky aquifer was the common model (identified in 5 out of 7 of the boreholes) indicating that the study area is dominated by leaky aquifer ()). Double porosity and single fractured models were also identified for boreholes H27-0052 and H27-0138, respectively ().
Figure 4. Diagnostic plots for (a) fracture double porosity and (b) single horizontal fracture
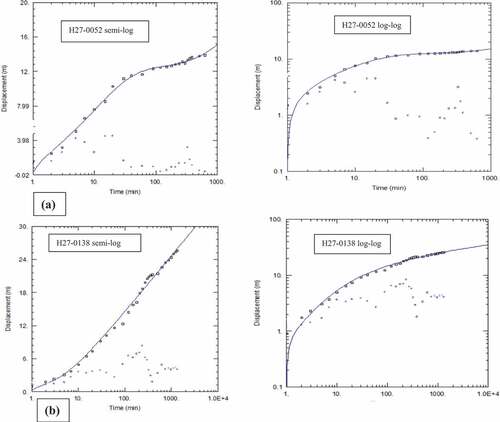
Table 2. Evaluation of model fit
The solutions identified for estimation of aquifer parameters include Moench case 1, Moench case 2, and Hantush for leaky, Gringarten-Ramey with horizontal fracture for single fracture and Moench with slab blocks for double porosity fractured aquifers (). Moench case 1 assumes that constant-head source aquifers supply leakage across overlying and underlying aquitards while case 2 assumes no-flow boundaries across overlying and underlying aquitards (Duffield, Citation2007). The calculated storativity, transmissivity and hydraulic conductivity values for all boreholes ranged from 0.0003 to 0.0680, 0.78 to 12.3 m2/day and 8.56 × 10⁻⁷ to 5.32 × 10⁻⁶ m/s (0.07 to 0.46 m/day), respectively.
Table 3. Hydraulic characteristics obtained in the study area
5. Discussions
The computed R values for six boreholes were greater than 0.9, while that of one borehole (H27-0165) was greater than 0.5 indicating the model performance ranged from acceptable to satisfactory (). The MAE, RMSE and R values ranging from 0.318 to 0.776, 0.408 to 0.953 and 0.246 to 0.825, respectively, were obtained by Alzraiee et al. (Citation2014) based on different formulations of centralised and decentralised fusion methods used for estimating aquifer parameters using drawdown data from hypothetical pumping tests. All R values for this study, except for that of H27-0165 (), were higher than those obtained by Alzraiee et al. (Citation2014). MAE and RMSE values were mostly comparable with those of Alzraiee et al. (Citation2014) with exception of those of borehole H27-0165 and H27-0290 which were higher. The RMSE values computed from measured and drawdowns estimated from simple derivative-based and curve type methods for a confined aquifer located in Fars province, southern Iran ranged from 0.091 to 0.82 m in a study conducted by Naderi (Citation2019). The RMSE values for four boreholes (H27-0002, H27-0052, H27-0136 and H27-0138) were within the range of values obtained by Naderi (Citation2019). Fan et al. (Citation2020) obtained RMSE values ranging from 0.124 to 5.197, 0.039 to 0.24, 0.094 to 2.627 when estimating aquifer parameters based on neural network (ANN), random forest (RF), and support vector machine (SVR) methods, respectively. The RMSE values obtained in this study were within the range of those obtained by Fan et al. (Citation2020) based on ANN method and SVR methods, except for that of H27-0165, which exceeded the SVR range.
The identified aquifer test solutions can aid in estimation of hydraulic characteristics of the study area since the graphical fits of estimated drawdowns for most boreholes were closer to those of estimated ones and MAE, RMSE and R were mostly acceptable and comparable with those of related studies. Borehole H27-0165 had the highest RMSE and MAE values, indicating high deviations between observed and estimated drawdowns. The poor graphical fits for this borehole are also an indication of the deviations ()). Sahin (Citation2016) noted that the success of the curve matching procedure is strongly dependent on the quality of drawdown data, which is affected by measurement errors and deviations from the ideal aquifer conditions because of heterogeneity in the aquifer medium. A hypothetical case study by Yeh and Huang (Citation2009) also noted that improper procedures, data of poor quality and aquifer heterogeneity resulted to biased estimates of aquifer parameters. In a study by Wang et al. (Citation2020), observed drawdowns were not approximately the same as the calculated ones due to heterogeneity of the aquifer, though they were comparable. Naderi and Gupta (Citation2020) also indicated that inadequate temporal resolution of the pumping rate and systematic observational error significantly increases bias of estimated drawdown. The deviations on observed and estimated drawdowns in this study are also likely to be due to measurement errors and heterogeneity of the aquifer medium which were not captured by the test solution.
The identified aquifer models include leaky, double porosity and single fractured. In a leaky aquifer, water comes from storage of the pumped aquifer and the leaky confining unit, during early time of pumping (Kuniansky & Bellino, Citation2012). The system reaches steady state when there is equilibrium between discharge and the leakage through the confining unit from the unstressed aquifer (Halford & Kuniansky, Citation2002). The effect of leakage is that the drawdown curves flatten and eventually become constant when steady state is reached (Hemker & Randall, Citation2013). This has been displayed in log-log graphs of H27-0002, H27-0136 and parts of H27-0165 and H27-0168 (, b, c) and 4). Fractured double porosity behaviour was identified in borehole H27-0052 (). In a double porosity aquifer, matrix blocks have low permeability and high (primary) porosity and storage capacity, only the fractures produce flow directly to the well and matrix blocks act as a source, which feeds water into the fractures (Holland, Citation2011). Renard et al. (Citation2009) explained that early pumping depletes the first reservoir (fractures, e.g.), which is then partly compensated by a delayed flux provided by a second compartment of the aquifer (second/intermediate stage) and equilibrium is reached at the late time (last stage). A single horizontal fracture model was identified in borehole H27-0138. In a single fracture model, the flow towards the well takes place in the fracture only and it is parallel (i.e. linear in the fault) (Holland, Citation2011). At intermediate times water is supplied by the fracture and matrix.
The identified aquifer models, particularly leaky model, are common in typical crystalline basement aquifers. Leaky aquifer models provided best matches of estimated and recorded drawdown data than any other solutions in the basement aquifers in Ethiopia in a study by Daddi (Citation2015). Leakage conditions was also identified by Hammond (Citation2018) as one of the dominant flow regimes based on analysis of hydraulic tests data in the fractured-rock aquifers of central Maryland, United States of America. Holland (Citation2011) also noted that crystalline basement rocks are usually semi-confined (fractured bedrock). Akanbi and Tijani (Citation2016) identified regolith, leaky and dual (double porosity) aquifer models from analysis of single well pumping tests in crystalline basement terrains of the Ibarapa region, Nigeria. The dominance of regolith aquifer was associated with limited bedrock fractures in the area. In this study, the presence of leaky and fractured aquifer models is associated with presence of faults in the area as indicated in .
All boreholes are characterised by fluctuating derivative curves showing high presence of fracture dewatering in the study areas (). If fractures were dewatered during the test, the derivative curve in the log-log plot drops at the position of the fracture and it rises after that (Van Tonder et al., Citation2002). According to Lasher (Citation2011), when the pressure in the fracture is released, it causes a change in rate of water level, shown by a drop in the derivative; the fracture contribution then reaches equilibrium with the surrounding matrix, showing unconfined aquifer behaviour causing the derivative to increase again. Hammond and Field (Citation2014) also noted that the derivative formed a sharp peak, probably due to a rapid decline related to dewatering of the first fracture followed by recovery due to leakage in a leaky aquifer in New Hampshire. The results of this study show that the aquifer in the study area is characterised by fracture dewatering as they had rising and falling derivative curves in the log-log plots ().
Fracture dewatering influences groundwater levels depending on the abstraction rate (Van Tonder et al., Citation2002). Jayawardena and Sarathchandra (Citation1995) also associated drying out of surface water resources to the dewatering cone extending along a linear rock fracture in Sri Lanka. Fracture dewatering should be avoided, whenever possible, because of the danger of mineral precipitation that can cause fracture and well clogging (Van Tonder et al., Citation2002). The latter study noted that caution should be placed when assigning sustainable yields to boreholes in aquifers characterised by fracture dewatering since it is dependent on the abstraction rate. Clogging of fractures due to calcite precipitation and fracture compaction were also associated with fracture dewatering in a study by Hammond (Citation2018), and this resulted to reduction of yield by 40–50%. Khan et al. (Citation2020) indicated that dewatering influences total dissolved solids interactions through rock–water interaction especially in aquitard and aquifer rich fine sediments (clay, carbonate and hard rocks). Fracture dewatering therefore affects the quality of groundwater.
Storativity values for H27-0002, H27-0136, H27-0165 and H27-0168 () fell within the range of typical values of 0.00001 to 0.001 for confined and leaky aquifers specified in Hall and Chen (Citation1996). Storage coefficient (storativity) indicates the ability of an aquifer to store water (Sen, Citation2009). Thus, the aquifer within the vicinity of these boreholes has low potential to store water since they have low storativity values. This is typical in fractured basement aquifers since their storage is dependent on the presence of fractures and their connectivity. Boreholes H27-0138, H27-0052 and H27-0290 have relatively high storativity values of 0.006, 0.008 and 0.068, respectively. These boreholes are also located on or within the vicinity of faults. Borehole H27-0290 which is located on a fault () has the highest value of storativity. Holland (Citation2012) reported that proximity of lineaments increases borehole productivity within Limpopo Province. Thus, increased storativity can be linked to the presence of faults. Jeanne (Citation2012) also noted that micro- and macro-fractures lead to increase in storativity. High storativity values indicate potential for high water storage by an aquifer (Dhungel & Fiedler, Citation2016; Watson & Burnett, Citation1995). Thus, the aquifers where boreholes H27-0138, H27-0052 and H27-0290 are located have relatively high potential to store water.
Transmissivity values obtained in the current study were within the range of 0.3 to 19.7 m2/day obtained by Ishaku et al. (Citation2009) for the basement aquifers in Taraba State, Nigeria. Mean transmissivity value of 15.6 m2/day from a sample of 339 boreholes from Soutpansberg, which is within the vicinity of the study area, was obtained in a study by Holland (Citation2012). This may be because Holland (Citation2012) covered a large area (63,500 km2) thereby incorporating a wider range of transmissivity values. The values for most (5 out of 7) of the boreholes were within the range of transmissivity values for crystalline basement aquifers in South Africa of 5–40 m2/day stated in Govender (Citation2019). Boreholes H27-0052 and H27-0136 had transmissivity values of 2.10 and 0.78 m2/day, respectively, which were lower than the specified range. Hydraulic conductivity values for all boreholes were within the range of values for crystalline basement aquifers in South Africa of 0.01 to 2.8 m/day specified by Govender (Citation2019). Aquifer transmissivity ranged between 0.2 m2/day and 119 m2/day (Banoeng-Yakubo et al., Citation2011), while storativity ranged between 0.003 and 0.008 (Yidana et al., Citation2013) in the crystalline aquifers of the Birimian Province in Ghana. Transmissivity values for all boreholes were within the range of values from Banoeng-Yakubo et al. (Citation2011) while storativity values for some of the boreholes were higher than the range of Yidana et al. (Citation2013). Storativity values obtained by Shamuyarira (Citation2017) in a fractured aquifer within Mhinga area South Africa ranged from 0.00038 to 0.0028, and was lower than values for boreholes H27-0138, H27-0052 and H27-0290.
Hydraulic conductivity values were within the ranges of 1 × 10⁻⁷ to 6x10⁻⁷, 6 × 10⁻⁷ to 2 × 10⁻⁶ and 2 × 10⁻⁶ to 6 × 10⁻⁷ m/s which have been classified as low, moderate and medium, respectively, by Quiñones-Rozo (Citation2010). Majority of boreholes (H27-0002, H27-0138, H27-0165 and H27-0168 had medium hydraulic counductivity values. Hydraulic conductivity values H27-0136 while those of H27-0052 and H27-0290 were low and moderate, respectively. Transmissivity values for H27-0136 and H27-0002, H27-0052, H27-0138, H27-0168 and H27-0290 were classified as very low and low as they were within the ranges of 0.1–1 and 1–10 m2/day, respectively, following Krasny (Citation1993) classification. The transmissivity for borehole H27-0165, however, falls in the intermediate classification category by Krasny (Citation1993). Transmissivity describes the general ability of an aquifer to transmit water over the entire saturated thickness, while hydraulic conductivity measures this ability by unit area (Kumar et al., Citation2016). The transmissivity and hydraulic conductivity values obtained in this study therefore indicate that the aquifer in the study area mostly has low ability to transmit water through its entire thickness while the ability to transmit water per unit area of the aquifer was mostly medium, low and moderate hydraulic conductivities
6. Conclusion
This study set out to identify the hydraulic characteristics of a fractured crystalline basement aquifer and assess their influence on the groundwater storage potential in Nzhelele, Limpopo Province, South Africa. The conclusions from the study are as follows:
The modelling of drawdown for majority of the boreholes achieved close agreement with the measured drawdowns and performance measures MAE, RMSE and R were mostly acceptable and comparable with those of related studies. The identified aquifer test solutions can therefore aid in estimation of hydraulic characteristics of the study area.
The findings of the study indicated that the geologic environment where groundwater is stored is heterogeneous and is characterised by leaky aquifer (semi-confined conditions), double porosity aquifer (matrix blocks and fractures) and single fracture aquifer, though leaky aquifer is dominant.
Hydraulic characteristics indicated that storage potential of the aquifer in the study area varied from low to high. High storage potential was associated with boreholes located within the vicinity of faults. The aquifer’s ability to transmit water through its entire thickness was, however, mostly low.
Derivative curves showed the presence of fracture dewatering, which means that risks such as drying of boreholes and surface water resources, subsidence, and fracture and borehole clogging exist in the study area.
Since the study area has limited groundwater storage potential, low ability to transmit water and is susceptible to fracture dewatering, groundwater use should be monitored and managed effectively to avoid fracture dewatering and its associated risks.
Acknowledgements
VSA Leboa Consulting Pty Ltd is acknowledged for providing pumping test data used in the study.
Additional information
Funding
Notes on contributors
R. Makungo
Rachel Makungo is a Senior Lecturer in the Department of Hydrology and Water Resources, University of Venda, South Africa. She holds a PhD in Environmental Sciences (Hydrology). She specialises in surface water and groundwater hydrology including water resource systems analysis, water quality, monitoring and modelling, and links to climate change adaptation.
John Ogony Odiyo is an adjunct Professor in the Department of Hydrology and Water Resources, University of Venda and DVC Research, Innovation, Commercialisation and Internationalisation at Vaal University of Technology, South Africa. He holds a PhD in Civil Engineering (Water Specialisation). His research transcends in hydrological and groundwater modelling, water/wastewater pollution and remediation, water systems analysis and water supply.
John Ndiritu is an Associate Professor in the School of Civil and Environmental Engineering of the University of the Witwatersrand. He holds a PhD in Civil Engineering (Water Resources). He specialises in water resource systems modelling and optimization and the application of non-parametric statistical approaches in dealing with hydrologic uncertainties.
References
- Adeniji, A. E., Ajala, A., & Osho, J. K. (2017). Estimation of groundwater potential using surficial resistivity measurements: A case study from parts of Makurdi Benue State Nigeria. Global Journal of Pure and Applied Sciences, 23(2), 311–17. https://doi.org/10.4314/gjpas.v23i2.11
- Akanbi, O. A., & Tijani, M. N. (2020). Sustainability and conceptual groundwater hydraulic models of basement aquifers. Materials and Geoenvironment, 66(2), 87–98. https://doi.org/10.2478/rmzmag-2019-0016
- Alzraiee, A. H., Baú, D., & Elhaddad, A. (2014). Estimation of heterogeneous aquifer parameters using centralized and decentralized fusion of hydraulic tomography data. Hydrology and Earth System Sciences, 18(8), 3207–3223. https://doi.org/10.5194/hess-18-3207-2014
- Ashton, P., Love, D., Mahachi, H., & Dirks, P. (2001) An overview of the impacts of mining and mineral processing operations on water resources and water quality in the Zambezi, Limpopo and Olifants catchments in Southern Africa, MMSD Southern Africa Research Reports, Report No. ENV-P-C 2001–042 336 pp.
- Badmus, B. S., & Olatinsu, O. B. (2010). Aquifer characteristics and groundwater recharge pattern in a typical basement complex, Southwestern Nigeria. African Journal of Environmental Science and Technology, 4(6), 328–342. https://doi.org/10.5897/AJEST09.214
- Baiocchi, A., Dragoni, W., Lotti, F., & Piscopo, V. (2014). Sustainable yield of fractured rock aquifers: The case of crystalline rocks of Serre Massif (Calabria, southern Italy), Chapter 5. In J. M. Sharp (Ed.), Fractured rock hydrogeology (pp. 79–96). CRC Press/Balkema.
- Banoeng-Yakubo, B., Yidana, S. M., Ajayi, J. O., Loh, Y., & Asiedu, D. (2011). Hydrogeology and groundwater resources of Ghana: A review of the hydrogeology and hydrochemistry of Ghana. In J. L. McMann (Ed.), Potable Water and Sanitation (Vol. 142). Nova Science Publishers. 77-114.
- Bateni, S. M., Mortazavi-Naeini, M., Ataie-Ashtiani, B., Jeng, D. S., & Khanbilvardi, R. (2015). Evaluation of methods for estimating aquifer hydraulic parameters. Applied Soft Computing, 28, 541–549. https://doi.org/10.1016/j.asoc.2014.12.022
- Bejaichund, M., Kijko, A., & Durrheim, R. (2009). Seismotectonic models for South Africa: Synthesis of geoscientific information, problems, and the way forward. Seismological Research Letters, 80, 33–65.
- Braune, E., & Mutheiwana, S. (2009). Towards sustainable utilization of basement aquifers in southern Africa. In R. TituS, H. Beekman, & L. Strachan (Eds.), The basement aquifers of southern Africa, WRC report no. TT 428–09 Water Research Commission. (pp. 183).
- Bumby, A. J., Eriksson, P. G., van der Merwe, R. and Steyn, G. L. (2002) A half-graben setting for the Proterozoic Soutpansberg Group (South Africa): evidence from the Blouberg area. Sedimentary Geology,147(1–2), 37–56.
- Daddi, G. D. (2015). Aquifers developed on basement rocks of Ethiopia: Their genesis, properties and classification. Doctoral dissertation, University Addis Ababa.
- Dhungel, R., & Fiedler, F. (2016). Water balance to recharge calculation: Implications for watershed management using systems dynamics approach. Hydrology, 3(1), 13. https://doi.org/10.3390/hydrology3010013.
- Dippenaar, M. (2008) Characterisation of some fractured rock aquifers in Limpopo Province, South Africa: Review and case study, MSc Thesis, University of Pretoria.
- Du Toit, W., Holland, M., Weidemann, R., & Botha, F. (2012). Can groundwater be successfully implemented as a bulk water resource within rural Limpopo Province? Analysis based on GRIP datasets. Water SA, 38(3), 391–398. https://doi.org/10.4314/wsa.v38i3.4
- Du Toit, W. H., Mulin, H., & Jonck, F. (2002). 1:500 000 Hydrogeological map series of the Republic of South Africa, Messina 2230 (1st ed.). DWAF.
- Duffield, G. M. (2007). Aqtesolv user guide Version 4.5 ( pp. 529). HydroSOLVE, Inc.
- Fan, Y., Hu, L., Wang, H., & Liu, X. (2020). Machine learning methods for improved understanding of a pumping test in heterogeneous aquifers. Water, 12(5), 1342. https://doi.org/10.3390/w12051342
- Govender, N. (2019). Characterisation of the deep aquifers of South Africa-the bushveld igneous complex, crystalline basement rocks and dolomite formations. Doctoral dissertation, University of the Free State.
- Gross, E. L. (2008) Manual pumping test method for characterizing the productivity of drilled wells equipped with rope pumps, Master’s Thesis, Michigan Technological University.
- Halford, K. J., & Kuniansky, E. L. (2002) Documentation of spreadsheets for the analysis of aquifer-test and slug-test data: U.S. Geological Survey Open-File Report 02–197, 51 pp.
- Hall, P., & Chen, J. (1996). Water well and aquifer test analysis ( pp. 412). Water Resources Publication.
- Hammond, P., & Field, M. S. (2014). Reinterpretation of historic aquifer tests of two hydraulically fractured wells by application of inverse analysis, derivative analysis, and diagnostic plots. Journal of Water Resource and Protection, 6(5), 481–506. https://doi.org/10.4236/jwarp.2014.65048
- Hammond, P. A. (2018). Reliable yields of public water-supply wells in the fractured-rock aquifers of central Maryland, USA. Hydrogeology Journal, 26(1), 333–349. https://doi.org/10.1007/s10040-017-1639-4
- Hemker, K., & Randall, J. (2013). Modelling with MLU, applying the multilayer approach to aquifer test analysis ( pp. 66). https://www.microfem.com/download/mlu-tutorial.pdf
- Holland, M. (2011). Hydrogeological characterisation of crystalline basement aquifers within the Limpopo Province, South Africa. University of Pretoria.
- Holland, M. (2012). Evaluation of factors influencing transmissivity in fractured hard-rock aquifers of the Limpopo Province. Water SA, 38(3), 379–390. https://doi.org/10.4314/wsa.v38i3.3
- Howard, K. W., & Karundu, J. (1992). Constraints on the exploitation of basement aquifers in East Africa-water balance implications and the role of the regolith. Journal of Hydrology, 139(1–4), 183–196. https://doi.org/10.1016/0022-1694(92)90201-6
- Ige, O. O., Obasaju, D. O., Baiyegunhi, C., Ogunsanwo, O., & Baiyegunhi, T. L. (2018). Evaluation of aquifer hydraulic characteristics using geoelectrical sounding, pumping and laboratory tests: A case study of Lokoja and Patti Formations, Southern Bida Basin, Nigeria. Open Geosciences, 10(1), 807–820. https://doi.org/10.1515/geo-2018-0063
- Ishaku, J. M., Kwada, I. A., & Adekeye, J. I. D. (2009). Hydrogeological characterization and water supply potential of basement aquifers in Taraba State, N.E. Nigeria. Nature and Science, 7(3), 75–83. http://www.sciencepub.net/nature/0703/12_0629_ISHAKU_RECENT_ns.pdf
- Jayawardena, U. S., & Sarathchandra, M. J. (1995). Land subsidence and other environmental impacts due to groundwater extraction from fractured hard rocks in Sri Lanka. Proceedings of the Fifth International Symposium on Land Subsidence, 234( IAHS Publ), 439–444. http://hydrologie.org/redbooks/a234/iahs_234_0439.pdf
- Jeanne, P. (2012). Architectural. In petrophysical and hydromechanical properties of fault zones in fractured-porous rocks: Compared studies of a moderate and mature fault zones (France). PhD in Earth Sciences. 213 pp.
- Khadri, S. F. R., & Moharir, K. (2016). Characterization of aquifer parameter in basaltic hard rock region through pumping test methods: A case study of Man River basin in Akola and Buldhana Districts Maharashtra India. Modelling Earth Systems and Environment, 2(33), 1-18. https://doi.org/10.1007/s40808-015-0047-9.
- Khan, M. Y. A., ElKashouty, M., & Bob, M. (2020). Impact of rapid urbanization and tourism on the groundwater quality in Al Madinah city, Saudi Arabia: A monitoring and modeling approach. Arabian Journal of Geosciences, 13(18), 1–22. https://doi.org/10.1007/s12517-020-05906-6
- Krasny, J. (1993). Classification of transmissivity magnitude and variation. Ground Water, 31(2), 230–236. https://doi.org/10.1111/j.1745-6584.1993.tb01815.x
- Kresic, N. (2006). Hydrogeology and groundwater modelling (2nd ed., pp. 828). CRC Press.
- Kruseman, G. P., & De Ridder, N. A. (2000). Analysis and evaluation of pumping test data. In International Institute for Land Reclamation and Improvement, (Vol. 47, 2nd, pp. 372). Publication no.
- Kumar, T. J. R., Balasubramanian, A., Kumar, R. S., Dushiyanthan, C., Thiruneelakandan, B., Suresh, R., Karthikeyan, K., & Davidraju, D. (2016). Assessment of groundwater potential based on aquifer properties of hard rock terrain in the Chittar–Uppodai watershed, Tamil Nadu, India. Applied Water Science, 6(2), 179–186. https://doi.org/10.1007/s13201-014-0216-4
- Kuniansky, E. L., & Bellino, J. C. (2012). Tabulated transmissivity and storage properties of the Floridan aquifer system in Florida and parts of Georgia ( pp. 37). U.S. Geological Survey Data Series 669.
- Lasher, M. (2011). Application of fluid electrical conductivity logging for fractured rock aquifer characterisation at the University of the Western Cape’s Franschhoek and Rawsonville research sites. Master of Science, University of Western Cape.
- Lee, H. B., & Kim, B.-W. (2015). Characterisation of hydraulically-active fractures in a fractured granite aquifer. Water SA, 41(1), 139–148. https://doi.org/10.4314/wsa.v41i1.17
- Li, W., Nowak, V., & Cirpka, O. A. (2005). Geostatistical inverse modeling of transient pumping tests using temporal moments of drawdown. Water Resources Research, 41(8), W08403. https://doi.org/10.1029/2004WR003874.
- Mace, R. E., & Smyth, R. C. (2003) Hydraulic properties of the Carrizo-Wilcox Aquifer in Texas: Information for groundwater modeling, planning, and management, The University of Texas at Austin, Bureau of Economic Geology, Report of Investigations no. 269, 40 pp.
- Machiwal, D., Singh, P. K., & Yadav, K. K. (2017). Estimating aquifer properties and distributed groundwater recharge in a hard-rock catchment of Udaipur, India. Applied Water Sciences, 7(6), 3157–3172. https://doi.org/10.1007/s13201-016-0462-8
- Makungo, R. (2019) Development of risk-based groundwater operating rules: A case study of Siloam Village, South Africa, PhD Thesis, University of Venda
- Makungo, R., & Odiyo, J. O. (2017). Estimating groundwater levels using system identification models in Nzhelele and Luvuvhu areas, Limpopo Province, South Africa. Physics and Chemistry of the Earth, 100, 44–50. http://dx.doi.org/10.1016/j.pce.2017.01.019
- Makungo, R., Odiyo, J. O., Ndiritu, J. G., & Mwaka, B. (2010). Rainfall runoff modelling approach for ungauged catchments: A case study of Nzhelele River sub-quaternary catchment. Physics and Chemistry of the Earth, 35(13–14), 596–607. https://doi.org/10.1016/j.pce.2010.08.001
- Moharir, K., Pande, C., & Patil, S. (2017). Inverse modelling of aquifer parameters in basaltic rock with the help of pumping test method using MODFLOW software. Geoscience Frontiers, 1–13. https://doi.org/10.1016/j.gsf.2016.11.017
- Morel, E. H., & Wikramaratna, R. S. (1982). Numerical modelling of groundwater flow in regional aquifers dissected by dykes. Hydrological Sciences Journal, 27(1), 63–77. https://doi.org/10.1080/02626668209491086
- Moustafa, M. H. (2011). Application of derivative analysis technique for pumping test interpretation, coastal aquifer, Sharm El Sheikh Area, Egypt. JPME, 14(2), 53–65. http://srv5.eulc.edu.eg/eulc_v5/Libraries/UploadFiles/DownLoadFile.aspx
- Naderi, M. (2019). Estimating confined aquifer parameters using a simple derivative-based method. Heliyon, 5(10), e02657. https://doi.org/10.1016/j.heliyon.2019.e02657
- Naderi, M., & Gupta, H. V. (2020). On the reliability of variable‐rate pumping test results: Sensitivity to information content of the recorded data. Water Resources Research, 56(5), e2019WR026961. https://doi.org/10.1029/2019WR026961
- Nyende, J., Van Tonder, G., & Vermeulen, J. (2016). Characterisation of weathered and granitised fractured bedrock aquifer based on WISH and FC methods. International Journal for Research in Agricultural Research, 2(1), 8–23. https://gnpublication.org/index.php/afs/article/download/346/338/
- Onipe, T. O. (2018). Geogenic fluoride source in groundwater: a case study of Siloam Village, Limpopo Province, South Africa, Masters dissertation, University of Venda, South Africa.
- Pietersen, K., Titus, R., & Cobbing, J. (2009) Effective groundwater management in Namaqualand: Sustaining supplies, WRC Report No. TT 418/09, Water Research Commission 31.
- Quiñones-Rozo, C. (2010). Lugeon test interpretation, revisited. In Collaborative management of integrated watersheds (pp. 405–414). US Society of Dams, 30th Annual Conference.
- Renard, P., Glenz, D., & Mejias, M. (2009). Understanding diagnostic plots for well-test interpretation. Hydrogeology Journal, 17(3), 589–600. https://doi.org/10.1007/s10040-008-0392-0
- Roques, C., Bour, O., Aquilina, L., Dewandel, B., Leray, S., Schroetter, J. M., Longuevergne, L., Le Borgne, T., Hochreutener, R., Labasque, T., & Lavenant, N. (2014). Hydrological behavior of a deep sub-vertical fault in crystalline basement and relationships with surrounding reservoirs. Journal of Hydrology, 509, 42–54. https://doi.org/10.1016/j.jhydrol.2013.11.023
- Sahin, A. U. (2016). A new parameter estimation procedure for pumping test analysis using a radial basis function collocation method. Environmental Earth Sciences, 75(3), 200. https://doi.org/10.1007/s12665-015-5079-y
- Sen, Z. (2009). Fuzzy logic and hydrological modelling ( pp. 348). CRC Press.
- Senior, L. S., & Goode, D. J. (1999) Groundwater system, estimation of aquifer hydraulic properties, and effects of pumping on groundwater flow in triassic sedimentary rocks in and near Lansdale, Pennsylvania, Water-Resources Investigations Report 99–4228. US Geological Survey.
- Shamuyarira, K. K. (2017). Determination of recharge and groundwater potential zones in Mhinga area, South Africa. Masters dissertation, University of Venda.
- Singh, J., Knapp, H. V., & Demissie, M. (2004) Hydrologic modeling of the Iroquois River Watershed using HSPF and SWAT. Illinois State Water Survey Contract Report 2004–08. Illinois Department of Natural Resources and Illinois State Geological Survey.
- Singhal, B. B. S., & Gupta, R. P. (2010). Applied hydrogeology of fractured rocks (2nd Ed ed., pp. 408). Springer.
- Taher, L. S. B. (2021). Implementation of AQTESOLV software for analyzing single well pumping test recovery data (Tazerbo Wellfield GMMP, Libya–As a case study). Albahit Journal of Applied Sciences, 2(1), 54–60. https://www.bibliomed.org/?mno=50688
- Van Tonder, G., Bardenhagen, I., Riemann, K., Van Bosch, J., Dzanga, P., & Xu, Y. (2002) Manual on pumping test analysis in fractured rock aquifers, WRC Report No III6/1/02, Water Research Commission 228 pp.
- Viaroli, S., Lotti, F., Mastrorillo, L., Paolucci, V., & Mazza, R. (2019). Simplified two-dimensional modelling to constrain the deep groundwater contribution in a complex mineral water mixing area, Riardo Plain, southern Italy. Hydrogeology Journal, 27(4), 1459–1478. https://doi.org/10.1007/s10040-018-1910-3
- Wang, J. Z., Wang, X. S., Li, Q. B., & Wan, W. F. (2020). Analytical solutions for steady-state multiwell aquifer tests in rectangular aquifers by using double fourier transform: A case study in the Ordos Plateau. Geofluids.
- Watson, I., & Burnett, A. D. (1995). Hydrology: An environmental approach ( pp. 722). CRC Press.
- Yang, X. (2020) Application and comparison of different methods for aquifer test analysis using TTim, Master Thesis, Delft University of Technology, 105 pp.
- Yeh, H. D., & Huang, Y. C. (2009). Analysis of pumping test data for determining unconfined-aquifer parameters: Composite analysis or not? Hydrogeology Journal, 17(5), 1133–1147. https://doi.org/10.1007/s10040-008-0413-z
- Yidana, S. M., Fynn, O. F., Chegbeleh, L. P., Nude, P. M., & Asiedu, D. K. (2013). Hydrogeological conditions of a crystalline aquifer: Simulation of optimal abstraction rates under scenarios of reduced recharge. The Scientific World Journal, 2013, 1–8. https://doi.org/10.1155/2013/606375