
 ?Mathematical formulae have been encoded as MathML and are displayed in this HTML version using MathJax in order to improve their display. Uncheck the box to turn MathJax off. This feature requires Javascript. Click on a formula to zoom.
Abstract
Produced water (PW) exploited from the reservoir alongside oil often contains heavy metals and other impurities that are harmful to man and the environment. Most of the PW treatment technologies that have been in use for years have been reported to be ineffective in reducing some of the impurities and metal concentrations to allowable disposal levels. This study evaluated the effectiveness of four local materials combined for treating PW from Niger Delta oil fields. Orange peels (I), banana peels (II), sponge gourd (Luffa cylindrica) (III) and palm kernel fibers (IV) were washed with distilled water, sun-dried (24 hours) and oven-dried at 105 ± 5°C (3 hours, I and II), 150°C (30 minutes, III) and 80°C (3 hours, IV). They were ground into powder, sieved (150 microns, Group A) and (300 mcicrons, Group B), washed with 0.4 mol/L HNO3, filtered and rinsed with distilled water. Samples of PW were obtained from fields R, X, and Y in the Niger Delta and analyzed for heavy metals using an Atomic Absorption Spectrophotometer (AAS). The PW samples were treated with the bio-adsorbents sequentially in the adsorption column for over 7 hours. Langmuir and Freundlich models were used to evaluate the samples and the Data was analyzed based on regression method. The 150 micron size of sample R, lead (Pb), cadmium (Cd), copper (Cu), and chromium (Cr) were completely (100%) adsorbed from the PW after 8 hours of treatment while other metals (Ni, Fe, Mg, Zn, Mn, Ca, Ar, B, Sn, Ba) were found to be 86.11%, 90.76%, 39.25%, 94.40%, 43.55%, 99.26%, 54.62%, 44.53%, 84.52%, and 47.37%, respectively. while the reduction in 300 micron size were 23.48% for Pb, 80.20% for Ni, 71.42% for Cd, 19.73%, for Cu. 43.65% for Fe, 34.79% for Mg, 12.67% for Cr, 88.8% for Zn, 35.48% for Mn, 98.95% for Ca, 23.01% for Ar, 44.52% for B, 14.83% for Sn and 23.68% for Ba, respectively. The finer adsorbent with large surface area was more effective. Similar results were obtained for PW samples from the other fields. Sequential mixture of the bio-adsorbents selected proved valuable in the treatment of contaminants in PW from Niger Delta oil fields.
PUBLIC INTEREST STATEMENT
Produced water is often disposed from production platforms, both onshore and offshore and could be very detrimental to the water-body it has been disposed to. The practice is to often treat this produced water before disposal, to avoid public health related issues for acquatic animals and also to human beings that could use the water from associated water bodies where the produced water has been disposed. This paper “Treatment of Produced Water from Niger Delta Oil Fields using Sequential Mixture of Bio-adsorbents” evaluated the treatment of the produced water using a sequential mixture of Bio-adsorbents to ensure treatment of metals from the produced water and prevent contamination of water bodies.
1. Introduction
1.1. Background of the study
In the early days of crude oil extraction from the subsurface, little or no effort was made in handling produced water (PW). In some situations, it was discharged to water bodies with little or no form of treatment, spilled on ground surface, or placed in underground pits to evaporate or soak into the subsurface. As time went on, petroleum engineers realized that water injection into the oil reservoirs could enhance production (Jerry, 2002).
PW from oil and gas production operations is the most prominent waste in the industry. PW varies in quality as well as quantity. At times, the water can be an important by-product or even a marketable product. The water at times is considered a waste, but the industry is getting to know that this waste water is a source of profit. Considering PW as either a waste or commodity has its cost implication, which needs to be managed in-accordance with the specific objectives of each production project and also depending on the region. If this is not well addressed, the life of the well could be adversely affected, thereby leading to good recoverable reserves being left underground. Industry practice on handling PW must also protect the environment or the operator could be fined by regulatory authorities. The methodology for handling PW depends on the content of the water, the location of the asset in consideration, the volume of reserves and the facilities available in the asset (Jerry, 2002).
1.2. Produced water composition
The composition of PWs varies. This could be as a result of different formation characteristics, reservoir compositions, and other activities engaged by industries as a result of well maintenance and development. PW constituents are made up of two groups (organic and inorganic compounds). Inorganic constituents are either insoluble (examples are grit, inorganic scales, as well as precipitates and others) and soluble. Soluble salts are divided into cations and anions, and examples of cations present in the water are monovalent cations of potassium as well as that of sodium and the multivalent cations of lead, iron, and others. Most anions present are bicarbonate, sulphate, chlorides, and carbonate. Silicate (H4Si02) and Borate (H3B03), etc. are also present as none-charged soluble inorganic species.
Generally, PWs have pH range between 6 and 8 (Kulthanan, 2013). Buffering is made available mostly by using bicarbonate. Normally the acidity (pH) of PW is always neutral unless sodium hydroxide or acidic solution is added during treatment.
Treatment is required in most cases in order to ensure conformance with beneficial effluent use standards; in most of the applications, the major pressing wastewater treatment needs includes one or more of the following:
Removal of oil and grease.
Reduction of TDS in PW.
Reduction in concentration of Benzene.
Reduction in concentration of biological oxygen demand (BOD) emanating from soluble organics.
Suspended solids control
Reduction in the volumes of brine required in disposal.
Regulation of total and fecal organisms in final wastewater stream.
Elimination of metals like boron to allow the stream to be used in areas like irrigation.
In the handling and treatment of PW generated onshore and offshore in the past years, the main four items in the list above have been of highest priority as objectives in PW treatment. As focus is channeled towards development of PW as a source for beneficial use of water supplies, the last four items in this list will continue to gain importance (Abdullah, et al., 2009).
1.3. Sources of heavy metals and toxicity in produced water
Heavy metals occur naturally on earth and possess some known properties such as persistence, highly toxic and also functioning as pollutants that are non-bio-degradable when they aggregate in the ecosystem. Based on previous studies, heavy metals are applied to a group of metals and mettaloids having atomic density greater than 4 g/cm3 or 5 times or more and are greater than water. Heavy metals are divided into three grouped, toxic metal which include Hg, Cr, Pb, Zn, Cu, Ni, Cd, As, Co, Sn, etc, precious metals such as Pd, Pt, Ag, Au, Ru, etc, and radionuclides such as U, Th, Ra, Am, etc. (Tchounwou, 2012).
Heavy metals in PW could come from formation water, aquifer as well as from oil (crude oil) if the crude oil is saturated with water. Heavy metals sources that penetrate into the water system can derive from both natural and anthropogenic sources. The major source of heavy metal contamination includes industrial waste, waste from animals, mining activities, as well as agricultural chemicals. Sometimes various industrial waste water containing heavy metals are known to contaminate the water system. Acid rain as well works on soils, break them down, and the rocks, releasing heavy metals into water bodies.
Heavy metals present in the environment results to some environmental issues such as damaging our ecosystems due to its large accumulation. For example, Nickel cause’s serious kidney and lung distress. Lead when in excess in the system can also cause damage to the kidney, liver and reproductive system as well. Anemia, insomnia, headache, dizziness irritability, hallucination, renal problems, etc. are mostly the toxic symptoms of nickel. Heavy metals coming from mining activities will pollute the environment as well as underground water sources. Hence, the need to explore new treatment technologies to handle these impurities (Beidokhti et al., Citation2019); (Nkansah et al., Citation2019). This important in order to reduce potential soil pollution and a spike in the rate of pollution when mining wastes and other materials are disposed carelessly in the environment. When soils are contaminated, these unfriendly metals are absorbed by plants and eventually accumulate in their tissues and organs. Animals that feed on such contaminated plants and drink contaminated waters, as well as marine lives that thrive in heavy metal polluted waters also accumulate such metals in their systems and this can cause adverse effect (Tchounwou, 2012).
2. Dehydration/treating processes of crude oil
The method of processing crude oil for the removal of water content with it varies according to how water is found with the crude oil. Removal of free-water is done first in the processing, followed by the separation of emulsified water along with some other contaminants like sand, and other sediments. The procedures for processing wet crude oils are illustrated in .
Figure 1. Basic approach of handling wet crude oil. (F.W. = fresh water, SS.W. = suspended water, E.W. = emulsified water) (Abdel-Aal et al., Citation2003)
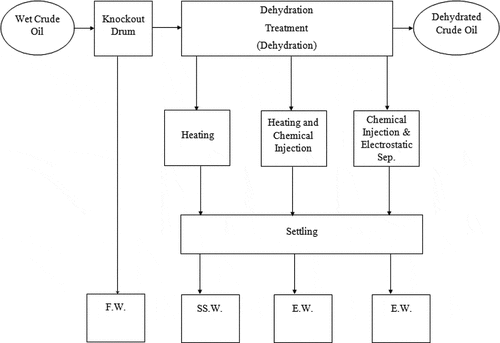
Economically, removal of free water at the beginning will bring down the size of the treatment system, hence its cost. The same is applicable for the removal of associated natural gas from oil in the gas–oil separator plant (GOSP). A dehydration system generally comprised of various types of equipment and most commonly are the following:
Free-water knockout vessel
Wash tank
Gun barrel
Flow treater (heater/treater)
Chemical/Injector
Electrostatic dehydrator
2.1. Options available for managing produced water
In managing PW, some of the methods in use by the oil and gas operators are (Arthur, 2005):
Prevent the production of water unto surface facility—using separators downhole which separate water from gas and oil stream and re-inject it into suitable formation. Also, polymer gels can be used to block fissures that contribute towards PW. PPW is eliminated via this method and it is an attractive strategy, however it is not always possible.
Injection of PW—involving re-injection of same water inside the same formation or other suitable formation; involves the conveyance of the water (PW) from the production site to the injection site. Processing of the PW to be injected is aimed at reducing fouling, odour and scaling agents and bacteria which may be present.
PW discharge—involves treatment and processing of PW to ensure it meets onshore or offshore discharge limit. Although, some locations do not require treatment before discharge.
Re-use of wastewater for oil and gas operations—involving the treating and processing of PW to ensure the quality needed for using it for drilling and maintenance activities.
3. Materials and method
The materials used in this research work were: PW samples from Niger delta oil fields, Luffa cylindrica (Sponge gourds), Banana peels, Orange peels, Palm kernel fiber, Chemical reagents, Filter paper, Glass wares, etc.; as captured in .
Figure 2. Luffa cylindrica and palm kernel fiber
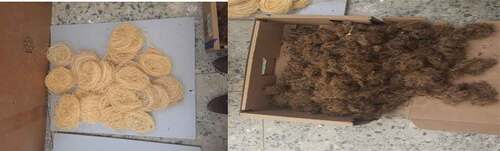
Figure 3. Banana peels and raw orange peels
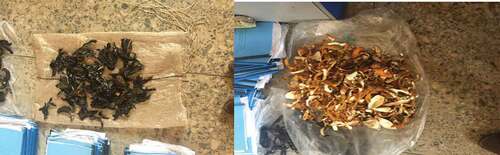
Figure 4. Produced water samples and filtrates from adsorption process
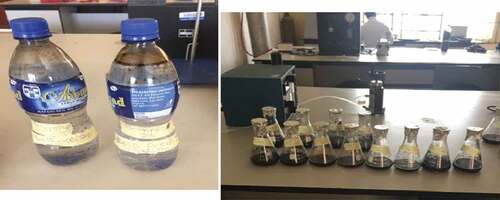
Figure 5. Atomic Absorption Spectrophotometer (AAS)
The equipment used were: Milling Machine, Adsorption column, Mechanical Shaker, Oven, Atomic Absorption Spectrophotometer (AAS), Weighing balance, pH meter, Refrigerator, Sieves, etc. The materials were thoroughly washed and dried before use to avoid any form of contamination. The equipment was also properly cleaned before use.
The heavy metals analyzed were Lead (pb), Nickel (Ni), copper (Cu), cadmium (Cd), Chromium (Cr), Zinc (Zn), Iron (Fe), Magnesium (Mg) Calcium (ca), Boron (B), Tin (Sn), Arsenic (As), Manganese (Mn), as well as Barium (Ba) and some other contaminants in the PW samples.
3.1. Collection of samples and materials
PW samples were collected from three oil fields in the Niger Delta. Sample R was collected from Imo River oil field in Rivers State; Sample X was collected from Nembe oil field in Bayelsa State, sample Y was from Kolo creek oil field in Rivers/Bayelsa State. The samples were all kept and maintained at room temperature right from the field to the laboratory where the experiments were conducted. The adsorbents (Banana peels, Orange peels, Luffa cylindrica) were purchased from a local market in Ado-Ekiti, Nigeria, and the palm-kernel fiber was collected from ABUAD farm in Ado-Ekiti, Ekiti state. Chemicals and other reagents and additives used were of analytical and standard grade.
3.2. Preparation of banana peels, orange peels, luffa cylindrica, palm kernel fiber and the experimental procedure
The adsorbents were prepared by washing them thoroughly with distilled water to remove any dirt that may be stuck on it. They were then cut into pieces; suns dried (24 hours during hammer time period), and were finally dried in an oven at 105°C for 3 hours for banana and orange peels, 150°C for 30 minutes for luffa cylindrica, and 80°C for 3 hours for palm kernel fiber. The essence of sun drying is to remove moisture content while oven drying is to remove any form of adsorbed gas on the surface of the adsorbents. This is to ensure clean treated PW. The adsorbents were finally milled with the aid of a milling machine and sieved into 150 and 300 microns sizes.
3.2.1. Sequential mixture of the adsorbents in the adsorption column
The adsorption chamber is made up of four columns where the adsorbents were packed individually. The next stage of the experiment was carried out by packing 8-gram (150 microns) each on the four columns with banana peels, orange peels, palm kernel fiber and luffa cylindrica in that order, and 250 ml of sample R (PW) was flown through the first column to the last column, and the filtrate was collected at the last column at an interval of two hours and was subjected to analysis using the Atomic Absorption Spectrometer. The same procedure was repeated for sample X and Y, respectively, and the filtrates were analyzed as well. The columns were replaced with 300 microns of each of the adsorbents and the process was repeated for the three samples and the filtrates obtained at two hours intervals were analyzed as well. The experiments were carried out at room temperature and time was the major parameter (factor) put into consideration. This was done to check the level of reduction of metal ions concentrations after the chosen time intervals.
4. Results and discussion
is a plot of the concentration of Pb, Ni, Cd, and Cu (mg/l) against time (hours) for particles size of 150 micron. The plots are linear with negative slopes. From the result () and plots, it shows that the concentration of the metals decreased with increase in time. After 8 hours of treatment, it was observed that there were no traces of cadmium (Cd), chromium (Cr), lead (Pb), and copper (Cu). This shows that the adsorbents were good in the treatment as they were able to remove entirely the traces of the four metals mentioned above from the PW. Other metals (Fe, Mg, Cr, Zn, Mn, Ca, Ar, B, Sn, Ba) were also removed to the expected levels by the adsorbents. Fe, Mg, Zn, Mn, Ca, Ar, B, Sn, Ba were reduced from 0.552, 3.699, 0.125, 0.062, 430, 4.65, 1.59, 0.155 and 0.038 (mg/l) to 0.051, 2.247, 0.007, 0.035, 3.20, 2.110, 0.882, 0.024 and 0.020 (mg/l) respectively. The reduction in concentration of other metals is given in . The result reviewed that the arrangement of the adsorbents in the adsorption plant as described above gives a good result with a particle size of 150 micron.
Figure 6. Plot of concentration of Pb, Ni, Cd, Cu vs time (Sample R, 150 micron size)
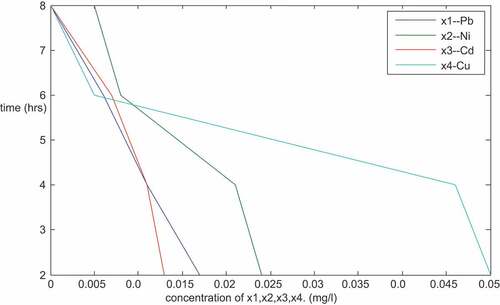
Table 1. Result of the sequential mixture of the adsorbents (sample R- Imo River, 150 micron)
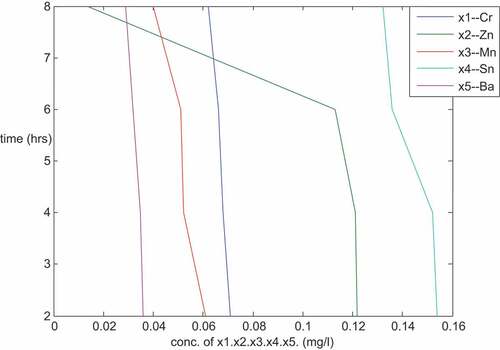
is a plot of the concentration of Cr, Zn, Mn, Sn and Ba against time with a particle size of 300 micron from the same sample R using same adsorbents arrangement in the plant as described above. The same nature of plots as in was obtained. It was linear plots with negative slopes showing that there is a strong relationship among the dependent and the independent variables. The plots reviewed that the concentrations of the metals under investigation decrease with increase in time. The metal concentrations Pb, Ni, Cd, Cu, Fe, Mg, Cr, Zn, Mn, Ca, Ar, B, Sn and Ba (from , both the plotted and none plotted on the graph) decreased from 0.132, 0.036, 0.014, 0.076, 0.552, 3.699, 0.071, 0.125, 0.062, 430, 4.65, 1.59, 0.155 and 0.038 (mg/l) to 0.101, 0.071, 0.004, 0.061, 0.311, 2.412, 0.062, 0.014, 0.040, 4.5, 3.58, 1.371, 0.132 and 0.029 (mg/l), respectively. The reductions from 300 micron particle size reviewed that the adsorbents did a good job in the treatment of PW as the adsorbents were able to reduce the concentration of the metals to an appreciable limit. The 150 micron particle size as described above gives a better result when compared with that of 300 micron particle size; this is as a result of large surface area of 150 micron size.
Figure 7. Plot of concentration of Cr, Zn, Mn, Sn,Ba vs time (Sample R, 300 micron size)
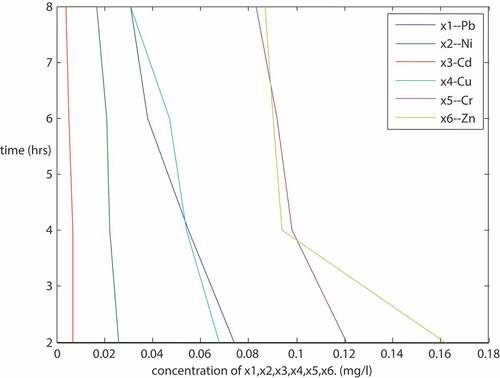
is a plot of the concentration of Pb, Ni, Cd, Cu and Cr (mg/l) against time (hours) for particle size of 150 micron. The plot follows the trend of the previous ones plotted in the sense that it’s linear with negative slopes. From the result () and the plots, it shows that the concentration of the metals decreased with increase in time. After 8 hours of treatment, it was observed that there were no traces of lead (Pb) and Copper (Cu). This shows that the adsorbents with particle size of 150 microns were good especially for lead and copper as they were able to remove the two metals completely from the PW sample. The concentration of other metals were as well positively affected as shown, Ni, Cd, Fe, Mg, Cr, Zn, Mn, Ca, Ar, B, Sn and Ba () decrease from 0.026, 0.007, 0.783, 5.106, 0.121, 0.163, 0.071, 390, 5.544, 2.151, 0.144 and 0.045 (mg/l) to 0.014, 0.003, 0.003, 3.200, 0.077, 0.047, 0.028, 4.2, 3.202, 1.120, 0.030 and 0.020 (mg/l), respectively.
Figure 8. Plot of conc. of Pb, Ni, Cd, Cu, Cr vs time (Sample X, 150 micron size)
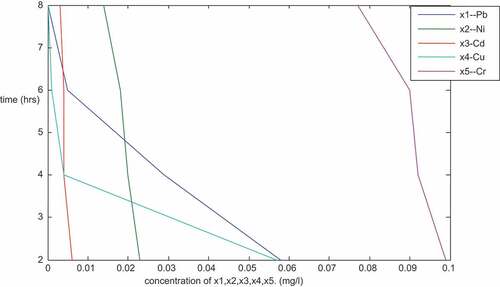
Table 2. Result of the sequential mixture of the adsorbents (Sample X—Nembe)
is also a plot of some of the metal concentrations against time. The metals are Pb, Ni, Cd, Cu, Cr, and Zn, with a particle size of 300 micron for the same sample X using same adsorbents arrangement on the plant as described above. The same nature of plot as in Figure 1.7 was obtained. It was a linear plot with negative slopes showing that there is a strong relationship between the dependent and the independent variable. The plot showed that the metal concentrations decrease as time increases. Unfortunately, with a particle size of 300 micron as can be seen on the result (), Pb and Cu could not be completely removed from the produced water sample unlike the particle size of 150 microns. It goes to show that particle size matters a lot when using the adsorbents. The finer the size of the particle, the more the surface area, and the better the result.
Figure 9. Plot of conc. of Pb,Ni,Cd,Cu,Cr,Zn vs time (Sample X, 300 micron size)
The metal concentrations (Pb, Ni, Cd, Cu, Fe, Mg, Cr, Zn, Mn, Ca, Ar, B, Sn and Ba () decreased from 0.078, 0.026, 0.007, 0.07, 0.783, 5.106, 0.121, 0.163, 0.071, 390, 5.544, 2.151, 0.144 and 0.045 (mg/l) to 0.031, 0.017, 0.004, 0.031, 0.014, 1.601, 0.083, 0.087, 0.031, 2.5, 3.923, 1.894, 0.121 and 0.031 (mg/l), respectively.
are the plots of some of the metals analyzed against time. is a plot of the concentration of Pb, Ni, Cu, Cr, Mn and Ba (mg/l) against time (hrs) for particle size of 150 micron from sample Y. is a plot of concentration of Pb, Ni, Cu, Cr, Zn and Ba against time for particle size of 300 micron from same sample Y. Both plots are linear with negative slopes. From the result () and the plots, it shows that the concentration of the metals decreased with increase in time ().
Figure 10. Plot of conc. of Pb, Ni, Cu,Cr, Mn, Ba vs time (Sample Y,150 micron size)
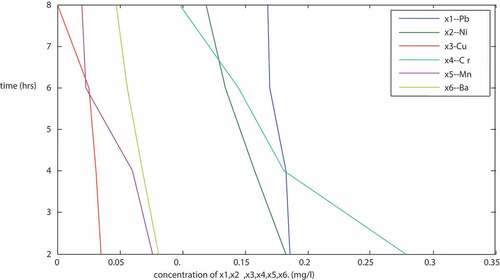
Figure 11. Plot of conc. of Pb, Ni, Cu, Cr, Zn, Ba vs time (Sample Y, 300 micron size)
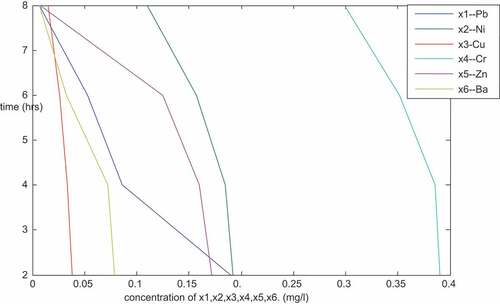
Table 3. Result of the sequential mixture of the adsorbents (Sample Y—Kolo creek)
Table 4. Analysis of Pb (lead) using Langmuir and freundlich models for sample R
Table 5. Analysis of Ni (nickel) using Langmuir and freundlich models for sample R
Table 6. Analysis of Fe (iron) using Langmuir and freundlich models for sample R
Analysis reviewed that there was no trace of Cadmium (Cd) in the sample obtained from Kolo creek oil field. This could be as a result of none Cadmium existence within the geological location. It was observed that after 8 hours of treatment using 150 micron particle size, there was no trace of Copper (Cu) left in the sample. This shows that the adsorbents with particle size of 150 microns were good especially for copper as they were able to remove the metal completely from the sample.
From with particle size of 300 micron, it was observed that after same 8 hours of treatment, some traces of copper (Cu) (0.015 ppm) was still present. This could be as a result of the particle size with smaller surface area when compared with that of 150 micron particle size. Another notable thing in was the absence of calcium (Ca) from the PW after 8 hours of treatment which was not obtained under 150 micron particle sizes. The results obtained with both particle sizes (150 and 300 micron) were all encouraging. This shows there is a great potential in using some of these low cost agricultural waste in the management of waste waters in general. gives a more detail of the results and the extent to which the toxic metals concentration in the PW sample were greatly reduced. Averagely, 150 micron particle sizes produced a better result when compared with 300 micron particle sizes. In summary, according to the results obtained from the experiments, it was observed that particle size matters a lot no matter the nature and type of material used in the treatment. The results obtained validate the outcome of literature review which says that particle size is an important parameter in adsorption process. The smaller the particle size, the more the surface area of materials and the better the adsorption process. The large surface area is able to expose the adsorption sites very well and this promotes the adsorption process. From the results, 150 micron size of particles with large surface area produced excellent results when compared with 300 micron particles with smaller surface areas.
4.1. Analysis of the results using adsorption isotherms
4.1.1. The Langmuir isotherm model
This model is used to express the relation between the amount of extracted material from the bulk of the solution and its equilibrium concentration. Langmuir model is only acceptable (valid) for monolayer adsorption on a surface. Langmuir isotherm assumes a uniform adsorption on the surface. This isotherm can be represented as:.
qe is capacity of adsorption at equilibrium in (mg/g), Ce, the equilibrium concentration (mg/l) and KL is Langmuir isotherm model constant in (ml/mg).
4.1.2. The Freundlich isotherm model
This isotherm model considers adsorption process to occur on heterogeneous surfaces; and the model further states that adsorption capacity is related to the adsorbent concentration in question. This model can be expression as:
Note KF is the model constant and 1/n is constant that expresses reaction intensity. These parameters (KF and 1/n) can be estimated graphically from the plot of experimental values and then applying this isotherm model in this form yields:
In the sequential mixture of the adsorbents, the plot of ce/qe vs ce indicates that adsorption of Pb ion is in line with the Langmuir model (). Q and b values as obtained from the plot are given on (). The coefficient of correlation (R2) was 0.9981 for Langmuir model and 0.4119 for same Pb for freundlich model (). The results indicate that the Langmuir model is good for equilibrium study for Pb. This suggests monolayer coverage of the adsorbate on the surface of the adsorbent for the metal ion. The quantity of metal ion extracted per mass of the adsorbent increases with the metal concentration and the sorption capacity is stated on (). The value of the equilibrium separation factor RL, of 0.119 () revealed that the sorption of Pb ion on the sequential mixture of the adsorbent surface was found to be a favorable process. The correlation coefficient from freundlich model (a plot of log qe vs log ce) could not give a better result, showing that freundlich sorption isotherm is not favorable for equilibrium study of Pb.
Figure 12. Analysis of Pb using Langmuir isotherm for sample R
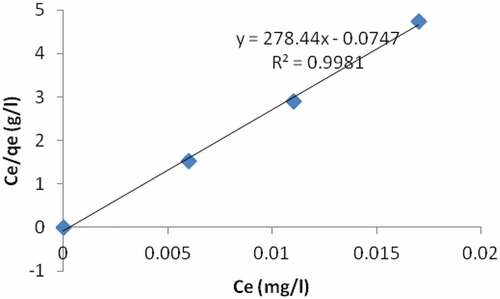
Figure 13. Analysis of Pb using Freudlich isotherm for sample R
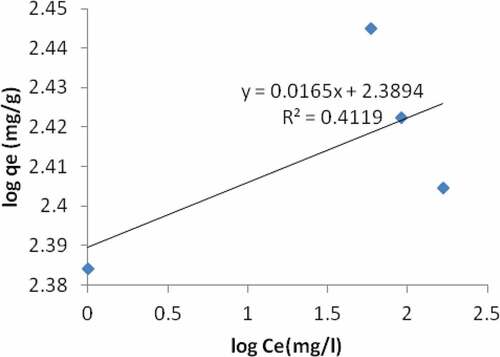
Table 7. A comparism of correlation coefficient and other parameters for sample R using the two models
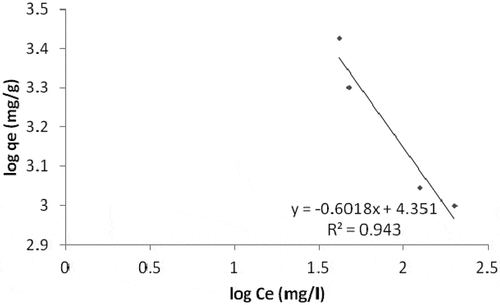
For the Ni ion adsorption, the linear plot of ce/qe vs ce indicates that adsorption obeys the Langmuir isotherm model (). The correlation coefficient (R2) was estimated to be 0.973. This shows the Langmuir sorption model is favorable for equilibrium study for Ni, and this suggests the formation of monolayer on the adsorbent surface for the metal ion. Qo, Rl and b values were obtained from the plot as shown in (). The RL value of 0.473 indicates the adsorption process was a favorable one. Freundlich isotherm model result which produced a correlation coefficient value of 0.943 () for Ni adsorption was not that good when compared with the Langmuir model. Therefore, the Langmuir isotherm model best describe the adsorption of Ni on the adsorbent surface.
Figure 14. Analysis of Ni using Langmuir isotherm for sample R
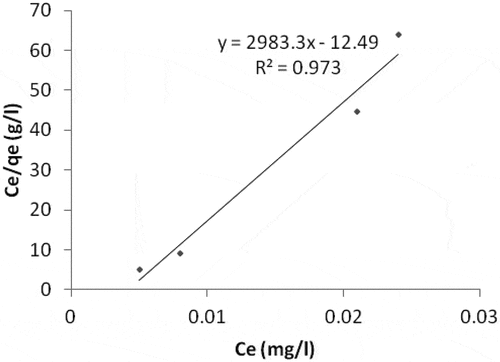
Figure 15. Analysis of Ni for using freundlich isotherm for sample R
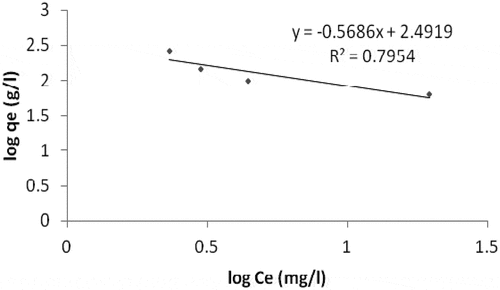
When it comes to Fe (iron) adsorption, Langmuir model gives a better result when compared with Freundlich isotherm model. The linear plot of ce/qe vs ce indicates adsorption obeys the Langmuir model (). Values of Qo, Rl and b estimated from the plot are indicated on (). Coefficient of correlation (R2) as shown on the plot was found to be 0.8326. This shows that the Langmuir model is favorable for equilibrium study of Fe compared with the value of R2 (0.7954) on the Freundlich model plot (). This suggests the formation of monolayer on the adsorbent surface for the metal ion under investigation. The separation factor (RL) with a value of 0.575 () gives the fact that the adsorption of Fe on the sorbent surface is a favorable process.
Figure 16. Analysis of Fe using Langmuir isotherm for sample R
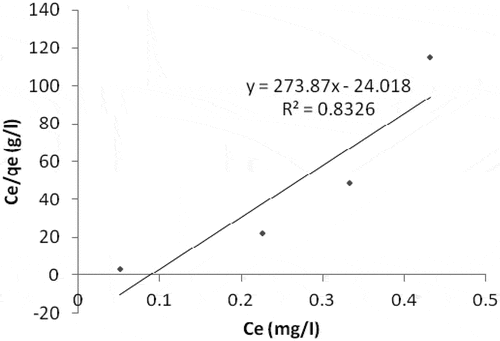
Figure 17. Analysis of Fe using Freundlich isotherm for sample R
In summary, adsorbent site could be a single uniform layer (mono layer) or it could be multiple layers (heterogeneous layer). Each of these layers whether uniform or multiple controls the adsorption for certain metals. This is the basis for Langmuir and freundlich isotherm models. A metal ion attracted by the single layer site obeys the Langmuir isotherm model while those that are attracted to multiple layers sites obey the freundlich isotherm model.
4.2. Contribution to knowledge
The study confirmed that use of selected multiple bio-adsorbents was more effective in the removal of heavy metals and other contaminants in PW than use of single adsorbents. Sequential mixture as described and used in this research was found to be more effective in the treatment than the previous publication where the adsorbents were mixed simultaneously (mixed together in a certain ratio). In sequential and simultaneous mixture, same materials (adsorbents) were used but the difference lies on the method of placement of the materials in the adsorption columns which has been describe in the methodology. The results obtained proved that no matter the type and nature of local materials used, sequential mixture would always produce a better result than any other form of mixture.
Heavy metals in the PW had different adsorption mechanisms; while some were explained by langmuir adsorption isotherm model, others were better described by the Freundlich model.
5. Conclusion
The PW samples investigated in this study were discovered to contain traces of heavy metals and other impurities. The experimental procedures used in the analysis of these metals were done with standard solutions of each metal prepared in the laboratory at room temperature. The experiments were successful; the metal concentrations before and after treatment with the bio-adsorbents were analyzed with AAS.
Before the treatment, the analysis indicated that the concentrations of most of the metals in the samples were in excess of what is expected before discharge or re-use. After the treatment using the adsorbents mixed sequentially, the concentrations of most of the metals were reduced to the expected level as observed in the adsorption with 150 micron size of sample R; with lead (Pb), cadmium (Cd), copper (Cu), and chromium (Cr) adsorbed completely (100%) from the PW after 8 hours of treatment while other metals (Ni, Fe, Mg, Zn, Mn, Ca, Ar, B, Sn, Ba) were adsorbed to 86.11%, 90.76%, 39.25%, 94.40%, 43.55%, 99.26%, 54.62%, 44.53%, 84.52%, and 47.37%, respectively, from the PW sample R. Similar observations were made with the 300 micron size of sample R. Sequential mixture of the adsorbents produced a good result when compared with individual use of the adsorbents.
Two models were employed in this research to validate the results obtained from these analyses. These models are Langmuir and freundlich models. The three metals selected for the test were lead (Pb), Nickel (Ni) and Iron (Fe). The models proved that the results obtained from the analysis were valid.
All experiments were carried out at room temperature. Much parameter was not considered except time. The temperature was not varied and attention was focused on reduction of metals concentration at room temperature at different time interval. Time as a parameter was considered most because adsorption as a process needs time to occur which could be clearly seen on the results presented.
On the bio-nature of the adsorbents, researchers reported that most agricultural wastes (example- orange peel, banana peel, luffa cylindrica, palm kernel fiber, etc.) have fibrous materials with high content of lignocelluloses (lignin, tannin, hemicelluloses and cellulose) and some other functional groups which contribute substantially to metal ion adsorption from wastewaters. These materials because of their contents as stated have good binding abilities of metal ions from wastewater. The results presented in this research proved that the adsorbents have the binding abilities.
Acknowledgements
We acknowledged the support of the laboratory staff of the Department of Petroleum Engineering,, Afe Babalola University Ado-Ekiti, Ekiti State.
Additional information
Funding
Notes on contributors

N.U Okereke
Dr. Stephen Udeagbara and the co-authors are deeply involved in produced water research and the group is particularly keen in understanding the behavior of metals contained within produced water when subjected to treatment via both simultaneous and sequential administration of a mixture of adsorbents. This particular research work evaluated the behavior of produced water treated via sequential mixture of adsorbents obtained locally within Nigeria such as: Orange peels (I), banana peels (II), sponge gourd (Luffa cylindrica (III) and palm kernel fibers (IV). The results are quite significant and have been highlighted in this current work on “Treatment of Produced Water from Niger Delta Oil Fields using Sequential Mixture of Bio-adsorbents”.
References
- Abdel-Aal, H. K., Mohamed, A., & Fahim, M. A. (2003). Petroleum and Gas Field Processing. King Fahd University of Petroleum & Minerals Dhahran.
- Aclione, A., Thyara, C. N., Mauricio, I., & Ramon, L. (2018). Produced water from oil – A review of the main treatment technologies. Journal of Environmental Chemistry, 2(1), 23–21.
- Ahalya, R., Kanamadi, D., & Ramachandra, T. V. (2005). Biosorption of Cr(VI) from Aqueous solution by the husk Bengal gram (Cicer Arientinum). Environmental Journal of Biotechnology, 8, 258–264.
- Aharoni, C., & Ungarish, M. (1977). Kinetics of activated chemisorptions, Part 2 – Theoretical model. Journal of Chemical Society, Faraday Transaction, 73, 456. https://doi.org/10.1039/f19777300456
- Ahmed, A., .,Taleb, H. I., Abdul, S. G., Mustafa, I. K., & Hussain, A., . (2016). Produced water treatment using naturally abundant pomegranate peel. Journal of Desalination and Water Treatment, 57(15), 6693–6701. https://doi.org/10.1080/19443994.2015.1010235
- Ahmet, S., & Erdal, O. (2009). The accumulation of Arsenic, Uranium, and Boron in Lemna gibba L, Exposed to secondary effluents. The Journal of Ecosystem Restoration, 35.
- Al-Anber, Z. A., & Matouq, M. A. D. (2008). Batch adsorption of cadmium ions from aqueous solution by means of olive cake. Journal of Hazardous Materials, 151(1), 194–201. https://doi.org/10.1016/j.jhazmat.2007.05.069
- Allen, J. S., & Brown, P. A. (2004). Isotherm analyses for single component and multi-component metal sorption onto lignite. Journal of Chemical Technology and Biotechnology, 62(1), 17–24. https://doi.org/10.1002/jctb.280620103
- Altundogen, H. S., Bahar, N., Mujide, B., & Tumen, F. (2007). The use of Sulphuric acid – Carbonization products of sugar beet pulp in Cr(VI) removal. Journal of Hazardous Materials, 144(1–2), 255–264. https://doi.org/10.1016/j.jhazmat.2006.10.018
- Anandh, B., Deepthi., P., Lavanya, S., & Sivaku, D. (2015). Treatment of dairy wastewater using eucalyptus wood saw dust activated carbon powder. Journal of Chemical and Pharmaceutical Sciences, 8(4), 729–733.
- Annadural, G., Juang, R. S., & Lee, J. D. (2002). Adsorption of heavy metals from wastewater using banana and orange peels. Water Science and Technology, 1, 185–190.
- Annadural, R. S., & Lee, J. D. (2012). Adsorption of heavy metals from wastewater using banana and orange peels. Water Science and Technology, 1, 185–190.
- Badr, E., Said, M., & Reda, A. (2018). Potential uses of aquatic plants for wasterwater treatment. Journal of Microbiology and Biotechnology, 2(2), 37–39.
- Beidokhti, M. Z., Naeeni, S. T. O., & AbdiGhahroudi, M. S. (2019). Biosorption of nickel (II) from aqueous solutions onto pistachio hull waste as a low-cost biosorbent. Civil Engineering Journal, 5(2), 447–457. https://doi.org/10.28991/cej-2019-03091259
- Bulut, Y., Gozubenli, N., & Aydin, H. (2007). Equilibrium and kinetics studies for adsorption of direct blue 71 from aqueous solution by wheat shells. Journal of Hazardous Materials, 144(1–2), 300–306. https://doi.org/10.1016/j.jhazmat.2006.10.027
- Casaday, A. L. 1993. Advances in floatation unit design for produced water treatment. Society of Petroleum Engineers. SPE #25472.
- Chang, J. L., & Wang. (2007). Characteristics of Zn (II) ion biosorption by saccharonmyces cerevislae. Journal of Biomedical Environmental Science, 20, 478–482.
- Gregory, K. B., Vidic, R. D., & Dzombak, D. A. (2011). Water management challenges associated with the production of shale gas by hydraulic fracturing. Elements, 7(3), 181–186. https://doi.org/10.2113/gselements.7.3.181
- Igunnu, E. T., & Chen, G. Z. (2014). Produced water treatment technologies. International Journal of Low-Carbon Technologies, 9(3), 157–177. https://doi.org/10.1093/ijlct/cts049
- Isehunwa, S. O., & Onovae, S. (2011). Evaluation of produced water discharge in the Niger-Delta.
- Nkansah, M. A., Donkoh, M., Akoto, O., & Ephraim, J. H. (2019). Preliminary studies on the use of sawdust and peanut shell powder as adsorbents for phosphorus removal from water. Emerging Science Journal, 3(1), 33–40. https://doi.org/10.28991/esj-2019-01166