
 ?Mathematical formulae have been encoded as MathML and are displayed in this HTML version using MathJax in order to improve their display. Uncheck the box to turn MathJax off. This feature requires Javascript. Click on a formula to zoom.
Abstract
This paper presents the results of a combined experimental and theoretical study of the interfacial and mechanical properties of epoxy/clay composites coatings on a mild steel substrate. This was studied using nano-indentation and Brazil Disk techniques to determine the Young’s moduli, hardness values and mode mixity characteristics of the composite coatings. The Young’s moduli of the reinforced composites comprising 1, 3, and 5 wt. % of montmorillonite clay particles are shown to improve, respectively, by about 23%, 58%, and 50% while the respective hardness values increased by about 46%, 80%, and 88%, relative to those of pristine epoxy. The measured mechanical properties have also shown to compare favorably with predictions from composite theories (rule-of-mixture and shear lag theories). The interfacial toughness between X65 steel and the epoxy/clay coatings increases with increasing mode mixity. This is associated with crack-tip shielding by crack deflection and crack bridging. The trends in the measured mode-mixity dependence of the interfacial fracture toughness values are consistent with predictions from the simplified zone, normal zone, and row models (at lower mode mixity). The insights from the observations and the measured crack profiles are incorporated into zone and row models for the estimation of crack-tip shielding. The implications of the results are discussed for the design of epoxy/clay composites with attractive combinations of mechanical properties.
PUBLIC INTEREST STATEMENT
The current work suggests that epoxy/clay composites can be designed to have attractive combinations of strength, Young’s moduli and interfacial fracture toughness between steels and epoxy/clay composite coatings. It also suggests that controlled reinforcement with the clay particles may be used to control the hardness plastic indentation resistance of clay reinforced composites. This can be achieved by the reinforcement of the epoxy matrices with clay particles with weight percentages up to about 3%. However, above this, the elastic moduli and hardness may decrease, perhaps due to the clustering of the particles, which may result in stress concentration effects, and the reduction of composite mechanical properties.
This research is important in the infrastructural industries during their fabrication and design stage because most structures are exposed to applied stresses which affects their integrity and robustness.
1. Introduction
Epoxy/clay composites have attractive combinations of mechanical and interfacial properties (Khodair et al., Citation2018) that have made them suitable for application in steel structures in oil and gas pipelines, storage tanks and structural applications (xxx, Citation2019a). They are also used extensively (xxx, Citation2019b), (Malik et al., Citation1999) as coatings for the protection of steel. Furthermore, under service conditions, the durability of epoxy/montmorillonite clay composites depends on the mechanical and tribological properties of the montmorillonite clay fillers (Chen et al., Citation2014) in epoxy composites coatings. Clay fillers have been used due to their high availability and good thermal stability, in addition to the improved mechanical and fillers properties of their composites (Jumahat et al., Citation2013) and (Jumahat et al., Citation2012).
However, epoxy coatings are prone to damage by surface stresses and indentation/wear phenomena that can occur during service (Saba et al., Citation2019), (Kalidindi & Subasri, Citation2014). Coating materials can also result due to abrasive wear phenomena (Ngasoh et al., Citation2020). Nano-indentation testing can, therefore, be used to evaluate the coating resistance and durability of clay-reinforced epoxy coatings.
Furthermore, since most epoxy/clay composite-coated or epoxy/clay composites-bonded steel structures are subjected to multi-axial loading conditions (Malik et al., Citation1999), there is therefore a need for interfacial fracture studies for interfaces between steels and epoxy/clay composites-base coatings.
Several interfacial fracture mechanics specimen geometries have been used to study the mode mixity dependence of interfacial fracture toughness (Chen et al., Citation2014). These include double cantilever beam specimen; four-point bend test specimen, Brazil-nut specimen, and indentation testing techniques (Chen et al., Citation2014). These studies have shown that the interfacial fracture toughness depends strongly on the mode mixity (Gledhill et al., Citation1978). The crack path criteria have also been shown to depend strongly on the mode mixity (Gledhill et al., Citation1978), while the crack/microstructure interactions depend on the mechanical properties of the reinforcements that are often incorporated into epoxy adhesive coatings (Kim & Nairn, Citation2000).
Unlike most interfacial fracture mechanics specimen geometries, which are often only applicable to limited ranges of mode mixity (Banks-sills & Schwartz, Citation2002), Brazil disk specimen geometries can be used to study the mode mixity dependence of interfacial fracture toughness over the complete range of mode mixity between pure mode I and pure mode II fracture (Rahbar, Wolf et al., Citation2008) . This can be achieved by controlling the angular orientations of the notches () (relative to the vertical axis). Brazil disk specimens can also be loaded simply by applying compressive vertical loads to the oriented samples with simple loading fixtures (Rahbar, Wolf et al., Citation2008). The effects of negative mode mixities may also be studied using Brazil disk specimen geometries with appropriate mode mixity mismatch (Banks-sills & Schwartz, Citation2002).
Figure 1. Schematics of Row model (a&b), Zone Model (c) and Brazil disk specimen (d). (Adapted from (Rahbar, Yang et al., Citation2008), (Hutchinson, Citation1992), (Atkinson & Smelser. et al., 1982))
Prior work on interfacial fracture between bi-material interfaces has explored ceramic/epoxy interfaces (Rahbar, Wolf et al., Citation2008) for applications in dentistry and medicine (Tong et al., Citation2012), (Rahbar, Yang et al., Citation2008), and electronics packaging (Tong et al., Citation2012). These have shown that the crack paths depend strongly on the ratio of the interfacial fracture toughness, to the interfacial energy release rate to the substrate fracture toughness, the substrate energy release rate (Gs) and the mode mixity/phase angle, ψ.
Rahbar et al. (Rahbar, Wolf et al., Citation2008) have shown that the crack path selection criteria depend on crack interactions with ceramic particles that are present in epoxy composites often used as coatings. Rahbar et al. (Rahbar, Wolf et al., Citation2008) and Tong et al. (Tong et al., Citation2012) have also shown that cracks can kink in and out of interfaces, depending on the nature of the interactions between the crack-tip plastic zones and deformation fields around the nanoparticles. These results in deflected crack profiles that leave behind regions of crack bridging ligaments and distributed micro cracks. The shielding contributions from the cracking configurations have been estimated by Rahbar et al. (Rahbar, Wolf et al., Citation2008) and Tong et al. (Tong et al., Citation2012) using zone and row models developed by Hutchinson et al. (Hutchinson, Citation1992). The zone and row models have also been used to explain the mode mixity dependence of the interfacial fracture toughness of organic electronic structures and ceramic/epoxy composite interfaces that are used in dentistry.
This paper presents the results of a combined experimental and theoretical study of the interfacial and coating mechanical properties of epoxy/clay composites coatings on a mild steel substrate. The mechanical and interfacial properties of epoxy composites coatings (reinforced with montmorillonite clay particles) are studied using nano-indentation and Brazil disk techniques which are used to determine the Young’s moduli, hardness values and the nano-wear characteristics of the composite coatings. The measured mechanical and interfacial properties are then compared with predictions from composite theories and performance criteria. The mode mixity dependence of the interfacial fracture toughness (between the epoxy/clay composite coatings and mild steel substrate) is also elucidated before discussing the implications of the current work for the design of epoxy/clay-composite coated or bonded steel structures.
2. Theory
Atkinson (Atkinson & Smelser. et al., Citation1982) has shown that the mode I and mode II stress intensity factors, KI and KII, for the Brazil disk specimen are given by:
where a is half of the crack length, the positive and negative signs correspond to the two tips, F is the applied load, t is the specimen thickness and r is the radius of the disk, while are the respective dimensionless factors for mode I and mode II. It is important to note here that the two dimensionless factors are functions of loading angle and crack size (
) (Hoerantner et al., Citation2017). The mode mixity/phase angle is given by (Orthogonal et al., Citation1968):
where L is the length for the loading mode, h is the combined thickness of the sandwich materials, ω is the phase shift due to elastic mismatch and is the Dundurs parameter. The phase shift, ω, is a function of the Dundurs parameters α, β, and
which are given in , (Orthogonal et al., Citation1968):
Table 1. Elastic mismatched parameters as adapted from (Rahbar, Yang et al., Citation2008)
where µ1 and µ2 are the shear moduli of materials 1 and 2 respectfully. Note that in the case of the epoxy/steel system, ω = −13° which falls within the range of ω = −14° to −8° expected for metal/epoxy systems (Wang & Suo, Citation1990).
The interfacial fracture toughness between the two dissimilar materials can be estimated as the energy release rate at the tip of the interfacial crack between the bilayers. The mode I and mode II energy release rates are given by (Rahbar, Yang et al., Citation2008):
where the total energy release rate () is given by:
where is the Young’s modulus, E, for plane stress conditions. In the case of plane strain,
is given by:
Finally, an effective can be determined relative to the thickness of the bilayer material structure. This is given by (Rahbar, Wolf et al., Citation2008);
where
, and
2.1. Materials and Experimental Methods`
API X65 steel pipe materials were obtained from a pipeline factory (Schebite Construction Company, Bwari, Abuja, Nigeria). Both the epoxy base and the hardener were purchased from Sigma Coatings, Amsterdamseweg, Netherlands. The Cloisite 30B (C30 B) clay particles were procured from Southern Clay Products Inc. Texas, USA. They were mixed with epoxy to obtain epoxy/clay composites with clay particle volume fractions of 1 wt%, 3 wt% and 5 wt%.
These mixtures were then stirred with a magnetic stirrer for 2.5 hours at a rate of 1500 rpm. This was done at 50°C to enable complete particle dispersion to occur. The resulting composites were then degassed in a vacuum oven for 2 minutes. The curing agent was also added and mixed with a spatula prior to degassing in the vacuum oven for 30 seconds. Pure epoxy, without the clay reinforcement was also prepared and studied as a control. The coating was formulated at a stoichiometric mixture of 2:1 base to hardener.
2.2. Nano-indentation Testing
Nano-indentation techniques were used to determine the Young’s moduli and hardness values of the coatings. Details of the techniques are summarized in (Shen et al., Citation2006). In these experiments, the Triboindenter T950 indentation system (Bruker, Minneapolis, MN, USA) was used. The indentation system was instrumented with a three-sided pyramidal diamond Berkovic indenter tip with a triangular tip radius of 20 nm and an included angle of 142.3°. The loading rate was fixed to minimized the possible strain hardening strain hardening effects on the measurements (Shen et al., Citation2006).
Furthermore, to minimize the possible creep effects, a total holding time of 2 seconds was applied. The indenter was calibrated prior to the indentation experiments, which were performed at a constant normal load of 8000 µN. The coating thickness on the X65 mild steel substrate was about 0.5 mm. The indentation tests were carried out at African University of Science and Technology, Abuja, Federal Capital Territory (FCT), Nigeria. For each sample, at least four indents were performed at different points on the surface.
The hardness values were calculated from the load–displacement curves using a method developed by Oliver and Pharr (Oliver & Pharr, Citation1992). This gives:
Fmax is the indentation load and A is the contact area.
hf is the contact depth of the indenter.
is the geometric constant for a pyramidal indenter and S is the contact stiffness of the material which can be considered as the slope of the unloading curve at the instant of peak load (Shen et al., Citation2006).
is the constant depending on the geometry of the indenter and
is the reduced Young’s modulus.
is given as 1140 GPa and
as 0.07 are the respective Young’s modulus and Poisson’s ratio of the indenter. E and
are the Young’s modulus and Poisson’s ratio of the sample.
is estimated as 0.35 for polymeric materials (Shen et al., Citation2006).
2.3. Interfacial fracture testing
The halves of the Brazil disk geometry () were machined using a Computer-Aided Machine (CAM HAAS, Worcester, Massachusett, USA) at Worcester Polytechnic Institute, Worcester, MA, USA. The resulting Brazil half disks had diameters of ~16 mm, thicknesses of ~5 mm and notch length of 1 mm. The notch tip radii were ~0.5 mm. The rectangular diametral surface of the Brazil disk halves was ground with silicon carbide paper with grit sizes between 60 and 240 µm. The ground surfaces were then cleaned with acetone. A 3 wt.% formulation of the resulting epoxy composites was used for interfacial fracture testing. This has been found in literature (for clay-reinforced composites) to give “optimum” properties in terms of the combination of high hardness, high Young’s moduli, and high strength (Systems et al., Citation2017) (Kusmono et al., Citation2013) (Khanbabaei et al., Citation2007) (Azeez et al., Citation2013). The degassed epoxy composite was dispensed onto the ground surfaces of two halves of the Brazil disks.
Table 2. Brazil Disk Specimen Geometry
The interfacial fracture toughness measurements were carried at WPI using an Instron Model 5848 servo-hydraulic mechanical testing machine (Instron, Canton, MA, USA) that was equipped with a 5 kN load cell. The notches in the Brazil nut specimens were oriented at different angles to the vertical axis, prior to compressive loading to failure under displacement control at a ramp rate of 0.001 mm/s. Both the load and displacement data were recorded during the tests that were controlled using the Bluehill Software Package (Instron, Canton, MA, USA). In this way, interfacial fracture toughness measurements were obtained for loading angles between 3° and 18°.
In selected cases, the loading of the Brazil disk specimens was stopped prior to complete interfacial fracture. This was done to enable the examination of the crack/microstructure interactions prior to the onset of catastrophic failure using a Scanning Electron Microscope (SEM) (EVO LS10, ZEISS, Massachusetts, USA.) at WPI. The sides of the specimens were coated with gold to enhance their conductivities and enable imaging in the SEM. The key features of the crack patterns were thus observed and measured, prior to incorporation into expressions for the estimation of crack-tip shielding levels from row and zone models (Tong et al., Citation2012).
After fracturing of the specimens into two halves, via Scanning Electron Microscope (SEM) and EDS analysis. The insights from the SEM and EDS analysis were used to determine the crack paths that were associated with the measured mode mixity dependence on the interfacial toughness.
3. Modeling
3.1. Rule of Mixtures and Shear Lag Models
The effect of clay particles on the Young’s moduli and strength of the epoxy/clay composites can be estimated using simple rule-of-mixture and shear lag models. The simple rule of mixture gives (Soboyejo et al., Citation1994);
and
where E is the Young’s modulus, V is the volume fraction, and subscripts c, m and f correspond to the composite, matrix and clay reinforcment. The parameter corresponds to the length efficiency factor. Furthermore, the shear lag model (Soboyejo et al., Citation1994) gives:
where X is given by:
where Ec, Em and Ef are the respective Young’s moduli of the composite, matrix and fillers; Vm and Vf are the respective volume fractions of matrix and fillers; and σc, σm and σf are the respective compressive strengths of the composite, matrix and filler; is the filler aspect ratio;
are fillers efficiency factor for stiffness and strength, and
is Poisson’s ratio of the matrix.
The aspect ratio is defined as the ratio of the dimension of the face of the platelet to its thickness.
The high aspect ratio makes the clays particles superior to all other conventional fillers or short glass fibers (BYK Additives &Instruments, Citation2013). The mechanical properties that were used to determine the parameters in equations 18 and 19 are summarized in .
Table 3. Mechanical Properties of Clay and Epoxy Used in the Analytical Modeling
3.2. Indentation Models
The indentation stress is given by the following expression (Brabazon, Citation2018) (Square, Citation2010):
where P is the indentation load and a is the contact radius. The indentation stress is also defined as the ratio of the contact radius and effective tip radius (Square, Citation2010). This is given by:
Where the effective tip radius is given by:
and
where is the indentation load, and
is the indentation depth,
is the radius of the indenter, and
are the stress and strain, respectively. Since the radius varies with normal load; there is a corresponding stress for each load value. Hence, the measured values of P and h correspond to points on stress–strain curves that are associated with the indentation experiments.
3.3. Interfacial Fracture Toughening Models and Crack Path Selection
3.3.1. Row and Zone Models
Row and zone models (Evans, Citation1989) were used to estimate the cracked-tip shielding levels that were associated with the measured cracked profiles. The models assumed that, as the cracks reach an obstacle, they deflect around it (Tong et al., Citation2012), (Rahbar, Yang et al., Citation2008) (Evans, Citation1989). Hence, the shielding in the row model is influenced by the shear resistance that arises from the interactions between the two materials (friction angle, Ø), the angle of deflection, β, and the loading angle, θ. These were determined along with the applied forces associated with mode I and mode II, and used to estimate the crack-tip shielding, as shown in . If energy release rate is represented by G, the interfacial fracture resistance (shielding) can be expressed as (Evans, Citation1989):
The zone model was explored as a second model (Evans, Citation1989). This utilized a simplified idealization of the crack profile that is shown in . Note that the zone model does not account for friction, as β = 0 and Ø = 0 (Rahbar, Wolf et al., Citation2008) (Tong et al., Citation2012). The shear stresses and displacements are also assumed to be elastic and similar to those associated with a linear array of micro-cracks. From equation 22 and Equationequation 23(23)
(23) , E is the Young’s modulus, L is the zone length, H is the height of the interface step, D is the facet length and values of l are the spacing between the facet (micro-cracks) centers. The zone model gives the toughening increment ratio as:
where is a material factor that can be estimated from the following expression (Evans, Citation1989):
For cases in which the mode mixity dependence of toughening can be estimated from Ref.(Evans, Citation1989). This gives:
is determined by the value of
as determined by Budianski et al. (Bernard Budiansky et al., Citation1988).
4. Results and Discussion
4.1. Nano-indentation Measurements of Reduced Young’s Modulus and Hardness
A typical three-dimensional topographical SPM image (obtained from an epoxy/clay composite coated sample) is presented in , which also includes load-displacement curves for pristine epoxy and epoxy composite coatings that were subjected to indentation loading up to a maximum load of 8000. The load–displacement curves were used to determine the hardness (H) and the reduced elastic Young’s moduli (Er) of the tested samples. Under the same loading conditions, pristine epoxy had the lowest resistance to penetration by an indentation force (hardness) and the highest maximum indentation depth at that force.
Figure 2. The load—displacement plots of pristine epoxy and the different composites coatings
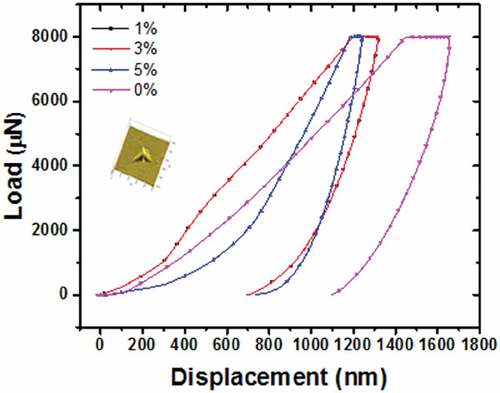
The hardness values and the reduced elastic moduli are summarized in . The results show that, for clay weight fractions of 1, 3, and 5%, the hardness (H) increased, respectively, by 46%, 80% and 88%. Furthermore, for the same range of clay particle reinforcement, the respective reduced Young’s moduli were 23%, 58.5% and 50% greater. These suggest that the increase in clay content in the composite coatings increased the hardness and elastic modulus of the material. This is consistent with work done by Ayatolah et al. 2012 (Ayatollahi et al., Citation2012) and Ghader et al. 2007 (Khanbabaei et al., Citation2007). Inclusion of high strength clay particles into the structure of the epoxy coatings made them more resistant to deformation compared with the pristine epoxy hence produced a much higher hardness value.
Table 4. Summary of Mechanical Properties of Indented Samples
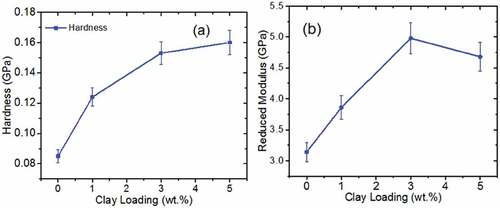
presents a summary of the effect of clay content on the hardness and Young’s moduli. It shows that there is a progressive increase in the hardness and reduced moduli of the composite coatings with increasing clay reinforcement weight fraction. Typical values of H/Er are presented in as measures of plastic indentation resistance. The plastic indentation resistance decreases with increasing clay content. These results suggest that controlled reinforcement with the clay particles may be used to control the hardness plastic indentation resistance of clay reinforced composites.
Figure 3. Hardness as a function of clay loading (a) and reduced modulus as a function of depth (b) of pristine epoxy and its nanocomposite
4.2. Rule of Mixtures and Shear Lag Models
The predictions of strength and Young’s moduli obtained from the rule of mixtures and shear lag models are compared with the experimental measurements in .
Table 5. Comparison of ROM and Shear Lag Predictions and Experimental Results
There was variation in the prediction results of the different composites as seen in . This may be due to a huge influence of clay particles in the epoxy matrix which became more evident with increase in reinforcement. Previous studies have shown that reinforcements give a better opportunity for stress to be distributed well in the epoxy matrix and the reinforced particles (Manoharan et al., Citation2009). This might also be associated with a reduction in dislocation movement as a result of increased grain boundary density from the reinforcement (Ayatollahi et al., Citation2012). It can therefore be suggested that the composite strength can be engineered by controlling the fiber and interfacial strengths, and the aspect ratios of the particles.
There were obtained using epoxy and clay particle properties that are summarized in .
4.3. Mode Mixity Dependence of Interfacial Fracture Toughness
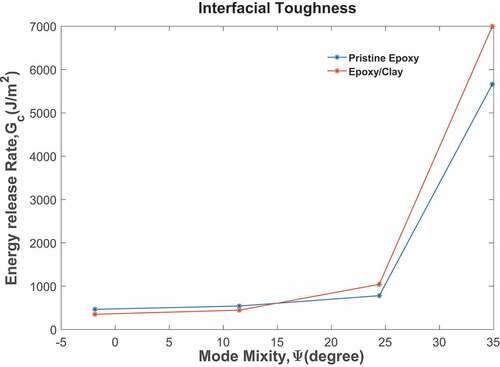
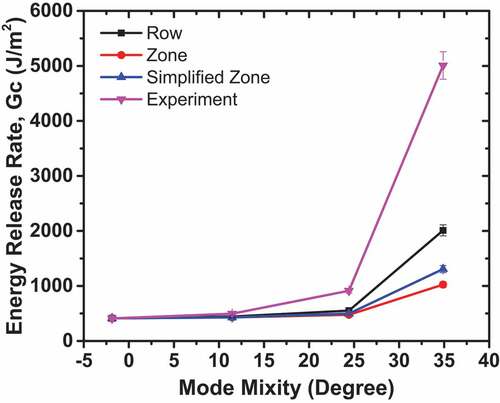
The interfacial fracture toughness values were obtained from four sets of experiments that are presented in for interfaces between the X65 steel and the epoxy/clay composite coatings. The results were considered valid when the initial crack extension occurred along the steel/coating interface. As in earlier studies on other steel/epoxy interfaces (Wang & Suo, Citation1990)(Rahbar, Yang et al., Citation2008), the measured interfacial fracture toughness values increase with increasing mode mixity (). The interfaces between the X65 steel and the clay composites also had higher interfacial fracture toughness values than those between the epoxy and the X65 Steel.
Figure 4. Fracture Toughness of Epoxy and Epoxy/Clay as a Function of Loading Phase,
SEM images of fractured halves of the Brazil disk fracture toughness specimens are presented in for epoxy/steel interfaces, and for epoxy/clay composite/steel interfaces. At 3° and 12°, loading inclination angles for epoxy/steel interface, the crack kinked in and out of the interface. However, in the case of epoxy/clay composite/steel interfaces, bridging elements were observed along the crack profile, along with evidence with kinking in and out of the crack from the interfaces (, ). This suggest that toughening in the interfacial fracture experiments can be attributed largely to crack bridging and crack deflection(Rahbar, Wolf et al., Citation2008), (Wang & Suo, Citation1990) as shown in . Hence, the toughening mechanisms were idealized and modeled using simplified zone and zone models presented in .
Figure 5. SEM Images of Fractured Brazil Disc Specimenat ψ = 3° for Epoxy (a) and Epoxy/Clay Composite (b) and at ψ = 12° for Epoxy (C) and Epoxy/Clay Composite (d)
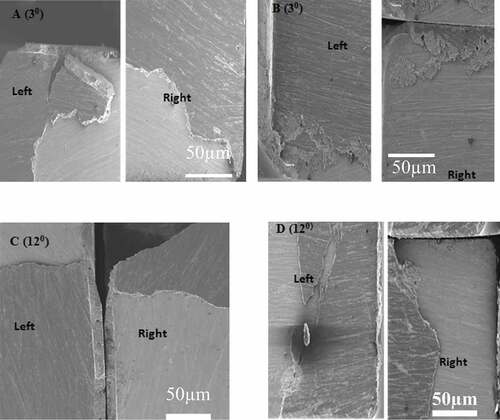
Figure 6. SEM Images Showing the Incomplete Fractured Discs at ψ=30 for Epoxy/Clay Steel interface (a) and for epoxy/steel interface (b)
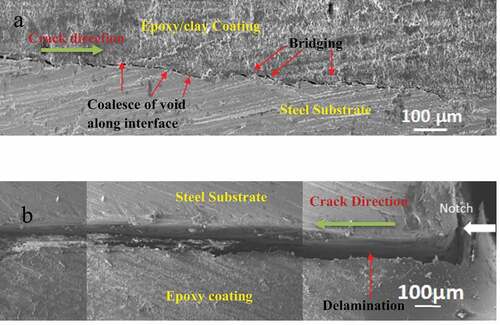
Figure 7. SEM Images Showing the Incomplete Fractured Discs at ψ = 3° for Epoxy/Clay Steel interface (a) and for epoxy/steel interface (b)
4.4. Toughening models
For each Brazil disk crack, the energy release rate, G, was calculated using the mechanical properties of the epoxy and epoxy composites obtained from indentation measurements on the layers in Brazil disks that were tested at loading angles of. The corresponding mode mixity values,
were found to be
=
respectively. There were four different sets of experiments and averages taken for each experiment. These results were consistent with similar work done by Rahbar et al. and Tiffany et al. (Rahbar, Wolf et al., Citation2008), (Tong et al., Citation2012), (Rahbar, Yang et al., Citation2008). This work was restricted to β = 0 as the influence of β on ψ is negligibly small in this case Nima et al).
The toughening estimates obtained using the above data are summarized in . These were incorporated into to the expressions presented in Section 2 to obtain predictions of toughening from Row, zone to simplified zone models. The predictions are presented in and along with the experimental measurements of the mode mixity dependence of the interfacial fracture toughness values. The trends in the predicted interfacial fracture toughness were generally in good agreement with predictions from the zone and row models, as well as the simplified zone models, at lower mode mixities which was similar work done by Tiffany et al(Tong et al., Citation2012). However, larger differences were observed between the predictions and the measurements of the interfacial fracture toughness at higher mode mixities. The lower energy release rate obtained from the predictions relative to the higher one from experiments may have been due to higher shearing forces overriding mode I opening that eventually encouraged kinking into the substrate which is not evaluated by the model presented in this study.
Table 6. Comparison of Experimental and Predicted Fracture Toughness G[J/m2]
5. Implications
The current work suggests that epoxy/clay composites can ѱ be designed to have attractive combinations of strength, Young’s moduli and interfacial fracture toughness between steels and epoxy/clay composite coatings. This can be achieved by the reinforcement of the epoxy matrices with clay particles with weight percentages up to about 3%. However, above this, the elastic moduli and hardness may decrease, perhaps due to the clustering of the particles, which may result in stress concentration effects, and the reduction of composite mechanical properties.
In any case, the measured Young’s moduli and strength estimates obtained from hardness values are comparable to estimates obtained from rule-of-mixture and shear lag models. The models are also generally found to capture the trends in the measured Young’s moduli and hardness/strength data for the different composites that were examined in this study. Furthermore, the current work suggests that controlled reinforcement with the clay particles may be used to control the hardness plastic indentation resistance (). In general, the plastic indentation resistance decreases with increasing clay particle loading.
Finally, it is of interest to note that the interfacial fracture toughness values (between the X65 steel and the epoxy or epoxy/clay composite coatings) increased with increasing mode mixity for 3 wt. %. Interfacial fracture was also associated largely with the kinking of cracks in and out of interfaces, with some bridging elements and crack deflection. These result in crack-tip shielding that explains much of the toughening that is observed at lower mode mixities. However, at higher mode mixities, there are discrepancies between the predicted and the measured toughening levels. These might be due to the shear-induced interlocking of asperities at higher mode mixities where the mode II components of the crack driving forces are much greater. Further work is needed to develop more robust models for the prediction of the mode mixity dependence of the interfacial fracture toughness at higher mode mixities. In any case, we hope that the ideas presented in this paper will be useful in the design of structural integrity in the oil and gas industry, as well as in the design and fabrication of steel structures that are bonded or coated with epoxy/clay mixtures.
5.1. Conclusions
1. The incorporation of 1, 3 and 5 wt % of clay particle fillers (into epoxy) increases the hardness by 46%, 80% and 88% and the increase Young’s moduli by 23%, 58.5% and 50%, respectively. The improvements are associated with the deformation restraint provided by the clay particles.
2. The interfacial toughness between X65 steel and the epoxy/clay coatings (of the composite reinforced with 3 wt. % of clay) increases with increasing mode mixity. This increase is associated with crack-tip shielding by crack deflection and crack bridging.
3. The trends in the measured mode-mixity dependence of the interfacial fracture toughness values are consistent with predictions from the simplified zone, normal zone and row models at lower mode mixity.
Acknowledgements
The authors acknowledge the financial support obtained from the Pan-African Materials Institute (AUST/PAMI/2015-5415-NG) under the World Bank African Centers of Excellence program. The authors are also grateful to the Worcester Polytechnic Institute for financial and technical support.
Disclosure statement
Authors declare that they have no competing financial interest or personal relationship that could have appeared to influence the work reported in this paper.
Additional information
Funding
Notes on contributors
Odette F. Ngasoh
Ngasoh Fayen Odette obtained a Bachelor degree in Chemistry and Materials Science from the University of Buea, Cameroon in 2010. She also received her M.Sc in Materials Science and Engineering from the African University of Science and Technology (AUST) in Abuja, Nigeria in 2013. She is actively involved in the research and design of composites using promising materials locally source. She also extensively evaluates the adhesion of such coatings to substrates using fracture mechanic approach such as the interfacial fracture studies, for better understanding of their underlying properties. She is certain that findings from her work will benefit a wide range of research.
ReferencesReferences
- Atkinson, C., Smelser., R. E., et al. Combined Mode Fracture Via the cracked Brazilian Disk Test. 18. 4. 279–17. April 1982.
- Ayatollahi, M. R., Doagou-rad, S., & Shadlou, S., “Nano-/Microscale Investigation of Tribological and Mechanical Properties of Epoxy/MWNT Nanocomposites,” pp. 1–13, 2012. Macromolecular Materials and Engineering, 297(7),689-701. doi:10.1002/mame.201100271
- Azeez, A. A., Rhee, K. Y., Park, S. J., & Hui, D. (2013). Epoxy clay nanocomposites - Processing, properties and applications: A review. Composites Part B: Engineering, 45(1), 308–320. https://doi.org/10.1016/j.compositesb.2012.04.012
- Banks-sills, L., & Schwartz, J., “Crack paths in adhesive bonds,” pp. 225–234, 2002. Springer, Dordrecht,https://doi.org/10.1007/0-306-484102_22
- Bernard Budiansky, J. C. A., Evans, A. G., & Evans, A. G. (1988). Small-Scale Bridging and the Fracture Toughness of Particulate-Reinforced Ceramics. Journal of the Mechanics and Physics of Solids, 36(2), 167–187. https://doi.org/10.1016/S0022-5096(98)90003-5
- Brabazon, D. (2018). Chapter 16. In Nanocharacterization techniques for dental implant development. Elsevier Inc. doi:10.1016/b978-0-12-812291-4.00016-9
- BYK Additives &Instruments, “Technical Information B-RI 10 Cloisite Nanocomposite Additive for Halogan free Flame Retardants,” pp. 1–4, 2013.
- Chen, Z., Zhou, K., Lu, X., & Lam, Y. C. (2014). A review on the mechanical methods for evaluating coating adhesion. Acta Mech, 225(2), 431–452. https://doi.org/10.1007/s00707-013-0979-y
- Discussion: Edge-bonded dissimilar orthogonal Elastic Edges Under Normal and Shear Loading. (Bogy,D.B, 1968), ASME J.Appl.Mech./35
- Evans, A. G. (1989). Effects of Non-Planarity on the Mixed Mode Fracture Resistance of Bimaterial Interfaces. 37(3), 909–916. Acta Metallurgica. doi:10.1016/0001-61601(89)90017-5
- Gledhill, R. A., Kinloch, A. J., Yamini, S., & Young, R. J. (1978). Relationship between mechanical properties of and crack propagation in epoxy resin adhesives. Polymer (Guildf), 19(5), 574–582. https://doi.org/10.1016/0032-3861(78)90285-9
- Hoerantner, M., Leijtens, T., Eperon, G., Renewable, N., & Mcgehee, M. D., “The Potential of Multijunction Perovskite Sola r,” no. October, 2017. ACS Energy Lett. doi:10.1021/acsenergylett.7b00647
- Hutchinson, J. W., Mixed Mode Cracking in Layered Materials, vol. 29. 1992. Advances in Applied Mechanics. doi:10.1016/s0065-2156(08)70164-9
- Jumahat, A., Soutis, C., Ahmad, N., & Wan Mohamed, W. M. (2013). Fracture toughness of nanomodified-epoxy systems. Appl. Mech. Mater, 393, 206–211. https://doi.org/10.4028/www.scientific.net/AMM.393.206
- Jumahat, A., Soutis, C., Jones, F. R., & Hodzic, A. (2012). Compressive behaviour of nanoclay modified aerospace grade epoxy polymer. Plast. Rubber Compos, 41(6), 225–232. https://doi.org/10.1179/1743289811Y.0000000028
- Kalidindi, R. S. R., & Subasri, R. (2014). Sol-gel nanocomposite hard coatings. Elsevier Ltd. doi:10.1016/B978-0-85709-211-3.00005-4
- Khanbabaei, G., Aalaie, J., Rahmatpour, A., Khoshniyat, A., & Gharabadian, M. A. (2007). Preparation and properties of epoxy-clay nanocomposites. Journal of Macromolecular Science, Part B, 46(5), 975–986. https://doi.org/10.1080/00222340701457287
- Khodair, Z. T., Khadom, A. A., & Jasim, H. A. (2018). Corrosion protection of mild steel in different aqueous media via epoxy/nanomaterial coating: Preparation, characterization and mathematical views. J. Mater. Res. Technol, doi:10.1016/j.jmrt.2018.03.003, Volume 8, issue 1, pages 424–435
- Kim, S.-R., & Nairn, J. A. (2000). Fracture mechanics analysis of coating/substrate systems: Part II: Experiments in bending. Engineering Fracture Mechanics, 65(5), 595–607. https://doi.org/10.1016/S0013-7944(99)00142-3
- Kusmono, M. W. W., Ishak, Z. A. M., & Mohd Ishak, Z. A. (2013). Preparation and properties of clay-reinforced epoxy nanocomposites. International Journal of Polymer Science, 2013, 1–7. https://doi.org/10.1155/2013/690675
- Malik, A. U., Ahmad, S., Andijani, I., Al-muaili, F., Prakash, T. L., & Hara, J. O. (1999). Corrosion Protection Evaluation of Some Organic Coatings in Water Transmission Lines 1. issue. TR3804/APP95009. November 1966
- Manoharan, M. P., Sharma, A., Desai, A. V., Haque, M. A., Bakis, C. E., & Wang, K. W. (2009). The interfacial strength of carbon nanofiber epoxy composite using single fiber pullout experiments. Nanotechnology, vol. 20(no), 29. https://doi.org/10.1088/0957-4484/20/29/295701
- Ngasoh, O. F., Anye, V. C., Agyei-Tuffour, B., Oyewole, O. K., Onwualu, P. A., Soboyejo, W. O., & Raja, K. S. (2020). Corrosion behavior of 5-hydroxytryptophan (HTP)/epoxy and clay particle-reinforced epoxy composite steel coatings. Cogent Engineering, 7(1), 1797982. https://doi.org/10.1080/23311916.2020.1797982
- Oliver, W. C., & Pharr, G. M. (1992). An Improved Technique for Determining Hardness and Elastic Modulus Using Load and Displacement Sensing Indentation Experiments. Journal of Biomedical Materials Research, 7(6), 1564–1583. https://doi.org/10.1557/JMR.1992.1564
- Rahbar, N., Wolf, K., Orana, A., Fennimore, R., Zong, Z., Meng, J., Papandreou, G., Maryanoff, C., & Soboyejo, W. (2008). Adhesion and interfacial fracture toughness between hard and soft materials. Journal of Applied Physics, 104(10), 103533. https://doi.org/10.1063/1.3021350
- Rahbar, N., Yang, Y., & Soboyejo, W. (2008). Mixed mode fracture of dental interfaces. 488, 381–388. doi:10.1016/j.msea.2007.11.038 issue 1–2
- Saba, N., Jawaid, M., & Sultan, M. T. H. (2019). An overview of mechanical and physical testing of composite materials. Elsevier Ltd.
- Shen, L., Wang, L., Liu, T., & He, C., “Nanoindentation and Morphological Studies of Epoxy Nanocomposites,” pp. 1358–1366, 2006.
- Soboyejo, W. O., Lederich, R. J., & Sastry, S. M. L. (1994). Mechanical behavior of damage tolerant TiB whisker-reinforced in situ titanium matrix composites. Acta Metallurgica et Materialia, 42(8), 2579–2591. https://doi.org/10.1016/0956-7151(94)90199-6
- Square, F. O. (2010). Determination of Stress-Strain Curve through Berkovich Indentation Testing. doi:10.4028/636-637.1186
- Systems, C. P., Corrosion, F., & Perspectives, F., “Corrosion Protection Systems and Fatigue Corrosion Future Perspectives,” pp. 1–51, 2017.
- Tong, T. M., Tan, T., Rahbar, N., & Soboyejo, W. O., “Mode Mixity Dependence of Interfacial Fracture Toughness in Organic Electronic Structures (September 2012),” vol. 14, no. September 2012, pp. 291–299, 2013. doi:10.1109/TDMR.2013.225788
- Wang, J. S., & Suo, Z. (1990). Experimental determination of interfacial toughness curves using Brazil-nut-sandwiches. Acta Metallurgica et Materialia, 38(7), 1279–1290. https://doi.org/10.1016/0956-7151(90)90200-Z
- “Strong Adhesives for Bonding Metal, Glass & Plastic | Permabond.”
- “The Evolution of Pipeline Coatings [Gas Exploration]KTA University.” Available: https://ktauniversity.com/evolution-pipeline-coatings/. [ Accessed: 19 June 2019a].
- “Epoxy Resin Market Analysis and Industry Forecast 2022.” Available: https://www.alliedmarketresearch.com/epoxy-resins-market. [ Accessed: 19 June 2019b].