
Abstract
This study designed, techno-economically analyzed and compared the heat-assisted extraction (HAE)- and ultrasound-assisted extraction (UAE)-technology-based processes (HAE-tBP and UAE-tBP) for the production of crude anthocyanins powder (CAnysP) from Hibiscus sabdariffa calyx (HSC) with the assistance of SuperPro Designer software. Both the base cases and industrial setups of 600 L extractor capacities for HAE- and UAE-tBPs were analyzed and compared. When building the process flowsheets, peculiarities of the technicalities of both HAE and UAE extractors were taken into consideration. Materials and energy demands, production costs and unit production cost (UPC) of CAnysP were the parameters used for process analysis. Uncertainty and sensitivity analyses were conducted for the process with least CAnysP UPC using Monte Carlo simulations in Oracle Crystal Ball software. The HAE-tBP recorded the highest number of batches of 5278 per annum. HSC of 15.551 kg was required to produce 7.433 and 10.022 kg/batch CAnysP by 600 L extractor setup of HAE- and UAE-tBPs, respectively. The UAE-tBP achieved lower CAnysP UPC (164.28 US$/kg) compared with HAE-tBP (176.31 US$/kg) with 80.08% certainty. Out of the variables considered for sensitivity analysis of UAE-tBP UPC, ultrasound treatment time contributed the highest (+62%), while anthocyanins recovery contributed the least (+0.2%) to the variance in UPC.
PUBLIC INTEREST STATEMENT
Consumers’ demands for healthy and natural food products have increased effort to replace the existing synthetic food dyes with natural alternatives. Hibiscus sabdariffa calyx is an established natural source of colorants with potential applications in food industries. However, obtaining natural colorants from Hibiscus sabdariffa calyx industrially will require extraction technology that is efficient and cost effective in order to achieve cheap and affordable products. Among the presently available efficient and popular technologies of colorants production from Hibiscus sabdariffa calyx are the heat-assisted and ultrasound-assisted extraction technologies. However, holistic techno-economic assessment of processes utilizing these technologies will assist in proper data-driven selection of a cost-effective option for large-scale production of colorant from Hibiscus sabdariffa calyx. In this way, a profitable technology-based process alternative can be designed, optimized, sensitized and economically analyzed.
1. Introduction
Due to the increasing concerns of health risks associated with the use of synthetic food colorants (Ramesh & Muthuraman, Citation2018) and unending demands for healthy food products by consumers, bio-based alternatives are being explored as a promising replacement (Pinela et al., Citation2019). Among the most researched bio-based options are plant materials (Liazid et al., Citation2011) since many are inherent sources of pigments with potential bioactivities. Hibiscus sabdariffa L. calyx (HSC) is a natural plant that is known and used worldwide because of its characteristics red colour and health benefits (Owoade et al., Citation2019). Anthocyanins (Anys) are a group of polyphenols responsible for the characteristic red colour of HSC and can be recovered for use as natural colorants in food and pharmaceutical industries. The HSC colorants are usually in the dried powdery form to achieve low anthocyanins degradation and high product stability. Although with high variability in compositions, HSC was reported to contain Anys as high as 2.5 g 100 g−1 DW (Cissé et al., Citation2011) and has been recognized as an industrial feedstock for the commercial production of natural colorants (Shruthi et al., Citation2016). However, high costs of natural colorants have limited their use by the industrial sector (Carocho et al., Citation2015). The Anys in HSC are majorly delphinidin-3-sambubiosidde (56%); delphinidin-3-glucoside (4%); cyanindin-3-sambubioside (33%) and cyanindin-3-glucoside (3%) (Owoade et al., Citation2019). Early investigations on nutritional compositions of HSC revealed that it contains carbohydrates (12.3 g/100 g), protein (1.9 g/100 g), fiber (2.3 g/100 g), fat (0.1 g/100 g), vitamin C (14 mg/100 g), calcium (1.72 mg/100 g), iron (57 mg/100 g) and β-carotene (300 μg/100 g) (Da-Costa-Rocha et al., Citation2014). Studies have shown that the extracts of HSC have antibacterial, antifungal, antiparasitive, antipyretic, antinociceptic, anti-inflammatory and antioxidant activities (Owoade et al., Citation2019).
At present, there are many technologies for the recovery of Anys from HSC. The heat-assisted extraction technology (HAE-t) is by far the most studied (Aurelio et al., Citation2008; Díaz-Bandera et al., Citation2015). However, HAE-t has some drawbacks such as longer extraction time, high energy demands, and high solvent requirement. Industrially, HAE-t also has some advantages which include, ease of scalability, equipment availability and low equipment and maintenance costs. Other modern technologies of enhancing bioactive extraction from plant materials are ultrasounds (Quintero Quiroz et al., Citation2019), microwaves (Proestos & Komaitis, Citation2008), pulsed electric fields (Nowacka et al., Citation2019) and pressurized and supercritical fluids (Rodríguez-Meizoso et al., Citation2008). However, among the modern technologies, ultrasound-assisted extraction technology (UAE-t) stands out because of its numerous advantages which include low solvent consumption, low energy consumption, low extraction time and high extraction yield (Chemat et al., Citation2017). UAE-t ensures safe and high-quality products and has been recognized as suitable for industrial applications (Pinela et al., Citation2019). The UAE-t has been successfully employed to extract antioxidants from Prunus domestica L. (Savic & Gajic, Citation2021), carotenoids from orange peel (Savic Gajic et al., Citation2021) and polyphenols from Triticum aestivum L. (Savic & Gajic, Citation2020). The technology is based on the application of high frequency sound to achieve the extraction of compounds in the solid matrix. The categories of UAE-t in food industries are classified into low intensity—high frequency (f > 100 kHz) and high intensity-low frequency (20 kHz < f < 100 kHz) ultrasound. However, high investment may be required because of the huge equipment cost, which is approximately 25% more than the conventional technology (Prado et al., Citation2017). UAE-t also requires high instrumentation and automation cost. Therefore, a holistic techno-economic assessment of the process utilizing these technologies for the production of natural colorant from HSC (not only of the extraction process as a unit operation) is required before appropriate selection of the cost-effective option for industrial applications.
Solid-liquid (S/L) extraction of HSC has been a widely investigated method of optimally recovering Anys-based colorant in HSC (Cissé et al., Citation2012; Tsai et al., Citation2002), however, the method is not selective and tend to extract Anys and other soluble components. Although many parameters play a role in the optimal recovery of crude Anys (CAnys) from HSC using S/L extraction, some of the widely studied process factors for conventional HAE-t include solid-liquid ratio (S: L), extraction temperature, extraction time, solvent type, particle size and organic solvent-water mixture proportion to mention a few (Ramirez‐Rodrigues et al., Citation2011). Other processing parameters, such as ultrasound treatment/sonication time and ultrasound power are specific investigated process parameters to UAE-t (Pinela et al., Citation2019). However, because of the intricate scenarios that these multi process factors present, the design of experiment is frequently employed to obtain the best factor combinations that are required for the optimal extraction of Anys or CAnys through optimization studies (Salmerón-Ruiz et al., Citation2019). This is necessary for the detailed process design and techno-economic analysis of the extraction of Anys or crude anthocyanins powder (CAnysP) from HSC and for scale-up purposes for its industrial production.
Literature search however revealed that the study of Pinela et al. (Citation2019) remains one of the comprehensive investigations that employed the design of experiments to investigate and optimize the extraction of Anys-based colorant from HSC using HAE- and UAE-t at laboratory scale. Although, different values of factor combinations (water and shorter extraction time were most suitable for HAE-t, while high ethanol proportion and longer ultrasonic treatment time were required by UAE-t) were obtained for optimum extraction of Anys which must be taken into consideration during method selection, an overall economic analysis of the entire processes (heat-assisted extraction technology based process (HAE-tBP) and ultrasound-assisted technology-based process (UAE-tBP) is required In order to determine the most cost-effective option. This should take into consideration equipment investment, energy consumption, solvent-solute interactions and thermodynamics and the solvent type and costs among others during design and process analysis. This work, therefore, is an extension of the work of Pinela et al. (Citation2019) to investigate the appropriate cost-effective technology (between HAE- and UAE-t) for the production of CAnys from HSC at an industrial scale. Computer-aided process simulation (CAPS) is one of the available tools to achieve the above objective. CAPS uses computer packages to do steady heat and mass balancing, equipment sizing and costing calculations for a process. CAPS also identifies the processing step with high capital and operating cost, which gives low process yield and/or production throughput, and it is also useful in process optimization (Alshekhli et al., Citation2011). Although CAPs is relatively new, it has been used in the techno-economic analysis of biodiesel and ethanol co-production from lipid-producing sugarcane (Huang et al., Citation2016), process design and techno-economic analysis of an integrated mango processing waste biorefinery (Arora et al., Citation2018), economic analysis of biogas production from agricultural biomass and techno-economic analysis of biodiesel production from Calophyllum inophyllum oil (Arumugam et al., Citation2019).
This work, designed, modelled and techno-economically analyzed the HAE- and UAE-tBPs for the production of CAnysP from HSC with the assistance of SuperPro Designer software to identify a cost-effective choice that offers a reduced unit production cost (UPC) of CAnysP between the two selected technologies. The objectives are therefore to (i) design the base cases and carry out scale-ups of HAE-and UAE-tBPs for the production of CAnysP from HSC using the global optimum experimental data of Pinela et al. (Citation2019) (ii) techno economically analyze and compare base cases and industrial capacities of HAE- and UAE-tBPs with the mind of identifying technology with the least crude anthocyanins powder unit production cost (CAnysP-UPC) (iii) conduct uncertainty and sensitivity analyses of technical and cost variables on extraction technology with least CAnysP-UPC using Monte Carlo simulations available in Oracle Crystal Ball (OCB) software to identify variables that will perturb UPC of the selected technology profoundly.
2. Methodology
2.1. Extraction conditions in HAE- and UAE-tBPs for CAnysP production from HSC
The published global optimal data of the laboratory extraction of CAnys from HSC by Pinela et al. (Citation2019) was used for HAE- and UAE-tBP simulations. These conditions were used to build the flowsheets with the assumption that industrial capacity will have similar behavior with laboratory-scale if the same operation conditions were used (Lee et al., Citation2018). Solvent mixtures (ethanol and water) and extremes (0% and 100% (v/v) ethanol) were investigated for the optimum extractabilities of CAnys in HSC. Extraction parameters considered for investigation and optimization by Pinela et al. (Citation2019) for HAE-t were extraction time (t), temperature (T) and ethanol concentration (S) while for UAE-t were extraction time (t), ultrasonic power (P) and ethanol concentration (S). The liquid to solid (S:L) ratio of 30 mL/g was used for all investigations. presents global optimal extraction data used for building the flowsheets for HAE- and UAE-tBPs.
Table 1. Global optimal extraction conditions (Pinela et al., Citation2019)
2.2. Process description, simulation and scale-up of CAnysP production from HSC using HAE- and UAE-ts
SuperPro Designer software (Intelligen Inc., Citation2014) was employed for the simulation of the base case extraction of CAnysP from HSC using HAE- and UAE-tBPs. SuperPro Designer software contained equipment models, unit operations and chemical compounds in its library and was used for the calculations of material and energy balances. The software was also responsible for equipment sizing, calculation of electricity requirements, and amount of heating and cooling agents required in HAE- and UAE-tBPs. In the course of building the flowsheets, components that were not available in the software library but were required in the simulation were registered as user defined components and afterward adjusted to the component’s real properties. The properties of all solutions and mixtures were estimated from relative percentages of pure components in the mixture using the software. Both the HAE- and UAE-tBPs were modelled as batch processes and 7920 h annual operating time (AOT) was assumed (Vieira et al., Citation2013). presents the major components, solutions and mixtures, as well as the referenced components for all user-registered components that were used for building the flowsheets.
Table 2. Major components, mixtures and solution used in flowsheet simulation
Plant configuration similar to Santos et al. (Citation2010) and Veggi et al. (Citation2011) was used for this investigation. However, only one extractor was considered among the equipment units to imitate 100% batch operation and the scenario where extracting solvents were not reused was considered during simulation for both technologies. This is to achieve a benchmark for the comparison of the two investigated extraction technologies. Similar approach was adopted by Lee et al. (Citation2018) and Athimulam et al. (Citation2006). Major unit equipments featured in the process simulations were grinder (P-2/GR-102), extractor (P-3/R-101), centrifuge (P-4/BG-101), evaporator (P-8/PFE-101), condenser (P-9/HX-101) and dryer (P-11/SDR-101) with CAnysP as the main product. HSC has high variability and its composition is season and location-dependent however HSC composition was modelled to contain Anys, moisture, fiber and other soluble components and was formed using the work of Pinela et al. (Citation2019). The HAE and UAE-tBPs were designed to utilize already dried HSC for the production of CAnysP due to the availability of dried HSC that can be easily purchased from the market.
shows the flowsheet for the base case modelling and simulation of CAnysP production from HSC using HAE- and UAE-ts. The two technologies widely differ in their respective solvent type requirements, extractor operation conditions and technicalities (vessel heating and ultrasound treatment) for optimal CAnysP extraction () and were modelled, thus, dried HSC (approximately 6% moisture content) was pulverized using grinder P-2/GR-101 that operates at 0.04 kg/h for 15 min to the particle size of 5 mm. Electricity was used to operate the grinder and power converted to heat energy was assumed to be 5%. The pulverized HSC was afterward transferred along with the extracting solvent (water in case of HAE-tBP and 46.1% ethanol solution in case of UAE-tBP), which was stored in P-1/V-101 into extractor P-3/R-101. Extractions of Anys and other soluble components were actualized in P-3/R-101 according to respective peculiarities of simulated technologies. For HAE-t, the extraction procedure was developed in a similar manner to the work of Veggi et al. (Citation2011). Briefly, the extractor content (1 g of HSC and 33 mL of water) was heated to the temperature of 30°C and vessel heating continued for 30 min with constant extractor’s content agitation. UAE-t was however simulated according to Santos et al. (Citation2010) and Vieira et al. (Citation2013).
Figure 1. Simulation flowsheet and mass balance for base case production of CAnysP using HAE and UAE technologies
Here, it was assumed that the ultrasonic transducer of 20 kHz, capable of providing 386.3 W was bonded to the wall of the extractor. It was further assumed that HSC (1 g) stayed immersed in the solvent (33 mL of 46.1% ethanol solution) and received ultrasound treatments (UT) for 42.9 min. Excessive energy (in the forms of heat) that could lead to HSC and Anys degradation as a result of ultrasound treatment was removed in the cooling operation step and the product stream’s final temperature was 30°C. The solvent-extract-fiber mixture was later transferred into a Bowl Centrifuge P-4/BC-101 where 100% of HSC fiber was assumed. 40% solvent-extract mixture removal along HSC fiber was assumed to account for product losses (Athimulam et al., Citation2006). The centrifugation process took 15 min, and the solvent-extract mixture was stored in P-6/V-102 while the HSC fiber was stored in P-7/V-103 as organic wastes.
A centrifugal pump, P-8/PM-101 with 70% efficiency and that operates at 1 bar was used to transfer solvent-extract mixture to a vacuum falling thin-film evaporator P-9/TFE-101 with heat transfer coefficient of 2104.913 W/m2K and 90% efficiency. The evaporated solvent was thereafter cooled and condensed in the condenser P-9/HX-101 with a heat transfer coefficient of 860.44 W/m2K and 90% efficiency. Both the vacuum falling thin-film evaporator (P-9/TFE-101) and condenser (P-9/HX-101) pressures were simulated using the Peng-Ronbison cubic equation of state according to published work of Vieira et al. (Citation2013) and Ochoa et al. (Citation2020). The temperature in P-9/TFE-101 was fixed at 65°C for both HAE- and UAE-tBP however, the pressure for the HAE and UAE was determined at 170.70 mm Hg and 344 mm Hg, respectively, by the simulator. The evaporation of the solvent in P-9/TFE-101 took 60 min to achieve a high solid content in the concentrated extract solution. The concentrated extract–solvent mixture was sent to the spray dryer P-11/SRD-101 operating at the temperature of 70°C while the solvent that was condensed by P-9/HX-101 was stored in a storage vessel P-10/V-104. The SRD-101 was set to achieve 5% moisture content in the final product and the whole operation lasted approximately 60 min. The final product was obtained as CAnysP and was stored in P-11/V-105. The process schedule that details all the unit operations performed and allot time to each operation was documented and is presented in . It should be noted in that except for different extractor’s processing times for HAE- and UAE -tBPs, which were based on global optimal conditions (), all other processing steps and times are the same. This procedure is similar to the studies of Vieira et al. (Citation2013) and Ochoa et al. (Citation2020). Setup time of 5 min was assumed for all process operations.
Table 3. Scheduling summary for the base case models of HAE- and UAE-tBPs
In order to make a comparison of both simulated technologies at an industrial scale, the base cases of the process of production of CAnysP using HAE- and UAE-ts were scaled up to industrial capacity and were evaluated at setup of 600 L extractor capacity. The 600 L extractor capacity for both HAE—and UAE-ts was selected as an intermediate industrial scale since it showed high economies of scale effect with minimum multiple equipment units. Veggi et al. (Citation2011) also used same plant capacity for similar investigation. All operating and process conditions as the base cases were adopted for the industrial setup of 600 L extractor capacity of both technologies. The amount of HSC, solvents, electricity, cooling and heating demands were calculated for both technologies at both laboratory and industrial setup and were determined by SuperPro Designer software.
2.3. Economic analysis of processes of production of CAnys using HAE and UAE technologies
SuperPro Designer software (Intelligen Inc., Citation2014) was used to achieve the economic analysis of the processes of CAnysP production using HAE- and UAE-ts. The economic analysis was conducted according to the procedure of Baral and Shah (Citation2016). Economic analysis of both HAE and UAE-based processes involved the determination of total capital investment cost (TCC), total annual operating cost (TOpC) and UPC of CAnysP produced. presents the assumptions used in the economic analysis of HAE and UAE-tBPs. The project lifetime was assumed to be 15 years, construction period of 30 months, the inflation rate of 4% and the annual production time of 7920 h (Baral & Shah, Citation2016).
Table 4. Assumptions used for economic analysis (Baral and Shah (Citation2016))
The TCC is made up of direct fixed capital cost (DFC), working capital and start-up and validation cost. The costs of all featured conventional equipment were obtained from the database of SuperPro Designer software with the assumption that they were all constructed with stainless steels. The cost of the UAE extractor was assumed to be 25% more than the HAE extractor of comparable size (Prado et al., Citation2017). The DFC is the sum of total plant direct cost (TPDC), total plant indirect cost (TPIC), and miscellaneous cost (MC). The TPDC was estimated as fractions of equipment purchased cost (PC) and comprised of process piping, instrumentations, insulation, electrical, building, yard improvement, and auxiliary facilities. TPIC was however estimated as a fraction of TPDC and consisted of engineering and construction costs. The MC parameters are contractor’s fees and contingencies and were estimated as a fraction of the sum of TPDC and TPIC. Working capital was assumed to cover the cost of 30 days of raw materials, waste treatment, and labour costs, and the start-up costs were estimated as 5% of DFC. Since waste produced is non-hazardous and mainly organic (consisting of predominantly HSC fibers) can be used as fertilizers to improve farm productivities and therefore zero treatment cost was assigned.
TOpC is the sum of the costs of raw materials, facility dependent, labour dependent, laboratory QC/QA, and utility. These designs assumed that the plants are sited at proximity to the source where raw materials are being purchased and therefore transportation cost was assumed to be negligible. HSC cost fluctuates in the market; however, a mean price of 3 US$/kg was assumed (Plotto, Citation1999) while the fluctuation in price was considered in uncertainty and sensitivity analyses. The ethanol, water, steam, electricity and cooling agents’ costs were obtained from the software database and they are shown in . Three (3) operators were proposed and assigned to work in both HAE- and UAE-tBPs. The labour rate per operator included basic rate, benefits, supervision, operating supplies and administration and was assumed to be 69 US$/h. Facility dependent cost which comprised of maintenance and repair cost, insurance cost, local taxes and factory expenses was estimated as fraction of DFC. The laboratory QC/QA cost was calculated as 15% of the total labour cost (TLC). The UPC of CAnysP was calculated as the sum of variable and fixed cost divided by the total CAnysP produced and was used as a profitability indicator.
2.4. Sensitivity and uncertainty analyses of cost and technical variables
The technology with the least CAnysP-UPC was used for the sensitivity and uncertainty analyses and was according to the procedure of Lim and Foo (Citation2017). Therefore, variables with a high tendency of high variability due to probable errors during experimental investigations or market price volatility were selected and varied between −20 to +20% using Monte Carlo simulations in Crystal Ball software. The variables of interest were HSC purchase cost (US$/kg), Ancys recovery in the extractor (%), other solubles recovery in the extractor (%), ultrasound treatment time (min), and ultrasound extractor price (US$). During the process of Monte Carlo simulation in Oracle Crystal Ball (OCB) software, triangular distributions were assumed for all the input variables and were put in assumption cells while UPC was made the forecast cell. 100,000 simulations were run to achieve a low mean standard error in UPC.
3. Results and discussion
3.1. Mass and energy balances analysis for HAE- and UAE-tBPs
and b presents the operational Gantt chart for the base case production of CAnysP for HAE- and UAE-tBPs.
Figure 2. Operation Gantt chart of base case model of (a) HAE- and (b) UAE-tBPs
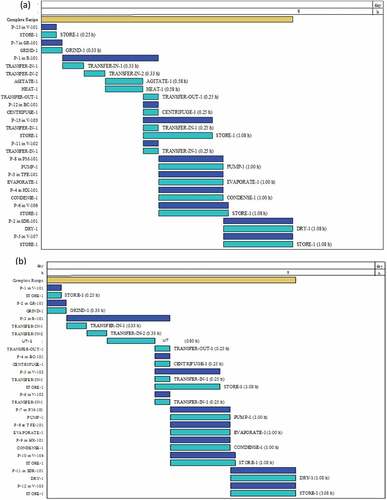
The base case production of CAnysP from HSC using HAE- and UAE-ts took 3.92 and 4.13 h, respectively. The cycle time for HAE-tBP was 1.5 h, while for UAE-tBP was 1.72 h. The number of batches/y, when based on AOT of 7920 h was 5278 and 4616 for HAE- and UAE-tBPs, respectively. The longer batch processing time observed for UAE-tBP was as a result of longer extraction time reported during the global optimization of UAE-t (Pinela et al., Citation2019) and this resulted to a lower number of batches/y compared to HAE-tBP is the flowsheet for the base case production of CAnysP from HSC using both HAE- and UAE-ts. The material balances for HAE- and UAE-tBPs for the important stream flows are also specified and detailed on the flowsheet. The base cases for the HAE- and UAE-tBPs were designed with the global optimal data of Pinela et al. (Citation2019) to produce 0.000472 kg/batch and 0.000644 kg/batch of CAnysP from 1 g of HSC, respectively. The product compositions also differ with CAnysP produced using HAE-t having 2.2441% Anys, 92.7299% other soluble components and 5.026% moisture content, while CAnysP produced by UAE-t with 3.5814% Anys, 91.3917% other components and 5.0269% moisture content. It can be inferred that CAnysP obtained from UAE-t is richer (more quality) in Anys than HAE-t, which further supported the experimental data of Pinela et al. (Citation2019). On annual basis, HAE-tBP required 5 kg of HSC and 175 kg of water, 761 kW-h of electricity, 0.2192 MT of steam and 52 MT of cooling demands to produce 2.49 kg CAnysP/y. Similarly, UAE-tBP required 5 kg of HSC, 74.38 kg of water, 63.62 kg of ethanol, 58,402 kW-h of electricity, 0.1941 MT of steam and 50 MT of cooling demands to produce 2.97 kg CAnysP/y.
shows the materials and energy demands for industrial setup of 600 L capacity for HAE- and UAE-tBPs at the batch and annual production rates. The scale-up study showed that 600 L extractor capacity for both HAE- and UAE-tBPs utilized 15.551 kg HSC at 90% allowable vessel volume for the production of CAnysP. It is interesting to note from that the 15.551 kg of HSC was required by both HAE- and UAE-tBPs to produce 7.433 and 10.022 kg/batch CAnysP, respectively. This indicated that HAE-t only produced about 74.17% of UAE-t. However, 83,040 kg and 71,782 kg HSC were needed, respectively, to produce 39,230.945 kg and 46,263.447 kg CAnysP per annum for HAE- and UAE-tBPs. Therefore, on annual basis, HAE-tBP produced about 84.80% of the quantity of CAnysP, although from processing a higher amount of HSC compared with UAE-tBP. The disparity observed in the batch and annual production rates for HAE- and UAE-tBPs, including the amount of HSC required for CAnysP production for the two technologies, was largely due to the different number of batches per annum observed for HAE- and UAE-tBPs. Other materials, as well as their relative amounts required for the processing of 39,230.945 and 46,263.447 kg CAnysP per annum (7.433 and 10.022 kg/batch CAnysP), respectively, for HAE- and UAE-tBPs are detailed in .
Table 5. Mass and energy balances for 600 L capacity HAE- and UAE-tBPs
The major raw materials for both technology-based processes are ethanol, water, air and HSC. It is obvious from that the solvent requirement for HAE- and UAE-tBPs differs. While HAE-tBP required 521.658 kg/batch (2,753,309 kg/y) water to achieve the production of 7.233 kg/batch (39,230.95 kg/y) CAnysP, mixture of 214.692 kg/batch (991,019.998 kg/y) ethanol and 251.018 kg/batch (1,158,698.002 kg/y) water was needed to produce 10.022 kg/batch (46,263.447 kg/y) CAnysP.
Of significance also on the table are utility demands by HAE- and UAE- tBPs. The electricity and heating demands for HAE-tBP at both batch and annual production rates are higher than for UAE-tBP. However, the cooling demands and heat transfer agents’ requirements for UAE-tBP far outweighed the HAE-tBP requirements at both batch and annual production rates. Further analysis of the utility demands by each process equipment for HAE- and UAE-tBPs is presented in . In the electricity demand category, UAE extractor required lesser electricity (0.2762 kW-h/batch and 1,275 kW-h/y) than the HAE-extractor (3.431 kW-h/batch and 18,109 kW-h/y). This is expected since electricity was used additionally for vessel heating during CAnys extraction in the extractor while correspondingly lower electricity was required for the operation of an ultrasonic transducer in the UAE extractor. However, the electricity demands for the grinder (P-2), centrifuge (P-4) and pump (P-7) are comparable for both technologies at batch production rate. The disparities in electricity demands by the grinder, centrifuge and pump per annum by HAE- and UAE-tBPs was as a result of the different annual number of batches observed for the two processes.
Table 6. Utility demands breakdown for 600 L capacity HAE- and UAE-tBPs
Although the total heating demands for HAE- and UAE-tBPs are comparable, UAE-tBP evaporator demanded higher amount of steam for evaporation of extracting solvent. The cooling demand for the UAE-based condenser was also higher than for HAE-tBP condenser. This is not surprising, since the UAE-tBP utilized a binary solvent mixture (46.1% ethanol) while HAE-tBP utilized pure solvent (water) for optimal extraction of CAnys. It is therefore expected that the thermodynamic properties of the two extracting solvents will vary widely. Further utility demand breakdown for other pieces of equipment (such as centrifuge and spray dryer) for both HAE- and UAE-tBPs are detailed in the table.
3.2. Costs and economic analysis of HAE- and UAE-tBPs
The process economics of the base cases of HAE and UAE-tBPs are less interesting due to the huge TCC (10,627,853 US$ for HAE-tBP and 11,212,062 US$ for UAE-tBP) and TOpC (3,287,401 US$/y for HAE-tBP and 3,313,547 US$/y for UAE-tBP) compared to relatively small annual production rate (2.49 kg CAnysP for HAE-tBP and 2.97 kg CAnysP for UAE-tBP), which imposed an exorbitantly high UPC (1,318,381.38 US$/kg CAnysP for HAE-tBP and 1,113,799.53 US$/kg CAnysP for UAE-tBP) on CAnysP. Therefore, efforts were made to analyze these technology-based processes at an industrial scale. The cost summary for TCC, DFC components (TPIC and TPDC), and TOpC for HAE- and UAE-tBPs at extractors capacity of 600 L is presented in . Other cost components of TCC, such as working capital and start-up costs are also detailed in the Table
Table 7. Cost summary for 600 L reactor capacity HAE- and UAE-tBPs
The PC, which served as a seed for the estimation of TCC components, is shown in , while major equipment requirements, sizes, and the number of units and respective costs for HAE- and UAE- tBPs are presented in . It is clear from that centrifuge was the only equipment required in multiples. The various equipment capacity needed in both HAE- and UAE-tBPs and their costs were determined by SuperPro Designer software according to material and energy balances in .
Table 8. Major equipment, size and number for 600 L reactor capacity HAE- and UAE-tBPs
The relatively higher PC for the UAE-tBP made all TCC components to be higher than the HAE-tBP counterparts. is the TCC components breakdown and PC for the HAE- and UAE-tBPs.
Figure 3. Total capital cost components for 600 L extractor capacity HAE- and UAE-tBPs
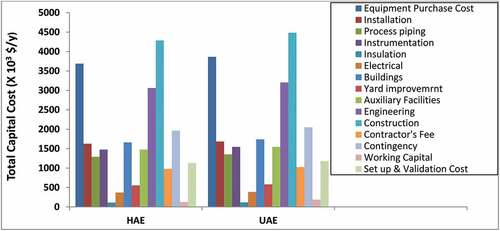
The major cost contributors for the TCC of both technologies were the construction, engineering, contingencies, auxiliary facilities, buildings, instrumentation, process piping, and installation costs. Working capital, yard improvement, electrical and insulation costs did not seem to contribute significantly to TCC in both technology-based processes.
also shows that TOpC for UAE-tBP (7,798,637 US$) was higher than HAE-tBP (6,916,886 US$). Analysis of the cost components and relative percentages of the TOpC of the two technologies is presented in . shows that higher TOpC for UAE-tBP largely originated from facility-dependent cost and huge material cost (about 52% more than HAE-tBP) which was a result of the high amount of ethanol used as part of the solvent mixture (991,019.998 kg/y) for UAE-tBP. HAE-tBP only utilized water with relatively lower cost compared to ethanol mixture. The HSC cost/y which was another part of material costs was lower for UAE-tBP because of the relatively lower annual HSC utilization by UAE-tBP (71,782 kg/y) compared to HAE-tBP (83,040 kh/y). The facility-dependent cost composed of the maintenance and repair cost, insurance, local taxes and factory expenses. The higher facility-dependent cost of UAE-tBP relative to HAE-tBP is expected since DFC of UAE-tBP (23,906,000 US$) was higher than HAE-tBP (22,903,000 US$) ().
Figure 4. Total operating cost components for 600 L extractor capacity (a) HAE-tBP and (b)UAE-tBP
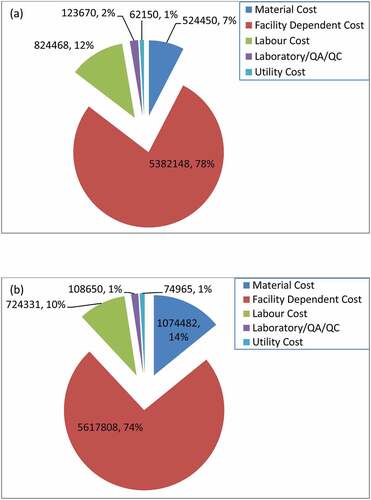
Other component that contributed to higher TOpC in UAE-tBP than HAE-tBP was utility costs. The utility cost composed of the electricity, heating, cooling and heat transfer agents costs. The utility cost was estimated based on the quantities displayed in . The labour and laboratory QA/QC costs of UAE-tBP were lower than the corresponding HAE-tBP. This observation is expected since the working hours of the labours were reduced compared to HAE-tBP due to the lower batch number observed in UAE-tBP and laboratory QA/QC was estimated as a fraction of labour cost. In both processes, the facility-dependent cost dominated the TOpC.
is the stack graphs of the TCC and TOpC of HAE- and UAE-tBPs. It is clear from the graphs that the TOpC of both processes was smaller than their corresponding TCC. The TOpC of HAE- and UAE-tBP was 28.61% and 30.07% of their respective corresponding TCC.
Figure 5. Production cost of 600 L extractor capacity HAE- and UAE-tBPs
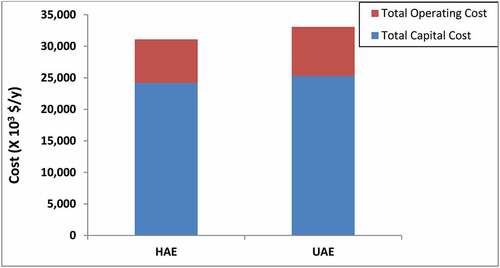
The cost-effectiveness of HAE- and UAE-tBP was judged by analysing the UPC of CAnysP produced using both technologies. Other authors have used similar indicators for the economic analysis of their processes (Mahmud & Rosentrater, Citation2019). The UPCs of CAnysP produced using HAE- and UAE-tBPs are shown in . The UPC of UAE-tBP (164.28 US$/kg CAnysP) was lower than HAE-tBP (176.31 US$/kg CAnysP) despite the higher TCC and TOpC of UAE-tBP making UAE-tBP more economically desirable. Although both TCC and TOpC were higher for UAE-tBP than HAE-tBP, the total CAnysP produced in UAE-tBP far outweighed HAE-tBP. For instance, on annual basis, HAE-tBP TCC and TOpC was 95.67% and 91.01% of UAE-tBP TCC and TOpC, respectively, however, the amount of CAnysP produced by HAE-tBP was 84.79% of CAnysP of UAE-tBP. This indicated that UAE-tBP although required higher TCC and TOpC than HAE-tBP, it produced CAnysP that was disproportionately higher than the HAE-tBP. This was as a result of the high yields of Anys and other solubles recorded in the UAE extractor during extraction of HSC.
However, in an investigation by Vieira et al. (Citation2013) to evaluate and compare economically, the agitated bed (similar to HAE) and ultrasound-assisted technologies of extracting natural antioxidants from jussara pulp (Euterpe edulis), a slightly higher cost of manufacturing was obtained for UAE at all investigated process conditions. The authors attributed this observation to a higher cost of ultrasonic extractor unit. It should however, be noted that the reported work modelled a semi continuous operation (consisting of three extractor units) at a capacity of 1000 L but did not evaluate and compare cost of manufacturing at optimum extraction parameters for both technologies. There was also no cost and technical variables sensitivity analysis conducted to ascertain and compare the certainty level of the reported results. Although the UPC of 176.31 US$/kg and 164.28 US$/kg obtained at plant capacity of 600 L for HAE-tBP and UAE-tBP respectively in this study compared well with their reported ranges of cost of manufacturing for agitated bed extraction (87.32–167.48 US$/kg) and UAE (90.57–165.43 US$/kg). A recent study on the economic evaluation of UAE and two conventional technologies (Soxhlet extraction and low pressure solvent extraction) for the extraction of anthocyanins from purple yam (Dioscorea alata) was conducted by Ochoa et al. (Citation2020). Optimum laboratory data were used for the base case design of respective processes and two 500 L extractors capacity were considered. Their result indicated that UAE (124.08 US$/kg) achieved lower cost of manufacturing compared to the investigated conventional technologies (263.65 US$/kg for Soxhlet extraction and 765.13 US$/kg for low pressure solvent extraction). Similar result of reduced cost of manufacturing for UAE over conventional extraction processes was reported by Veggi et al. (Citation2011) in their work on the economic evaluation of anthocyanin extraction from jabuticaba (Myrciaria cauliflora) skins by different extraction technologies. Their models were simulated using two 300 L extractors that operated semi continuously, the UAE recorded the lower cost of manufacturing of 401.21 US$/kg compared to the HAE of 422.18 US$/kg.
It is important to mention that studies on the economic assessment of extraction technologies of bioactive compounds from plant materials are scanty in the literature and the few available ones did not consider stochastic modelling and sensitivity analysis of the designed processes. However, in the course of the deterministic techno-economic analysis of a process, many of the variables employed for the evaluation of the technical and economic parameters have high tendencies to vary widely and these parameters can therefore have an ensemble of different outputs. The sensitivity and uncertainty analyses of a process do not only assist in process improvement but also in process and cost variables ranking which is of great importance in overall process optimization and engineering, however, this still remains a lacuna in the literature. It is also noteworthy that CAnysP obtained through UAE-tBP in this study was of higher quality (high % of anthocyanins) than the one obtained by HAE-tBP. This is an advantage because CAnysP from HSC produced via UAE-t will have more value in the market and will tend to attract higher selling prices.
3.3. Sensitivity and uncertainty analysis of technical and cost variables on UPC of 600 L UAE-tBP
yuUAE is a prospective industrial technology for the production of CAnysP from HSC and was found to achieve lower CAnysP-UPC compared to HAE-tBP and therefore was used in the uncertainty and sensitivity analyses. Technical and economic variables with tendencies to vary widely due to experimental conditions and market price instability were subjected to sensitivity and uncertainty analyses. Key variables considered were the ultrasound treatment time, Anys recovery, other soluble recovery, ultrasound extractor price and HSC purchase price. is the split view of UPC probability distribution, cumulative frequency, and reverse cumulative frequency curves. Data statistics and distribution models fitting are also displayed on the top and bottom right of the split viewgraph (). Beta model was found most suitable with an Anderson-Darling value of 0.2143 for the probability distribution of UPC. The UPC distribution has a definitely limited range with minimum and maximum of 148.18 US$ and 203.66 US$ per kg CAnysP, respectively.
Figure 6. Probability distribution of CAnysP-UPC for 600 L capacity UAE setup (100,000 trials)
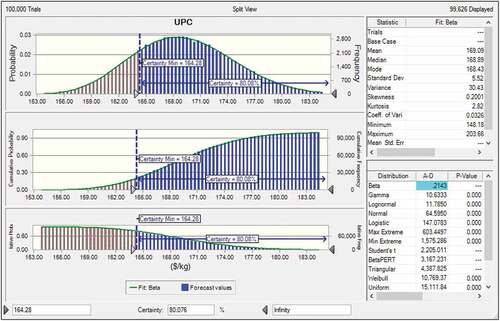
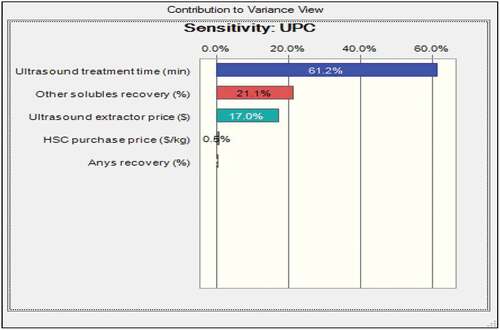
Figure shows that UPC probability distribution is normal with Skewness and Kurtosis of 0.2001 and 2.82, respectively. The mean, median and mode of the UPC distribution are 169.09, 168.89 and 168.43 US$, respectively, with a moderate variance of 36.49 US$. The certainty of obtaining the base case UAE-tBP UPC value of 164.28 US$/kg CAnysP was 80.08%. The dynamic sensitivity chart for the UAE-tBP UPC is presented in . It is clear from the figure that all investigated parameters had positive contributions to the variance in UAE-tBP UPC. The positive contributions observed in all the selected parameters indicated an increase in UAE-tBP UPC as these parameters increased. The ultrasound treatment time (min) contributed the most with +61.2% while Anys recovery (%) contributed the least (+0.2%) to the variance in UAE-tBP UPC. The other solubles recovery (%) contributed +21.1%, ultrasound extractor purchase price ($) contributed 17.0% while HSC purchase price (US$/kg) contributed +0.5% to the variance in UAE-tBP UPC.
Figure 7. Contribution of uncertain parameters to the variance in UPC
4. Conclusion
The HAE- and UAE-ts of CAnysP production from HSC were investigated and compared techno-economically to identify technology with the least CAnysP-UPC. Similar assumptions were made for the simulations of both HAE- and UAE-tBPs with differences, however, in the modelling of their respective extractor technicalities and peculiarities and their process conditions requirements for optimal CAnysP yield. Both technologies present interesting but challenging scenarios due to wide differences in their peculiarities, optimal process conditions, and cost variables. The HAE- and UAE-tBPs differ greatly in terms of material and energy demands and these further influenced their equipment sizing, specifications, and costing. However, based on all stated assumptions, the UAE-tBP achieved a lower CAnysP-UPC compared with the HAE-tBP largely because of higher quantities of CAnysP production by UAE-tBP. The quality (% Anys) of CAnysP produced by UAE-tBP was also higher than CAnysP produced via HAE-t. UAE-t is therefore a prospective and potential industrial technology for the production CAnysP from HSC at a reduced cost compared to the conventional HAE-t. Among the variables investigated for the uncertainty and sensitivity analyses of UAE-tBP, ultrasound treatment time (min) contributed the highest while Anys recovery (%) contributed the least to the variance in UPC, and 80.076% certainty was obtained for obtaining the base case UAE-UPC of 164.28 US$/kg CAnysP.
| Nomenclature | ||
| HSC | = | Hibiscus sabdariffa calyx |
| Anys | = | Anthocyanins |
| CAnys | = | Crude anthocyanins |
| CAnysP | = | Crude anthocyanins powder |
| HAE | = | Heat-assisted extraction |
| UAE | = | Ultrasound-assisted extraction |
| HAE-t | = | Heat-assisted extraction technology |
| HAE-tBP | = | Heat-assisted extraction technology-based process |
| UAE-t | = | Ultrasound-assisted technology |
| UAE-tBP | = | Ultrasound-assisted technology-based technology |
| HAE- and UAE-tBPs | = | Heat and ultrasound assisted extraction technology-based processes |
| PC | = | Equipment purchase cost |
| DFC | = | Direct Fixed Capital |
| TPIC | = | Total plant indirect cost |
| TPDC | = | Total plant direct cost |
| TOpC | = | Total operating cost |
| PIC | = | Plant Indirect Cost |
| MC | = | Miscellaneous Cost |
| CFC | = | Contractor’s Fees and Contingencies cost |
| UPC | = | Unit production cost |
| CAnysP-UPC | = | Crude anthocyanins powder unit production cost |
Acknowledgements
The authors wish to acknowledge the support provided by the Management of Landmark University, Nigeria for publishing this article.
Additional information
Funding
Notes on contributors
Oladayo Adeyi
Oladayo Adeyi bagged a doctoral degree in Chemical Engineering from Cape Peninsula University of Technology, South Africa. He has worked as a lecturer and researcher in both Nigerian and South African Universities and he is presently an academic staff of Michael Okpara University of Agriculture, Umudike Nigeria. Dr. Adeyi O has published research articles in many accredited peer reviewed outlets and has presented scientific papers both nationally and internationally. His areas of research interest include process system engineering, process design/synthesis and economics, food emulsion formulation, stability and rheological characterization.
Abiola Ezekiel Taiwo
Dr. Abiola Ezekiel Taiwo is a Lecturer and researcher in the Department of Chemical Engineering, Landmark University, Omu-Aran, Kwara State, Nigeria. He has published in reputational journals and books. His research interest spurs around bioprocessing and renewable energy, utilisation and vaporisation of biomass, modelling and simulation, process optimization, artificial intelligence, high pressure separation technology, techno-economic feasibility studies, data science and health.
References
- Alshekhli, O., Foo, D. C., Hii, C. L., & Law, C. L. (2011). Process simulation and debottlenecking for an industrial cocoa manufacturing process. Food and Bioproducts Processing, 89(4), 528–22. https://doi.org/10.1016/j.fbp.2010.09.013
- Arora, A., Banerjee, J., Vijayaraghavan, R., MacFarlane, D., & Patti, A. F. (2018). Process design and techno-economic analysis of an integrated mango processing waste biorefinery. Industrial Crops and Products, 116, 24–34. https://doi.org/10.1016/j.indcrop.2018.02.061
- Arumugam, A., Gopinath, K., Anuse, P., Shwetha, B., & Ponnusami, V. (2019). Kinetic modelling and techno-economic analysis of biodiesel production from Calophyllum inophyllum oil. Biomass Conversion and Biorefinery, 9(2), 363–378. https://doi.org/10.1007/s13399-019-00377-6
- Athimulam, A., Kumaresan, S., Foo, D. C. Y., Sarmidi, M. R., & Aziz, R. A. (2006). Modelling and optimization of Eurycoma longifolia water extract production. Food and Bioproducts Processing, 84(2), 139–149. https://doi.org/10.1205/fbp.06004
- Aurelio, D. L., Edgardo, R. G., & Navarro‐Galindo, S. (2008). Thermal kinetic degradation of anthocyanins in a roselle (Hibiscus sabdariffa L. cv.‘Criollo’) infusion. International Journal of Food Science & Technology, 43(2), 322–325. https://doi.org/10.1111/j.1365-2621.2006.01439.x
- Baral, N. R., & Shah, A. (2016). Techno-economic analysis of cellulosic butanol production from corn stover through acetone–butanol–ethanol fermentation. Energy & Fuels, 30(7), 5779–5790. https://doi.org/10.1021/acs.energyfuels.6b00819
- Carocho, M., Morales, P., & Ferreira, I. C. (2015). Natural food additives: Quo vadis? Trends in Food Science & Technology, 45(2), 284–295. https://doi.org/10.1016/j.tifs.2015.06.007
- Chemat, F., Rombaut, N., Meullemiestre, A., Turk, M., Perino, S., Fabiano-Tixier, A. S., & Abert-Vian, M. (2017). Review of green food processing techniques. Preservation, transformation, and extraction. Innovative Food Science & Emerging Technologies, 41, 357–377. https://doi.org/10.1016/j.ifset.2017.04.016
- Cissé, M., Bohuon, P., Sambe, F., Kane, C., Sakho, M., & Dornier, M. (2012). Aqueous extraction of anthocyanins from Hibiscus sabdariffa: Experimental kinetics and modeling. Journal of Food Engineering, 109(1), 16–21. https://doi.org/10.1016/j.jfoodeng.2011.10.012
- Cissé, M., Vaillant, F., Pallet, D., & Dornier, M. (2011). Selecting ultrafiltration and nanofiltration membranes to concentrate anthocyanins from roselle extract (Hibiscus sabdariffa L.). Food Research International, 44(9), 2607–2614. https://doi.org/10.1016/j.foodres.2011.04.046
- Da-Costa-Rocha, I., Bonnlaender, B., Sievers, H., Pischel, I., & Heinrich, M. (2014). Hibiscus sabdariffa L.–A phytochemical and pharmacological review. Food Chemistry, 165, 424–443. https://doi.org/10.1016/j.foodchem.2014.05.002
- Díaz-Bandera, D., Villanueva-Carvajal, A., Dublán-García, O., Quintero-Salazar, B., & Dominguez-Lopez, A. (2015). Assessing release kinetics and dissolution of spray-dried Roselle (Hibiscus sabdariffa L.) extract encapsulated with different carrier agents. LWT-Food Science and Technology, 64(2), 693–698. https://doi.org/10.1016/j.lwt.2015.06.047
- Huang, H., Long, S., & Singh, V. (2016). Techno‐economic analysis of biodiesel and ethanol co‐production from lipid‐producing sugarcane. Biofuels, Bioproducts and Biorefining, 10(3), 299–315. https://doi.org/10.1002/bbb.1640
- Intelligen Inc. (2014). SuperPro Designer‐User’s Guide.
- Lee, C. S., Chong, M. F., Binner, E., Gomes, R., & Robinson, J. (2018). Techno-economic assessment of scale-up of bio-flocculant extraction and production by using okra as biomass feedstock. Chemical Engineering Research & Design, 132, 358–369. https://doi.org/10.1016/j.cherd.2018.01.050
- Liazid, A., Guerrero, R. F., Cantos, E., Palma, M., & Barroso, C. G. (2011). Microwave assisted extraction of anthocyanins from grape skins. Food Chemistry, 124(3), 1238–1243. https://doi.org/10.1016/j.foodchem.2010.07.053
- Lim, S. S., & Foo, D. C. (2017). Simulation and scale-up study for a chitosan–TiO2 nanotubes scaffold production. Food and Bioproducts Processing, 106, 108–116. https://doi.org/10.1016/j.fbp.2017.09.002
- Mahmud, N., & Rosentrater, K. A. (2019). Techno-economic analysis of low moisture anhydrous ammonia (LMAA) pretreatment for butanol production from oil palm frond. Biomass Conversion and Biorefinery, 1–15. https://doi.org/10.1007/s13399-019-00564-5
- Nowacka, M., Tappi, S., Wiktor, A., Rybak, K., Miszczykowska, A., Czyzewski, J., ... & Tylewicz, U. (2019). The impact of pulsed electric field on the extraction of bioactive compounds from beetroot. Foods, 8(7), 244. https://doi.org/10.3390/foods8070244
- Ochoa, S., Durango-Zuleta, M. M., & Osorio-Tobón, J. F. (2020). Techno-economic evaluation of the extraction of anthocyanins from purple yam (Dioscorea alata) using ultrasound-assisted extraction and conventional extraction processes. Food and Bioproducts Processing, 122, 111–123. https://doi.org/10.1016/j.fbp.2020.04.007
- Owoade, A. O., Adetutu, A., & Olorunnisola, O. S. (2019). A review of chemical constituents and pharmacological properties of Hibiscus sabdariffa L. International Journal of Current Research in Biosciences and Plant Biology, 6(4), 42–51. https://doi.org/10.20546/ijcrbp.2019.604.006
- Pinela, J., Prieto, M. A., Pereira, E., Jabeur, I., Barreiro, M. F., Barros, L., & Ferreira, I. C. (2019). Optimization of heat-and ultrasound-assisted extraction of anthocyanins from Hibiscus sabdariffa calyces for natural food colorants. Food Chemistry, 275, 309–321. https://doi.org/10.1016/j.foodchem.2018.09.118
- Plotto, A. (1999). HIBISCUS Post-harvest Operation. Hibiscus: Post-Production Management for Improved Market access for Herbs and Spices. http://www.fao.org/fileadmin/user_upload/inpho/docs/Post_Harvest_Compendium_-_Hibiscus.pdf. (accessed, 28 August 2020)
- Prado, J. M., Veggi, P. C., & Meireles, M. A. A. (2017). Scale-up issues and cost of manufacturing bioactive compounds by supercritical fluid extraction and ultrasound assisted extraction. In Barbosa-Cánovas G. et al. (eds) Global food security and wellness (pp. 377–433). Springer. https://doi.org/10.1007/978-1-4939-6496-3_20
- Proestos, C., & Komaitis, M. (2008). Application of microwave-assisted extraction to the fast extraction of plant phenolic compounds. LWT-food Science and Technology, 41(4), 652–659. https://doi.org/10.1016/j.lwt.2007.04.013
- Quintero Quiroz, J., Naranjo Duran, A. M., Silva Garcia, M., Ciro Gomez, G. L., & Rojas Camargo, J. J. (2019). Ultrasound-assisted extraction of bioactive compounds from annatto seeds, evaluation of their antimicrobial and antioxidant activity, and identification of main compounds by LC/ESI-MS analysis. International journal of food science, 2019. https://doi.org/10.1155/2019/3721828
- Ramesh, M., & Muthuraman, A. (2018). Flavoring and coloring agents: Health risks and potential problems. In Natural and artificial flavoring agents and food dyes (pp. 1–28). Academic Press.
- Ramirez‐Rodrigues, M. M., Plaza, M. L., Azeredo, A., Balaban, M. O., & Marshall, M. R. (2011). Physicochemical and phytochemical properties of cold and hot water extraction from Hibiscus sabdariffa. Journal of Food Science, 76(3), C428–C435. https://doi.org/10.1111/j.1750-3841.2011.02091.x
- Rodríguez-Meizoso, I., Jaime, L., Santoyo, S., Cifuentes, A., Garcia-Blairsy Reina, G., Senorans, F. J., & Ibáñez, E. (2008). Pressurized fluid extraction of bioactive compounds from Phormidium species. Journal of Agricultural and Food Chemistry, 56(10), 3517–3523. https://doi.org/10.1021/jf703719p
- Salmerón-Ruiz, M. L., Domínguez-Avila, J. A., Ayala-Zavala, J. F., Alvarez-Parrilla, E., Villegas-Ochoa, M. A., Sáyago-Ayerdi, S. G., Valenzuela-Melendez, M., & González-Aguilar, G. A. (2019). Optimization of total anthocyanin content and antioxidant activity of a Hibiscus sabdariffa infusion using response surface methodology. Biotecnia, 21(2), 114–122. https://doi.org/10.18633/biotecnia.v21i2.937
- Santos, D. T., Veggi, P. C., & Meireles, M. A. A. (2010). Extraction of antioxidant compounds from Jabuticaba (Myrciaria cauliflora) skins: Yield, composition and economical evaluation. Journal of Food Engineering, 101(1), 23–31. https://doi.org/10.1016/j.jfoodeng.2010.06.005
- Savic Gajic, I. M., Savic, I. M., Gajic, D. G., & Dosic, A. (2021). Ultrasound-assisted extraction of carotenoids from orange peel using olive oil and its encapsulation in ca-alginate beads. Biomolecules, 11(2), 225. https://doi.org/10.3390/biom11020225
- Savic, I. M., & Gajic, I. M. S. (2020). Optimization of ultrasound-assisted extraction of polyphenols from wheatgrass (Triticum aestivum L.). Journal of Food Science and Technology, 57(8), 2809–2818. https://doi.org/10.1007/s13197-020-04312-w
- Savic, I. M., & Gajic, I. M. S. (2021). Optimization study on extraction of antioxidants from plum seeds (Prunus domestica L.). Optimization and Engineering, 22(1), 141–158. https://doi.org/10.1007/s11081-020-09565-0
- Shruthi, V. H., Ramachandra, C. T., Nidoni, U., Hiregoudar, S., Naik, N., & Kurubar, A. R. (2016). Roselle (Hibiscus sabdariffa L.) as a source of natural colour: A review. Plant Archives, 16(2), 515–522.
- Tsai, P. J., McIntosh, J., Pearce, P., Camden, B., & Jordan, B. R. (2002). Anthocyanin and antioxidant capacity in Roselle (Hibiscus sabdariffa L.) extract. Food Research International, 35(4), 351–356. https://doi.org/10.1016/S0963-9969(01)00129-6
- Veggi, P. C., Santos, D. T., & Meireles, M. A. A. (2011). Anthocyanin extraction from Jabuticaba (Myrciaria cauliflora) skins by different techniques: Economic evaluation. Procedia Food Science, 1, 1725–1731. https://doi.org/10.1016/j.profoo.2011.09.254
- Vieira, G. S., Cavalcanti, R. N., Meireles, M. A. A., & Hubinger, M. D. (2013). Chemical and economic evaluation of natural antioxidant extracts obtained by ultrasound-assisted and agitated bed extraction from jussara pulp (Euterpe edulis). Journal of Food Engineering, 119(2), 196–204. https://doi.org/10.1016/j.jfoodeng.2013.05.030