
 ?Mathematical formulae have been encoded as MathML and are displayed in this HTML version using MathJax in order to improve their display. Uncheck the box to turn MathJax off. This feature requires Javascript. Click on a formula to zoom.
Abstract
Improving the productivity of a manufacturing firm is very imperative in order to obtain high profits in such a competitive market. Equipment is an important part of a manufacturing system and its efficiency directly affects the quality and cost of the product contributing to overall productivity of a manufacturing plant. This paper focuses on calculating the overall equipment effectiveness (OEE) at a local pharmaceutical industry and investigates the key factors which influence the overall equipment effectiveness. OEE is an important tool which identifies areas that may have bottleneck in the production line, covering three major aspects such as the availability, performance, and quality rate of the output of equipment. On the basis of OEE, six significant losses were identified. The preliminary results of the analysis showed that OEE for the dry suspension (D/S) section is only 23% which is substantially below the benchmark of OEE level i.e. 85%. The results also presented that prime cause involves a high difference between the performance level of world class and dry suspension (D/S) process which is due to unavailability of machines for a longer period of time and malfunctioned machines producing products in large quantities that need to be reworked or scraped. In order to achieve the world class level of OEE, the performance level of dry suspension (D/S) process needs to be enhanced to 95%. A preventive maintenance strategy could be implemented in the industry in order to avoid inefficient practices and enhance the performance of the whole plant.
PUBLIC INTEREST STATEMENT
Overall Equipment Effectiveness (OEE) is a tool of Total Productive Maintenance (TPM) that can helps the organization to categorize the six big losses that are the reasons for poor performance and therefore can set the basis for root cause analysis. Improving the productivity of a manufacturing firm is very imperative to obtain high profits. Equipment is an important part of a manufacturing system and its efficiency directly affects the quality and cost of the product contributing to overall productivity of a company. In this research, the overall equipment effectiveness (OEE) tool is applied at a local pharmaceuticals industry and on the basis of which six significant losses were identified. The prime objective of this research study is to find out these key factors that will ultimately help the pharmaceuticals industry improve overall effectiveness of its equipment and productivity. The methodology and findings of this research study can be generalized to the pharmaceuticals industry and the productivity can be enhanced.
1. Introduction
Improving the productivity of a manufacturing firm is very imperative in order to obtain high profits in such a competitive market. Equipment is an important part of a manufacturing system and its efficiency directly affects the quality and cost of the product and overall productivity of a manufacturing plant. Maintenance has been contemplated as an important function which is non-productive as it does not add value to the product (Kapuyanyika & Suthar, Citation2018). However, all the equipment must operate efficiently in order to manufacture high quality products and cope with the demand (Nallusamy & Majumdar, Citation2017). The ultimate goal of every manufacturing firm is to produce quality goods and gain high profit through cost reduction. It can be achieved through implementation of an effective maintenance system. That maintenance system should be able to maximize availability of equipment by minimizing the machine downtime which is caused by unwarranted stoppages. The availability and productivity of manufacturing facilities have a direct impact on the competitiveness of manufacturing companies (Fleischer et al., Citation2006).
Most of the manufacturing firms are seeking to ameliorate and optimize the productivity of their manufacturing firms to remain competitive in increasing global market (Huang et al., Citation2003). This could be made possible by identifying the production losses that exists and implementing quality standards which will certainly lead to minimize repair work and cut down hidden costs and hence the products may be launched in the market with a competitive price. Mostly in the hidden operating cost, machine breakdowns on a continual basis, low availability of machines and increased overtime have extremely adverse effect on the productivity of a manufacturing plant. All these key performance indicators (KPIs) are due to the lack of an effective maintenance system. Therefore, need of an effective maintenance system for the plant is indispensable.
Availability and operational reliability of physical assets for preserving maximum quality balanced with safety levels and costs should be obtained and measured for performance improvement in maintenance (Gilabert et al., Citation2017). In recent times, manufacturing companies confronting capacity issues choose to expand extra time and buy new equipment or extend shifts. As an alternative approach, companies should choose to enhance the performance of their existing machines in order to improve reliability of equipment, operator performance and minimize idle time (Aman et al., Citation2018; Kapuyanyika & Suthar, Citation2018). The preamble discussion directs to the use of Overall Equipment Effectiveness (OEE) tool to enhance productivity of existing equipment.
1.1. Overall Equipment Effectiveness (OEE)
It is used to categorize the six big losses that are the reasons for poor performance and it therefore sets the basis for root cause analysis (Palanisamy & Vino, Citation2013). The six significant losses are categorized as follows.
1.1.1. Availability losses
It includes the breakdowns (time losses and quantity losses due to equipment failure or breakdown) and changeovers (losses due to production changeover from requirement of one batch to another).
1.1.2. Performance losses
It includes the idling and minor stoppages (losses due to production interruptions caused by temporary malfunction or when machines are idle) and reduced speed losses (losses that refer to the difference in machine design and actual operating speed).
1.1.3. Quality losses
It includes the defects and rework (losses caused when the production equipment is malfunctioned) and scrap (losses due to scrapped parts produced when machine is unstable in the start).
Overall equipment effectiveness consists of three components which are availability (Equationequation 1(1)
(1) ), performance (Equationequation 2
(2)
(2) ), and quality (Equationequation 3
(3)
(3) ) respectively;
Where;
Planned production time = Total available time—Schedule downtime
Operating time = Total available time—(Scheduled downtime + unscheduled downtime)
Good pieces = Total pieces—total scrap
Ideal run rate = no. of parts produced per minute or hour
Overall equipment effectiveness (OEE) = Availability x Performance x Quality
Losses due to availability (i.e. breakdowns, changeovers), performance (i.e. stoppages, reduced speed) and quality (i.e. defects, scrap) are the major concern in production facilities. Local industry is not using the lean approaches to identify these losses that impact their production and incurred a significant cost.
Breakdown loss is one of the major issues in manufacturing industries. To manage production at a sustainable level, a pragmatic study through application of effectiveness techniques must be conducted to identify the losses in a production line & its maintenance issues.
The novelty of this research is to calculate the overall equipment effectiveness (OEE) at a local pharmaceutical industry and investigates the key factors which influence the overall equipment effectiveness. On the basis of OEE, six significant losses were identified. The rest of this paper is organized as follows: section II describes the literature review and presents an overview of the approaches used. Section III presents the proposed methodology. Section IV discusses the case company and the process flow chart of their production system. Section V shows the production analysis using total production maintenance approach. This section also includes the cost analysis of the production system. Section VI discusses the significance of the proposed approach, interpretation of the results, and recommendations for productivity improvement. Finally, section VII summarizes and concludes the paper.
2. Literature review
2.1. Overall Equipment Effectiveness (OEE)
OEE measures the total equipment performance which is the degree to which the equipment is doing, what it is supposed to do (Williamson, Citation2006). OEE is an important tool which identifies areas that may have bottleneck in the production line (Omega & Andika, Citation2017), covering three major aspects such as the availability, performance, and quality rate of the output of equipment. OEE is considered as one of the important content for total productive maintenance (TPM) and lean manufacturing philosophy (Lin et al., Citation2017). Additionally, it is an important metric for measuring the success of manufacturing improvement approach known as Total Productive Maintenance (TPM) (Nakaiima, Citation1988). TPM is an innovative Japanese concept that is mostly followed for optimizing equipment effectiveness, breakdowns elimination and promoting autonomous maintenance in day to day activities involving total workforce (Mahajan et al., Citation2018). It usually seeks to maximize the effectiveness of the equipment during its entire life. TPM consists of three words (Fam et al., Citation2018); Total: means involving the entire workforce from top to bottom in equipment maintenance. Productive: means to ensure that the operation is efficient maintenance problems/costs. Maintenance: ensuring that the equipment is in good condition.
In any manufacturing industry it is essential to implement TPM approach due to significant impact and relationship with manufacturing performances in terms of overall equipment effectiveness (OEE).
Currently, manufacturing companies are developing alternatives to address capacity problems such as extra shifts and purchasing new equipment. An alternative approach is suggested by (Aman et al., Citation2018) to enhance the performance of their existing equipment in order to improve the machines reliability, operator’s performance and eliminating or reducing idle times. In this regard, the overall equipment effectiveness has gained much more focus in the recent past. In a study (Goriwondo et al., Citation2011) the applications of TPM principles are revealed to improve the OEE level in a pharmaceutical industry in which the ABC analysis of the equipment is performed in order to establish the critical equipment requiring 20% attention thereby yielding 80% results. TPM pillars were implemented for the root cause analysis of major losses related to equipment and the results showed a significant increase in the OEE level of the plant. In another study (Palanisamy & Vino, Citation2013), the OEE concepts are implemented in shop floor in a process industry by considering the three parameters of OEE. An IT integrated system was built to record the OEE losses in order to investigate the bottleneck equipment and a manufacturing execution system (MES) and a communication system was integrated into an automated data collection (ADC) system for the collection of data. To improve the OEE of the shop floor, different tools were suggested such as single-minute exchange of dies (SMED), preventive maintenance, and extension of time (EOT) and it was found that through implementation of these tools, the downtime was considerably reduced to 29 hours from 31 hours which resulted in enhanced productivity, effective utilization of factory floor space and optimized production data without interference of bottleneck operations. Another study (Aman et al., Citation2018) revealed some of the applications of OEE for enhancing the productivity of production line in a pharmaceutical industry by investigating machine failure, imbalanced posts, and defective parts and using Analyze des Modes de Défaillance, de Leurs Effets et de Leur Criticité (AMDEC) tool in order to balance the assembly line and enhancing the availability of bottleneck. The efficiency of the assembly line was increased from the value targeted by the company using the OEE approach. The impact of implementation of three pillars of TPM in a die attached equipment in a semiconductor industry was addressed in a study (Fam et al., Citation2018) in which a pair mean analysis was carried out for finding the impact of TPM elements and OEE and it was observed that there is a significant increase in the OEE level of the plant due to which the productivity and quality of the products are also improved to a very large extent. A new performance ratio strategy has been used in a study (Keyser & Sawhney, Citation2013) to improve the OEE of the plant by cycle time limitation reduction. Losses related to equipment could be eliminated through implementation of TPM which will also improve the three pillars of OEE and as a result the OEE of the plant would be enhanced. Two methods of time study were applied in a study (Arunraj & Maran, Citation2014; Nallusamy & Majumdar, Citation2017; Patel & Thakkar, Citation2014) to improve the OEE of an autoclave process in an aerospace industry in which direct stopwatch time study was conducted first in order for the present OEE standards to be evaluated and then the Maynard’s Operation Sequence Technique (MOST) was applied to evaluate the percent improvement in OEE.
An application of OEE is revealed in a study (Soltanali et al., Citation2018) in which the performance measurement has been investigated using the OEE metric in an Iranian automotive industry. The data and basic information was collected from the computerized maintenance management system (CMMS) about the two different assembly lines, i.e. Peugeot and Sports Utility Vehicle (SUV) and the equipment with the most failures on the assembly line for Peugeot and SUV were evaluated in order to improve the equipment performance. The results of the study revealed that the availability index can be improved by 8 and 9 percent respectively for the two assembly lines while the other two indexes were found lower than the desired value. It was recommended to manage the production losses time and to implement the TPM strategy to improve the OEE of the industry. In another study (Abdul Rasib et al., Citation2019) the Single Minutes Exchange of Dies (SMED) technique has been used to improve the OEE and operational efficiency of an automotive industry. The results of the study revealed that the OEE of the industry has been increased by 2.7% after converting the internal activities to external activities for jigs change that were consuming a lot of time. Failure mode and effect analysis (FMEA) and Define, Measure, Analyze, Improve and Control (DMAIC) strategies have been used in a study (Rozak et al., Citation2020) for enhancing the OEE of a cylinder block machining line in an Indonesian automotive industry. In the define phase of the DMAIC strategy, the initial problem at the cylinder block assembly line was identified. In the measure phase, the Pareto diagram was used to show the data collected about the equipment failure based on long time breakdown and frequent machine breakdowns. In the analyze phase the focused group discussion was used to analyze the machine that was ranked second in the Pareto diagram as longest breakdown machine. Ishikawa diagram was used to find the root cause of each problem in the Improve phase while additional critical components check point and feedback system were implemented in the control phase which impacted to reduce the machine breakdown time thereby enhancing the equipment availability. The results of the study revealed that using the FMEA and DMAIC strategies have increased the OEE of the cylinder block machining line from 87% to 92%.
OEE is an important tool that highlights the areas that may have bottlenecks in the production line and require some maintenance. Basically maintenance can be divided as shown in ;
Figure 1. Types of maintenance
Breakdown maintenance means repairing of equipment after failure has occurred in functionality. No attempt is made to prevent the machine from breaking down in such type of maintenance approach (Rizvi et al., Citation2018). It has a huge disadvantage of disruption of production plants.
Planned maintenance is an organized type of maintenance approach under which work is planned before hand to avoid random failures (Rizvi et al., Citation2018). A thorough study is to be carried out in order to decide the periodicity of maintenance work. This type of maintenance is further divided into three categories as;
In schedule maintenance system the actual maintenance program is planned in accordance with the production department, in order to make the relevant equipment available for maintenance work. The frequency of such maintenance work is predetermined from workforce experiences in order to utilize the ideal time of the equipment effectively (Rizvi et al., Citation2018). Due to such type of maintenance system, the availability of the equipment is enhanced although it is costly compare to breakdown maintenance.
Preventive maintenance system consists of routine activities such as inspection, detection, and correction of incipient failures prior to their occurrence. It is further classified as periodic (time based servicing, parts replacement or overhaul), predictive (surveillance, monitoring, testing, in-service inspection) and planned (condition based servicing, parts replacement, overhaul, refurbishment, modification) maintenance. Its main objective is to improve equipment productive life, eliminate or reduce breakdowns, minimize production losses as a result of equipment failures, and to ensure in health and safety of workers (Rizvi et al., Citation2018). Some of the elements of preventive maintenance are routine attention, routine examination, preventive replacement, and inspection measurements. Implementing this type of maintenance system is costly as deteriorated parts are replaced during inspection however; this cost is compensated by the prolonged operational life of the equipment.
Corrective maintenance means carrying out remedial actions when failures or deficiencies are discovered during preventive maintenance to repair equipment or item to its operational state (Rizvi et al., Citation2018). It is a type of unscheduled maintenance. This type of maintenance is divided into the following categories such as fail-repair, salvage, rebuild, overhaul, and servicing.
An effective way of minimizing system downtime and corresponding maintenance costs is to determine an optimal maintenance strategy (Daneshkhah et al., Citation2017). Corrective maintenance (CM) and preventive maintenance (PM) are the two widely used maintenance strategies. It is very challenging to identify an optimal preventive maintenance decision that targets the best balance between these types of maintenance and which tends to minimize the overall maintenance costs.
A number of publications on overall equipment effectiveness (OEE) addressed the different issues related to maintenance in different industries. However, a little attention has been paid to identification of the different key factors that contributed towards these issues in the pharmaceuticals industry. The novelty of this research is to find out these key factors that will ultimately help the pharmaceuticals industry improve overall effectiveness of its equipment and productivity.
3. Methodology
Referring to , the research process consists of several steps. First, a detailed study was conducted about the manufacturing processes of the proposed industry to know about the existing problems. It has been observed that the industry is a traditional manufacturing based industry with no consideration of improving the production processes. The problems identified were in the production of dry suspension products. After a detailed review, the data was collected about the dry suspension section for possible improvement and analyzed using the OEE and cost analysis was carried out for comparison. Based on these observations several suggestions and recommendations were given to the said industry for making necessary improvements.
Figure 2. Research methodology
4. Introduction to case company
The industry is a pharmaceutical industry with different production sections (as seen in ) that produce variety of products such as injectable and oral penicillin, syrup, capsule, tablets, and dry suspensions. Unfortunately, the industry is having a problem in Dry Suspension (D/S) section in meeting the demand and delivery of the products to customers on time. Careful analysis of the D/S section reveals that this problem is due to the increasing rate of wastes produced during production processes and lack of a proper maintenance system. The company is lacking proper maintenance system to be employed at the shop floor. Firstly, machines are not capable of producing the desired quantity of products as a result of high quantity wastes and low availability rate of machines. Secondly, machines breakdown rate is very high due to improper maintenance plan. An attempt has been made to calculate the overall equipment effectiveness of all machines working in the dry suspension section and identify the six big losses which tend to decrease the OEE of the D/S section.
Figure 3. Plant layout showing different departments
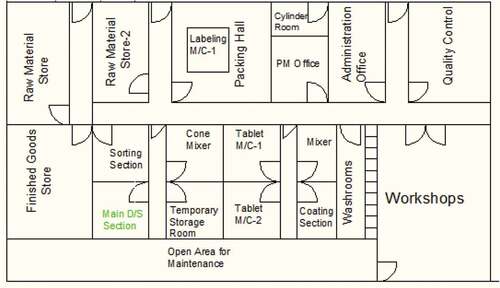
Referring to , the dry suspension production begins with raw material (empty bottles) coming from raw material store which are inspected in sorting room for any necessary actions. The sorted bottles are then kept at temporary storage in shippers near to the main dry suspension section. In the main D/S section the raw material in powder form are poured in the sorted empty bottles and are then sealed immediately on the sealer. The sealed bottles are then moved to the labeling section on the first floor using a lift. When the bottles are labeled, they are moved to the packing hall on the ground floor for packaging along with prescription and are then shifted to the finished goods store.
Figure 4. Process flowchart for the dry suspension section
5. Production analysis using total productive maintenance approach
Overall equipment effectiveness (OEE) was calculated based on the data collected for the three different machines, i.e. filling, sealing, and labeling machines. The data was collected for the four different batches produced during two months. The machines are operated for 7 hours per shift with one shift a day.
5.1. Production analysis on filling machine
The empty bottles that have been sorted in the sorting section are brought to the filling machine section and are filled with dry suspension powder. Filling machine has a capacity of 12 bottles per minute that are filled with powder. Two workers are needed for filling operation, operating the two hoppers at a time .
Table 1. Summary of work done by various researches (Abdul Rasib et al., Citation2019; Aman et al., Citation2018; Braglia et al., Citation2008; Fam et al., Citation2018; Huang et al., Citation2003; Kapuyanyika & Suthar, Citation2018; Kumar et al., Citation2014; Palanisamy & Vino, Citation2013; Puvanasvaran et al., Citation2013; Samad & Hossain, Citation2012; Soltanali et al., Citation2018)
The data for filling machine is explained as;
No. of bottles filled per minute = 12 bottles/min
Total available time = 7 hrs/shift x 1 shift/day x 5 days/week = 35 hrs/week = 35 x 60 = 2100 min/week.
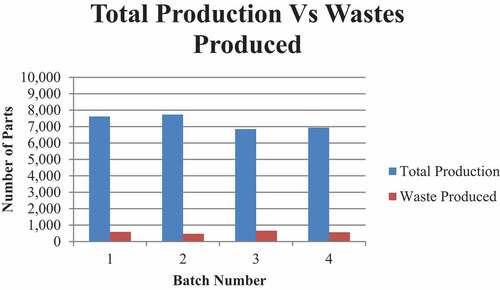
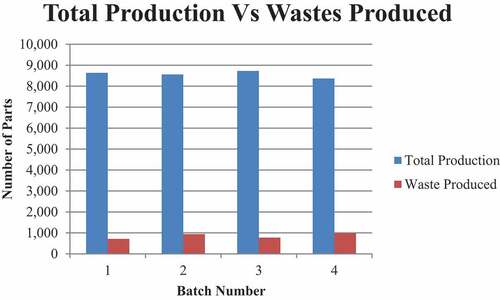
In , the data for four batches is given among which two are for Lactowit and two are for Bocef. Batch size for each Lactowit is 8200 parts and for each Bocef 250 mg, batch size is 7500 parts. Products produced in first batch of lactowit 100 mg are 7617 which is a waste of 583 products, while second batch produces 7729 parts out of 8200 which is a waste of 471 parts. Similarly, from first batch Bocef 250 mg 655 parts are wasted that produces 6845 good parts and from second batch 565 parts are wasted to give 6935 good parts from filling machine.
Table 2. Data for filling machine for four batches
Overall equipment effectiveness = A x P x Q = 86 x 33 × 92 = 26%
This gives total of 31,400 parts from both batches per day where 29,126 parts are produced and 2,274 are wasted. shows the bar graph between total production and waste produced from filling machine which shows batch 2 of Lactogen produces less waste which is 471 as compared to first that is 583. Similarly, batch 2 of Bocef produces less waste that is 565 than first batch which is 655.
Figure 5. Total production and wastes produced on filling machines
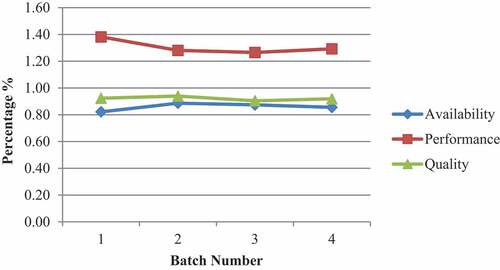
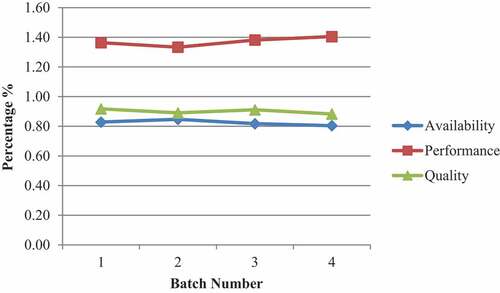
shows that availability, performance, quality and overall equipment effectiveness of filling machine which is calculated from values of . Each line in graph shows the availability, performance, and quality for all the four batches. Performance of first batch is the highest among all batches, i.e. 1.38 and third batch the lowest performance that is 1.27. Quality of second batch is the highest which is a value of 0.94 and thirst batch gives the least value of 0.90. While among availability second batch gives highest value of 0.89 and first batch gives least value of 0.82.
Figure 6. Performance measures for filling machines
5.2. Production analysis on sealing machine
The bottles that are filled with dry suspension powder in the filling section are then moved to the sealing machine through a conveyor belt for sealing. The sealing machine has a capacity of 44 bottles per minute. Two workers are required for the sealing operation with one putting caps on the bottles while the other one operating the sealing machine.
The data for sealing machine is explained as;
No. of bottles sealed per minute = 44 bottles/min.
Total available time = 7 hrs/shift x 1 shift/day x 5 days/week = 35 hrs/week = 35 x 60 = 2100 min/week.
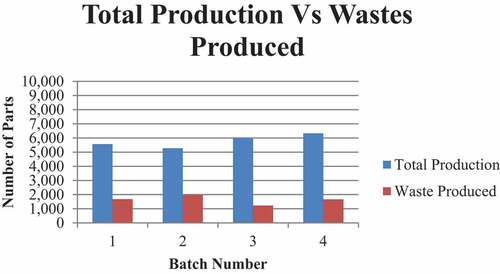
shows data for sealing machine where three batches of Clariwitt and one batch of Lomoxy is sealed. For each batch of Clariwitt contains 7250 tablets, first three batches produce 5569, 5274 and 6021 giving a waste of 1681, 1976 and 1229. Fourth batch produces 6334 out of 8000 giving a waste of 1666.
Table 3. Data for sealing machine for four batches
Overall equipment effectiveness = A x P x Q = 76 x 33 × 72 = 18%.
shows bar graph for all the four batches production and its wastes. Graph shows that batch four Lomoxy 125 mg production of good parts is the highest in a total batch of 8000 while among 3 batches of Clariwitt 120 mg highest production of good parts among 7250 is for batch 3 that is 6021 giving least waste of 1229.
Figure 7. Total production and wastes produced on sealing machines
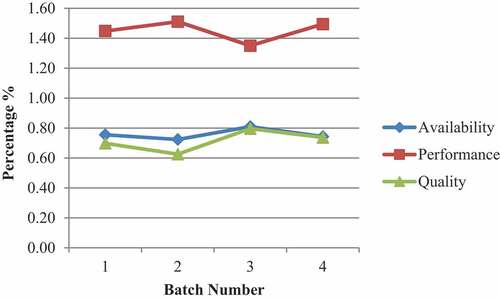
refers to the formulas calculation above for availability performance and quality of batches produced from sealing machine. Performance for batch 2 is highest that is 1.51 and batch 3 is least that is 1.35. Availability for batch 3 is highest which are 0.81, and least value for batch 2 that is 0.72. Similarly, for quality of batches batch 3 gives highest value of 0.80 and least value for 0.63 is produced for batch 2.
Figure 8. Performance measures for sealing machines
5.3. Production analysis on labeling machine
The filled/sealed bottles are then moved to the labeling section using trolleys and a lifter for labeling. Here the bottles are labeled according to the required product name. This labeling machine has a capacity of 60 bottles per minute. One worker is required to operate the labeling machine.
The data for labeling machine is explained as;
No. of bottles labeled per minute = 60 bottles/min
Total available time = 7 hrs/shift x 1 shift/day x 5 days/week = 35 hrs/week = 35 x 60 = 2100 min/week
shows data for labeling machine where first and fourth batch is Liqmol 125 mg and second and third batch is Sporcef 250 mg. Liqmol has a batch size of 9350 while Sporcef is 9500. The batches produce wastes with first batch producing 715, second batch produces 941, third 777 and last batch produces 983.
Table 4. Data for labeling machine for four batches
Overall equipment effectiveness = A x P x Q = 82 x 34 × 90 = 25%
shows production vs. wastes. Among Liqmol first batch produces more products as compared to fourth, while Sporcef is produced in greater quantity in third batch. Similarly waste produced at batch one is least among all.
Figure 9. Total production and wastes produced on labeling machines
The performance for labeling machine is highest for fourth batch with value of 1.40. Quality in best produced in batch one i-e 0.92 and least in fourth batch that is 0.88. Availability of labeling machine is highest for batch 2 that is a value of 0.85 and least for batch four that is 0.80 .
Figure 10. Performance measures for labeling machine
Losses in the production system have a direct impact on the costs, so it is imperative to calculate the costs due to wastes produced.
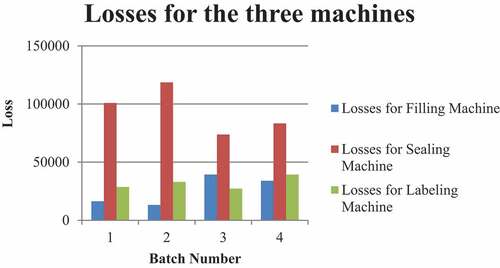
shows the losses that are resulted from the three machines (filling, sealing, and labeling) during the production of twelve (12) batches. It can be clearly seen that the losses on the labeling machine are small as compared to the losses on the other two machines. Moreover, the wastes produced on the sealing machine are high in number and therefore, it has resulted in very huge loss. This is because little or no attention has been paid to the maintenance of sealing machine.
Table 5. Total loss from 12 batches on three machines
shows bar graph between batches and their losses. Batch 3 produces maximum loss or waste for sealing machine. Losses for filling machine and labeling machine are less comparatively. Sealing machine gives highest values for waste in all four batches.
Figure 11. Losses resulted from 12 batches on the three machines
6. Discussion
The production performance of the whole dry suspension section is determined by the key equipment in the three sub-sections, i.e. filling, sealing, and labeling. The performance of these key equipment is controlled by OEE level of the whole dry suspension section. From the data collected and analyzed for the Dry Suspension section of the pharmaceutical company, it was observed that the OEE for the section was about 23% which is 10% as a whole as shown in . This OEE is far lower than the advanced maintenance level of TPM. Referring to , the quality and availability percentage indexes of filling and labeling machines are somewhat approaching the standard levels of TPM. However; in case of sealing machine, all the three performance indexes are far lower than the standard levels. The performance of all of the three machines is relatively stable however; is very low as compared to the other two performance indexes.
Figure 12. Effectiveness index for the dry suspension section
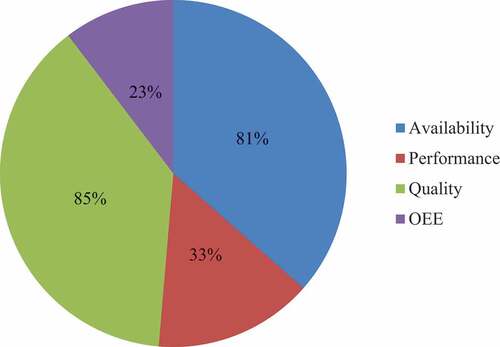
Figure 13. Effectiveness index for the three machines
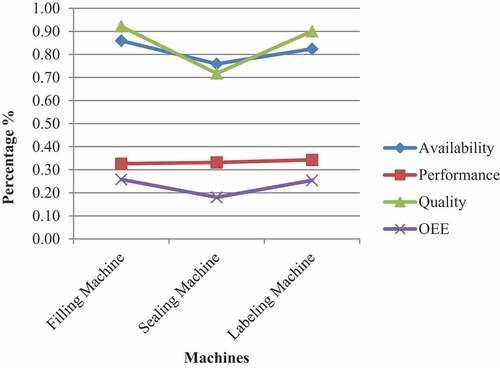
The availability, performance, and quality rate for filling machine are 86%, 33%, and 92% respectively and it has resulted in OEE of 26%, which is very low. This low level of OEE is mainly due to the low level of performance percentage. For the sealing machine, the availability, performance, and quality rates are 76%, 33%, and 72% respectively and it has resulted in OEE level of 18%. It can be clearly seen that this low level of OEE for the sealing machine is mainly affected by all the three performance indicators. In case of labeling machine, the availability, performance, and quality indexes are 82%, 34%, and 90% respectively. The OEE level for this machine is 25% which is very low and is mainly affected by performance.
The world class OEE level for one type of product with fixed speed and one or two characteristics is as follows: percent availability ≥95%, performance percentage ≥95%, quality percentage ≥99.95%, and OEE ≥85% (Muchiri & Pintelon, Citation2008).
As shown in , there is so much distance in world class OEE and dry suspension process OEE. This is mainly due to the high difference between the performance level of world class and D/S process. In order to achieve the world class level of OEE, the performance level of D/S process has to be enhanced to 95%.
Table 6. Comparison of world class OEE and dry suspension OEE
There are several reasons for the low level of availability, performance, and quality of dry suspension process. First, the equipment needs some time to be set up. The equipment needs to be temporarily shut down for the raw material to be fed in during the production process on filling machine. Secondly, during the sealing process, the unqualified products need to be reworked, so the loss which inherently belongs to quality percentage is counted on to the availability loss. In addition, there is no proper maintenance system which leads to the production of unacceptable quality products. The maintenance strategy which is being followed in the industry is breakdown maintenance strategy. The machine is only repaired/maintained, when some failure occurs. This approach leads to unavailability of machine for longer periods of time.
It is recommended that the industry should follow preventive maintenance (Predictive) strategy rather breakdown maintenance in order to avoid these problems. By following preventive maintenance (Predictive), the performance, safety and life of equipment will be improved. Moreover, the equipment downtime will be decreased, the number of major repairs will be reduced and the rate of scraps due to poorly maintained machinery will be lowered. Also by implementing the Total productive maintenance program (TPM), the sense of ownership to the machine operators will grow and they will take care of equipment by their own and they will be trained for basic maintenance operations. All these factors will lead to improve the efficiency and effectiveness of the dry suspension (D/S) section.
7. Conclusion and future work
The case company failed to adequately control the dry suspension section whose OEE level was calculated to be 23 percent which is lagging behind the world class level of 95 percent. Dry suspension section has three machines; sealing, filling, and labeling machines that were discussed in the paper. Performance indicators that are Availability, Quality and Performance were calculated for the three machines in order to calculate the OEE. Analysis of the results found that Performance of the machines is relatively stable as compared to quality and availability. Studies suggest that machines unplanned downtime is causing huge losses that are calculated to be 607,222 PKR.
The industry’s current breakdown maintenance strategy is found responsible to the unavailability of production machines for longer periods of time. The machines poor maintenance produce defective parts that lead to low quality rate of sealing machine. In order to address this short coming, it is suggested that TQM tools to be considered in order to reach world class OEE level, improve the quality of the products produced and reduce maintenance/breakdown time. As this OEE tool is only applied to assess the efficiency and effectiveness of Dry suspension section of the said industry. A future work of this research could be to apply the OEE analysis to assess and improve the efficiency of the whole production plant.
Cover Image
Source: Author.
Additional information
Funding
Notes on contributors

Muhammad Zubair
Engr. Muhammad Zubair is currently a PhD student at the Department of Industrial Engineering, University of Engineering & Technology, Peshawar, Pakistan. He is also working as a Lab Engineer at the Department of Industrial Engineering, UET Peshawar, Jalozai Campus for the last four years. Before that, he has also worked as a Production Engineer at Lowitt Pharmaceuticals Pvt. Ltd. Peshawar where he gained experience of applied engineering problems. He has almost 6 years of teaching, research and administrative experience. His research interest includes Materials Engineering, Additive Manufacturing, Human Factors and Ergonomics, Quality Control and Manufacturing Systems Design.
References
- Abdul Rasib, A. H., Ebrahim, Z., Abdullah, R., & Rafaai, Z. (2019). Improvement of Overall Equipment Effectiveness through application of single-minute exchange of die in automotive manufacturing. Test Engineering and Management, 81, 3650–23.
- Aman, Z., Ezzine, L., Fattah, J., Lachhab, A., & Moussami, H. E. (2018). Improving efficiency of a production line by using overall equipment effectiveness: A case study.
- Arunraj, K., & Maran, M. (2014). A review of tangible benefits of TPM implementation.
- Braglia, M., Frosolini, M., & Zammori, F. (2008). Overall equipment effectiveness of a manufacturing line (OEEML) An integrated approach to assess systems performance. Journal of Manufacturing Technology Management, 20(1), 8–29. https://doi.org/10.1108/17410380910925389
- Daneshkhah, A., Stocks, N. G., & Jeffrey, P. (2017). Probabilistic sensitivity analysis of optimised preventive maintenance strategies for deteriorating infrastructure assets. Reliability Engineering & System Safety, 163, 33–45. https://doi.org/10.1016/j.ress.2017.02.002
- Fam, S.-F., Loh, S. L., Haslinda, M., Yanto, H., Khoo, L. M. S., & Yong, D. H. Y. (2018). Overall Equipment Efficiency (OEE) enhancement in manufacture of electronic components & boards industry through total productive maintenance practices. MATEC Web of Conferences, EDP Sciences.
- Fleischer, J., Weismann, U., & Niggeschmidt, S. (2006). Calculation and optimisation model for costs and effects of availability relevant service elements. Proceedings of LCE, 675–680.
- Gilabert, E., Fernandez, S., Arnaiz, A., & Konde, E. (2017). Simulation of predictive maintenance strategies for cost-effectiveness analysis. Proceedings of the Institution of Mechanical Engineers, Part B: Journal of Engineering Manufacture, 231(13), 2242–2250. https://doi.org/10.1177/0954405415578594
- Goriwondo, W. M., Mhlanga, S., & Kazembe, T. (2011). Optimizing a production system using tools of total productive maintenance: Datlabs pharmaceuticals as a case study.
- Huang, S. H., Dismukes, J. P., Shi, J., Su, Q., Razzak, M. A., Bodhale, R., & Robinson, D. E. (2003). Manufacturing productivity improvement using effectiveness metrics and simulation analysis. International Journal of Production Research, 41(3), 513–527. https://doi.org/10.1080/0020754021000042391
- Kapuyanyika, M., & Suthar, K. (2018). To improve the overal equipment effectiveness of wheel surface machining plant of railway using total productive maintenance.
- Keyser, R. S., & Sawhney, R. S. (2013). Reliability in lean systems. International Journal of Quality & Reliability Management, 30(3), 223–238. https://doi.org/10.1108/02656711311299818
- Kumar, S. V., Mani, V., & Devraj, N. (2014). Production planning and process improvement in an impeller manufacturing using scheduling and OEE techniques. Procedia Materials Science, 5, 1710–1715. https://doi.org/10.1016/j.mspro.2014.07.360
- Lin, L., Xiu, H., Yunfei, W., & Guangchao, W. (2017). Research on Overall Equipment Effectiveness for cigarette equipments based on data mart and data mining. DEStech Transactions on Engineering and Technology Research(apetc), (apetc). https://doi.org/10.12783/dtetr/apetc2017/11291
- Mahajan, U. K., Adatiya, P., Badhe, P., Patsute, A., & Bhusnar, A. (2018). Total productive maintenance to improve Overall Equipment Effectiveness. Global Journal of Research in Engineering.
- Muchiri, P., & Pintelon, L. (2008). Performance measurement using overall equipment effectiveness (OEE): Literature review and practical application discussion. International Journal of Production Research, 46(13), 3517–3535. https://doi.org/10.1080/00207540601142645
- Nakaiima, S. (1988). Introduction to Total Productive Maintenance (TPM). Productivity Press.
- Nallusamy, S., & Majumdar, G. (2017). Enhancement of overall equipment effectiveness using total productive maintenance in a manufacturing industry. International Journal of Performability Engineering, 13(2), 01–16.
- Omega, D., & Andika, A. (2017). Improving overall equipment effectiveness using CPM and MOST: A case study of an Indonesian pharmaceutical company. IOP Conference Series: Earth and Environmental Science, IOP Publishing.
- Palanisamy, V., & Vino, J. A. (2013). Implementing overall equipment effectiveness in a process industry. Indian Journal of Science and Technology, 6(6), 4789–4793. https://doi.org/10.17485/ijst/2013/v6isp6.17
- Patel, V. B., & Thakkar, H. R. (2014). Review study on improvement of overall equipment effectiveness through total productive maintenance. Journal of Emerging Technologies and Innovative Research, 1(7), 720–726.
- Puvanasvaran, A., Mei, C., & Alagendran, V. (2013). Overall equipment efficiency improvement using time study in an aerospace industry. Procedia Engineering, 68, 271–277. https://doi.org/10.1016/j.proeng.2013.12.179
- Rizvi, M. W., Rai, A. S., Pawar, R., & Tripathi, A. (2018). Preventive maintenance procedures for improving plant efficiency: A review.
- Rozak, A., Jaqin, C., & Hasbullah, H. (2020). Increasing Overall Equipment Effectiveness in automotive company using DMAIC and FMEA method. Journal Européen des Systèmes Automatisés, 53(1), 55–60. https://doi.org/10.18280/jesa.530107
- Samad, M. A., & Hossain, M. R. (2012). Analysis of performance by overall equipment effectiveness of the CNC cutting section of a Shipyard.
- Soltanali, H., Rohani, A., Tabasizadeh, M., Abbaspour-Fard, M., & Aditya, P. (2018). Improving the performance measurement using Overall Equipment Effectiveness(OEE) in an automotive industry. Automotive Engineering International.
- Williamson, R. (2006). Using Overall Equipment Effectiveness: The metric and the measures. StrategicWork Systems. Inc.