
 ?Mathematical formulae have been encoded as MathML and are displayed in this HTML version using MathJax in order to improve their display. Uncheck the box to turn MathJax off. This feature requires Javascript. Click on a formula to zoom.
Abstract
Traffic incidents can create major non-recurring congestion and have the potential to be fatal. Traffic Engineers and researchers have worked vigorously to reduce and prevent traffic crashes and make roadways safer. Secondary crashes are collisions that have taken place inside of incident scene or within the queue, influenced by the already occurred primary incident. Secondary crash occurrences are less frequent than primary incidents, however, the incident management without considering a potential secondary crash can cause a worst-case scenario to both emergency vehicles and travelers. Although statistical models have been developed in the past to estimate the probability of secondary crashes, they do not consider time-series changes of the probability. A Markov chain, a stochastic model is used in this study to model randomly occurring incidents in a sequence. It is different from previously developed semi-Markov models by considering incident duration as a first-order to estimate the secondary crash parameters in the second order. Based on author’s previous models on incident duration prediction, this study develops a multivariate second-order Markov model to estimate the probability of a secondary crash based on various primary incidents. This analysis will determine and identify if the probability of a secondary crash is higher at a specific location or higher due to a specific type of primary incident. Findings from our analysis can aid in developing countermeasures such as allowing emergency operators to allocate more resources to clear primary incidents quicker, or better prepare for secondary crashes based on the predicted probability of additional incidents.
Public Interest Statement
Manuscript ID: 215,600,179
High-Order Markov Model for Prediction of Secondary Crash Likelihood considering Incident Duration
Nigel Pugh, Hyoshin Park
Cogent Engineering
Traffic incidents can create major non-recurring congestion and have the potential to be fatal. Secondary crashes are collisions that have taken place inside of incident scene or within the queue, influenced by the already occurred primary incident. Secondary crash occurrences are less frequent than primary incidents, however, the incident management without considering a potential secondary crash can cause a worst-case scenario to both emergency vehicles and travelers. This analysis will determine and identify if the probability of a secondary crash is higher at a specific location or higher due to a specific type of primary incident. Findings from our analysis can aid in developing countermeasures such as allowing emergency operators to allocate more resources to clear primary incidents quicker, or better prepare for secondary crashes based on the predicted probability of additional incidents.
1. Introduction
Traffic crashes are largely responsible for causing congestion on roads, and the outcome can be deadly. In 2016, there were 37,461 traffic crash fatalities reported in the United States alone (NHTSA, Citation2016), which accounted for a 5.6% increase in traffic crash fatalities than the previous year (NHTSA, Citation2016). These incidents have caused 25% of all traffic delays experienced by drivers (Owens et al., Citation2010). Traffic incidents can be described as debris, collisions, and disabled vehicles that have resulted in frequent disruption of traffic operations (Yang, Bartin et al., Citation2014). These incidents can affect the risk of another car being involved in a secondary collision. Studies show that 1% of crashes are entirely or partially a result of a primary incident (Raub, Citation1997). In addition to the type of incidents mentioned previously, secondary crashes can result from other actions, such as rubbernecking, and buildup of the queue (traffic congestion) (Raub, Citation1997).
The Federal Highway Administration (FHWA) defines a secondary crash as “The number of secondary crashes beginning with the time of detection of the primary incident where a collision occurs either a) within the incident scene or b) within the queue, including the opposite direction, resulting from the original incident.” (Xiong, Tobias, Mannering et al., Citation2014a) FHWA estimates that nearly 20% of all crashes are secondary crashes (Secondary Crashes, Citation0000). It is estimated that 18% of all fatalities happen on interstates, due to secondary crashes (Road Crash Statistics, Citation0000). The likelihood of a secondary crash will increase by 2.8% for each minute that a primary crash remains a hazard (Traffic Incident Management (TIM) Performance Measurement: On the Road to Success, Citation0000). With vehicle crashes costing the United States $242 billion dollars, agencies and researchers are constantly looking for ways to reduce and prevent traffic incidents (Study Shows, Citation2015). Secondary incidents have been studied based on analyzing crash risk (Yang, Ozbay, Xie, Citation2014; Yang, Ozbay, Morgul, Bartin, Xie et. al, Citation2014) time period duration (Yang, Bartin, Ozbay, Citation2014; Yang, Ozbay, Xie et. al, Citation2014; Goodall, Citation2018) , incident duration (A. Khattak et al., Citation2009), real-time prediction (Park, Gao, Haghani, Citation2017; Park and Haghani, Citation2016; Khattak, Wang, Zhang, Cetin et. al, Citation2011), and crash severity (Xu, Liu, Yang, Wang et al., Citation2016a). Compared to numerous studies on natural disasters, secondary crashes occur more often in everyday congestion. Even though secondary crash occurrences are less frequent than primary incidents, incident management without considering a potential secondary crash can cause a worst-case scenario to both emergency vehicles and travelers.
Although statistical models have been developed in the past to estimate the probability of secondary crashes, time-series changes of the probability are not considered. A Markov chain, a stochastic model is used in this study to model randomly occurring incidents in a sequence of events that have taken place previously. It is a useful model when modeling practical systems in transportation under uncertainty. By considering incident duration as a first-order to estimate the secondary crash parameters in the second-order, this study differentiates itself from a previously developed semi-Markov model (Ng et al., Citation2013). Based on the author’s previous models on the prediction of incident duration and secondary likelihood (Park, Gao, Haghani, Citation2017; Park, Haghani, Citation2016), this study develops a multivariate second-order Markov model to estimate the probability of a secondary crash based on various primary incidents, from Maryland Interstate 695 incident data.
For the remaining sections of this paper, we will discuss the previous studies regarding Markov models and predicting secondary crashes; in the Methodology section, we will discuss using our high-order Markov model to predict secondary crashes based on different scenarios; followed by discussing the results and then conclude this work.
2. Literature review
High-order Markov models have been used for prediction in various topics: Spectrum usage (Li et al., Citation2010), sales demand (Ching et al., Citation2003), and DNA sequencing (Ki, S., F. E. & N. M, Citation2004). Additionally, high-order Markov chains have had successful and widespread adoption in sensor and computer networks (Aceto et. al, Citation2021; Rossi et. al, Citation2015). Markov models have been used previously used to determine the time duration in-between a primary crash and secondary crash (Ng et al., Citation2013). However, the primary objective of this paper was to utilize high-order Markov models to conduct an analysis and calculate the probability of a secondary crash based on various primary incidents and locations. As a practical application, this second-order Markov model secondary crash prediction can be used for aiding emergency vehicle routing (Sayarshad et. al, Citation2017; Djavadian and Chow, Citation2017; Chow and Nurumbetova, Citation2015; You et. al, Citation2016).
Markov models have shown to be reliable at making predictions in the transportation field, more specifically in crash analysis. When the severity of crash data is reported, it is reported as discrete data. This has made crash injury severity observation a focus of many safety analyses (Road Crash Statistics, Citation0000). Semi-Markov models have been used to model the time duration to the next primary and secondary incidents (Sayarshad & Chow, Citation2017). The authors used an original semi-Markov model (Janssen & Manca, Citation2010) to model primary incidents and extended the model to include secondary incidents. The results were able to show that if a freeway is heavily traveled and has a high-speed limit, it is more susceptible to incidents and it is harder to make an impact on the time to a secondary incident. Hidden Markov models, such as the one used in (Xiong, Tobias, Mannering et al., Citation2014b) are commonly used to determine unobserved heterogeneity across time periods. The goal was to expand transportation research by developing a Markov switching random parameters model and applying it to crash injury severity’s. These findings will aid in a better understanding of how the effect of roadway and driver characteristics have on crash injuries. The states were split into two states (State I and State II) with three variables each: No injuries, Injury, and Fatality (y = 1, y = 2, y = 3). The data used is the Indiana police reported rural interstate single-vehicle crash from 1995 to 1999 (260 weeks). This data included factors such as roadway geometrics, pavement characteristics, driver characteristics, and collisions. The model developed used a Markov Switching Random Parameters Ordered Probit (MSRPOP) model. The state was changed every week (St) to accommodate for the 260 weeks. From this study, factors such as international roughness index, rut depth, and average annual daily traffic were said to influence crash injury severity from the observed states. State 1 was said to be more related to a driving environment with a higher probability of an injury than state 2. Out of the analysis, 76% of fatal crashes and 93% of injury crashes had more than an 80% probability to occur in state one.
Other variations of a Markov model are when the actual state is not observable from the data. To estimate the hidden safety state, the author of this paper (Park, Gao, Samuel et al., Citation2017) developed a Hidden Markov Model (HMM). The estimated human intent as various types of secondary tasks to estimate the probability of hazard detection. Singh et al. (Singh et al., Citation2004) developed a system for vehicle crash detection based on seven stages of left–right HMM. Left–Right HMM has shown to be successful when used in time-series applications. The parameters and data generated for this research were both real and computer-aided engineering data. Crash pulses were used to train the HMM’s. The pulses consisted of accelerometer measurements in a crash and the simulation of computer-aided engineering. The model was said to be 100% accurate and no cases of false positives or false negatives. The benefits of this model was: It was fast at detecting crashes (), simple to implement since it only utilizes two sensors and an adaptable model that can be changed to use any vehicle line or additional sensors.
The same authors as the previous research (Singh et al., Citation2004) expanded their study by comparing HMM against Support Vector Machines (SVM) for vehicle crash detection (Singh & Song, Citation2010). HMM and SVM both perform well to optimizing their objective functions but performance can have different outcomes based on their assumptions. The data was for this project was acquired from a crash pulse library of a specific vehicle. The three groups of crash pulses were: vehicle crashes at 6–9 mph (low-speed crash), 12–25 mph (medium-speed crash), and high-speed crashes. The pulses were gathered from 27 crash experiments. The results were analyzed of a pulse rate from 4 to 8 ms. For HMM, the average detection rates were: 99.4% (4 ms), 99.3% (5 ms), 100% (6 ms). For SVM, average detection rates were: 99.4% (4 ms), 99.8% (5 ms), 99.9% (6 ms), and 100% (7 ms). Overall, this research showcased that HMMs can determine crash pulses from a non-crash pulse in 6 ms and SVM can detect collisions in 7 ms. To summarize, although previous papers have focused on modeling secondary crash risk using various factors, there have been no studies using a higher-order Markov model considering the impact of incident duration on secondary crash occurrences. We fill this gap by accomplishing the following contributions in this paper:
• This paper focuses on predicting whether a secondary crash will occur based on all incidents, the type of primary incident leading to a secondary crash, and exit locations.
• This paper explores secondary crash prediction using a high-order Markov approach to model and predict secondary crashes.
• This paper determines which starting sequences (stages) result in secondary crash identification.
Additionally, we will discuss the technical challenges faced in the Discussion section of this paper.
3. Methodology
We present a general Markov chain method utilized in the secondary crash prediction and extend it to higher-order Markov chain.
3.1. Markov chains
A Markov chain is a random process in discrete time that is a sequence of a random variable. We can describe a Markov chain as follows: We have a set of states , N being the number of possible states. Markov chains have an initial state vector (N × 1 matrix) which is the probability distribution of starting at the N possible states. The initial state vector can be described as:
The stochastic property for the initial state distribution vector is:
is defined as:
The process starts in state , and will continue to move from one state to another. Every move to another state is considered to be a step. There is a probability associated with going from state to state which can be denoted as
,
is the initial state and
is the next state. These probabilities are known as transition probabilities. A random process that has the Markov property if the conditional probability of future states depends on the present state, and not any events that preceded it. The conditional transition probabilities can be denoted by:
and the probability of the next state of a first-order Markov model relationship can be denoted as:
where is the state of a categorical data sequence at time t. The transition probability matrix is a (I × J) matrix that can be denoted as:
EquationEquations (1)(1)
(1) —(Equation6
(6)
(6) ) describe the equations and properties of a first-order Markov process.
A high-order Markov model can be used to predict future states as well. A high-order Markov model will utilize more memory when making predictions. The next state will depend on the previous two or more states. For example, if you were trying to predict the next word in a sequence, it may be helpful to know the previous two words rather than just one previous word. In high-order Markov models, the previous history can have predictive value and can be used when making a future prediction.
where the initial probability distributions are and
satisfies
EquationEquations (7)(7)
(7) —(Equation9
(9)
(9) ) describe the equations and properties of a high-order Markov process.
When making predictions, the sequences of secondary incidents needs to be fit to a Markov model. We estimate our higher-order Markov model by solving the linear-quadratic programming problem:
State distributions are given ,
is lag parameter for lag
and
is transition matrix. The heat map displays the transition probabilities for our fitted Markov model. After fitment of the high-order Markov model, a starting sequence is given and the next sequence can be predicted. The next sequence is predicted based on the transition probabilities of the fitted high-order Markov model. We estimate the probability distribution of the next sequence as:
where distribution of states are at time , and is given as
. The transition matrix of lag
is given as
, and
specifies the lag parameter.
is the absorbing probability matrix.
3.2. High-order multivariate Markov model secondary crash application
In the previous section, we introduced the general Markov chain used to model and predict secondary crashes. The general Markov chain is then extended to a higher-order multivariate method. Our model is used to find the probability of a secondary crash given a primary incident. The four possible states are P, S, C, NO.
• P = primary incident
• S = secondary crash
• C = clearance of an incident
• NO = nothing happened (the state has not changed)
Each primary incident and the following states will be considered a sequence. There were a total of 39 incidents recorded. The 39 incidents were then grouped into 20 incident sequences. (One primary crash and one secondary crash per sequence). In our analysis, we have three different scenarios. The scenarios were:
• All the sequences were used to fit the Markov model.
• Various primary incident types (disabled vehicles, primary collision, and obstructions) were used to fit the model.
• Grouped exit incident locations along Interstate 695.
The assumptions are:
• Sequences were only modeled up to 60 minutes starting from the primary incident.
• Each stage time step was taken in 15 minutes intervals.
• When fitting the model, sequences were recorded until there were two clearances (both incidents were cleared).
• When modeling, because a primary incident clearance and a secondary crash could both occur within a 15-minute time interval, whichever event came first was recorded as the first stage. The next stage would be the following event.
• Each model scenario was given three starting sequences 1. (p) (c) 2. (p) (s), and 3. (p) (no) to determine the prediction of the next two stages (30 minutes).
The scenarios will be described in the Results section and a probability of the predicted sequence will be given.
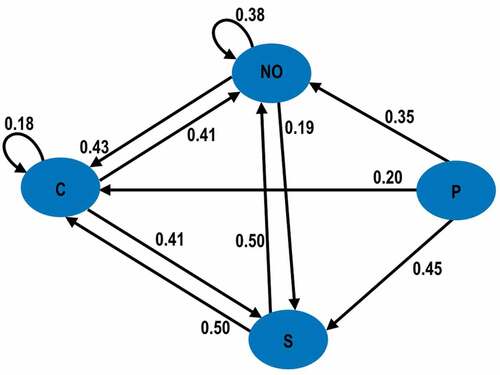
For a visual representation of transition probabilities, a heat map () and Markov chain diagram () were created from the fitting of our model. The figures are the actual heat map and Markov model for the “All Incidents” scenario. The heat map can be explained as the “greener” the block the higher the associated probability. The Y-axis (From) is the beginning state and the X-axis (TO) is the ending state. For example, let us look at the (p) row on the heat map. From p to c (primary incident to a clearance) the probability is 20%. From (p) to (s) (primary incident to secondary crash) there is a 45% probability. From (p) to (no) (primary incident to nothing happens) there is a 35% chance nothing will happen (the state will stay the same). When starting from a secondary crash, there is a 50% chance that nothing will happen and a 50% chance a clearance will occur within the next 15 minutes.
Figure 1. Heat map for transition probabilities
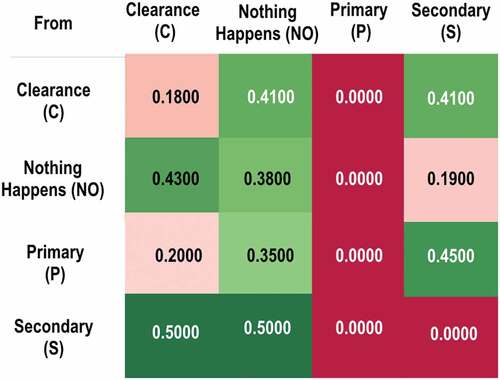
Figure 2. Markov chain diagram for transition probabilities
3.3. Data description
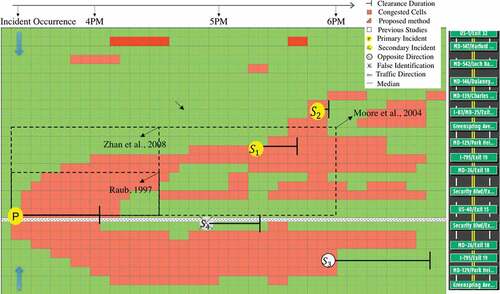
The incident data was provided by The Regional Integrated Transportation Information System (RITIS) to find the probability of a secondary crash given a primary incident on Interstate 695 (I-695) in Maryland. The RITIS dataset provides valuable information such as incident location, time, type of incident, and incident duration. In , the total number of incidents that occurred on Interstate 695 occurred during June 2018. For our analysis, we used incidents that occurred within the 30-mile section from exit 10 to exit 35, which is highlighted in red. Out of all the incidents shown, we classified 20 incidents as being secondary crashes. displays the incident data statistics such as location, incident type, and incident duration. A previously developed secondary crash identification method ((Park, Gao, Samuel et al., Citation2017)) () was utilized for all the above incidents.
Table 1. Secondary incidents statistics part I
Figure 3. Secondary incident locations: I-695
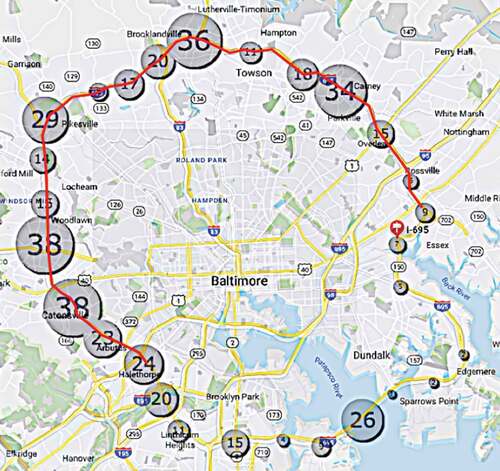
Figure 4. Secondary crash identification
4. Results
To determine how much the model can be trusted, we tested the model for its prediction accuracy shown in . To determine the accuracy, we found the accuracy for each scenario separately and then averaged the final accuracies to determine the overall prediction accuracy of the model. When testing, a sequence was removed from each scenario at random. The remaining sequences were used to fit the model. After completing the fitting, the model was giving the starting sequence of the removed sequence to make its prediction of the next two stages. The results indicated that in 6/9 of the scenarios the model predicted one of the stages correctly and received an accuracy of 50%. In 3/9 of the scenarios, the model predicted the next two stages correctly and received an accuracy of 100%. There were no cases where the model did not predict any of the next two stages correctly. The overall prediction accuracy of the model is 66.7%.
Table 2. Model prediction accuracy
As previously mentioned, different scenarios will be used to determine the probability of a secondary crash. shows the scenarios indicating that a secondary crash was predicted. The scenarios are as follows: All Events, Primary Incident, and Exit Number Location. The first scenario All Events () uses all 20 grouped incident sequences to fit the model. The model was given the three starting sequences stated previously. The results indicated that after a primary incident and a clearance, the model predicted there will be a secondary incident and a clearance within the next 30 minutes. Additionally, when a primary incident and secondary incident occur, shortly after clearance of one of the incidents will take place followed by another secondary crash. Both of these scenarios had a 12.9% probability.
Table 3. All incidents event secondary crash prediction (scenario I)
The second scenario was the primary incident secondary crash prediction (). Since secondary crashes can be caused by different types of primary incidents, we decided to separate the sequences by the type of primary incident that leads to the secondary crash. It is interesting to note that there was only one scenario where the model predicted a secondary crash. The model predicted a secondary crash when the primary incident was an obstruction on the highway. The starting sequence given for that scenario was a primary incident followed by a clearance of the incident. The associated probability was 60%.
Table 4. Primary incident and secondary crash prediction (scenario II)
For the final scenario () we split the incidents based on the location that they occurred. The exit numbers were separated into groups of five. The exits where the incidents occurred were from exits 10–35. This was to determine whether there was a location that was more susceptible to secondary crashes. From our results exit 15–20, there were two scenarios where secondary incidents were predicted. The starting sequences for those two scenarios were: (p) (c) and (p) (no). Also, the prediction made on one of the scenarios for exit 15–20 was the highest for this scenario group at 38.0%. For every exit group except exits 20–25, when the starting sequence was (p) (c) there was a secondary incident predicted. The probabilities for exit 10–15 (21.3%), 15 − 20 (38.0%), 25–30 (14.7%), and 30–35 (16.0%). The next predicted stages for exits 15–20, 25–30, and 30–35 all predicted the same “next predicted stages” as (s) (no). For exit 10–15, the next stage predicted stage was (s) (c). For exit 15–20, the next predicted stage was (c) (s). Our results also indicated that after a primary incident and clearance a secondary crash was predicted.
Table 5. Exit Number Group Secondary Crash Prediction (Scenario III)
Out of all the examples tested, there were eight instances where secondary crashes were predicted. We wanted to determine which starting sequence was the most frequent in predicting a secondary incident. The results for this question are shown in . Out of the eight instances, the starting sequence (p) (c) accounted for 75% (Secondary Crashes, Citation0000) of the instances where secondary incidents were predicted. Both of the sequences (p) (no) and (p) (s) accounted for 12.5 % (NHTSA, Citation2016) of the secondary incidents being predicted. This shows that typically when a primary crash is followed by a clearance, a secondary crash is more predicted to occur within the next two stages (30 minutes) than compared to the other starting sequences.
We have identified some research papers that focus on traffic crash prediction, including secondary incident prediction. The research papers compared in the table above use various different modeling approaches such as: Bayesian Random Effect Logit Model, Support Vector Machine (SVM) and Binary Logistic Regression. The accuracy rates range from 60.0% to 76.32%. Out of the models presented, our model (66.7%) has a higher prediction accuracy than three of the modeling approaches, including the model used to predict secondary incidents. Our model shows to preform similar or better to current modeling approaches for crash prediction. We believe our model accuracy will also improve even more with the use of additional data.
5. Discussion
5.1. Technical challenges
There were two primary technical challenges that we faced in our research. The first challenge was selecting a relevant incident duration time. Due to the implementation of the ”Nothing happens” states, one could technically make a prediction from a starting sequence of two “Nothing happens” states. This could be a little confusing for the model when making a prediction. The model would be making a prediction using sequences were no event (primary incident) has occurred. For this reason, that is why we chose short sequences (only 1 hour total and 15 minute increments). Additionally, the starting sequences are chosen strategically as they only have at most one ”NO” state in the model fitment process. Considering we are only predicting the next 30 minutes, the only time where two “Nothing happens” states would occur would be for starting sequence 3: (p)(no), or if that was the predicted next two states. For the latter example, there is a possibility that two “Nothing happens” states can occur. However, because the sequence starts with the primary incident, the model will know that an event (primary incident) has already occurred.
The second technical challenge was access to limited data. Due to the fact that our data was limited in number of secondary incidents occurring, there was little data to fit the model. However, we believe this modeling approach is promising and plan to further investigate these prediction matters in future works where we will have more data available.
5.2. Computational complexity
The hardware used to support this work was a 2018 Apple Macbook Pro 2.9 GHz 6-Core Intel Core i9, with 32 GB of RAM. Considering our model is relatively light and the sequences used to fit the model are all short; the run-time complexity of our model is quite efficient. The average run time of our model using 20 secondary incident sequences was 0.0474 seconds. If we doubled our secondary incident sequences by 40 sequences the average run-time would be 0.0533 seconds. If we increased the fit of the model to 100 secondary incident sequences the average run-time would be 0.1176 seconds.
5.3. Future studies
Crashes and traffic incidents are known for the potential of causing serious crashes and heavy congestion. Even though numerous projects have worked on natural disasters regarding secondary crashes, secondary crashes occur more often in everyday congestion scenarios. Previous researchers have focused on various aspects of modeling, predicting, and preventing secondary incidents. These findings have resulted in numerous amounts of valuable information regarding how to handle secondary crashes that will need to be investigated. We have added to this conversation by analyzing secondary crashes regarding the primary incident type, and incident exit location using a high-order Markov model. The second-order Markov model had an overall prediction accuracy of 66.7%. Our findings indicate when an obstruction is a primary incident there is a high probability that a secondary crash will occur within the next 30 minutes after the primary obstruction incident and its clearance. Also, in most of our tests, when a primary crash and a clearance take place there was a secondary incident predicted within the next 30 minutes.
For future studies, we would like to obtain data where more secondary crashes are present for better modeling of secondary incidents. As well, we would like to include more historical data to better fit models for making secondary crash predictions. The question of is more history needed when giving starting sequences or should more stages be predicted when predicting secondary crashes will need to be investigated. Additionally, we plan to re-investigate the run-time complexity using these longer sequences and larger dataset. We would also like to further investigate the use of second-order Markov models in assisting emergency vehicles in managing the disbursement of emergency vehicles to clear the primary incident and prevent secondary crashes.
Notes on contribution
Nigel Pugh is a PhD candidate and Chancellors Distinguished PhD Fellow in the Computational Science and Engineering department at North Carolina A&T State University. He received his B.S. degrees in computer science and mathematics from Elizabeth City State University in 2017. His current research interest includes dynamic path planning and AI-based decision-making under uncertainty.
Hyoshin Park is currently an Assistant Professor at North Carolina A&T State University and holds a Visiting Professorship at the NASA Jet Propulsion Laboratory of the California Institute of Technology. Dr. Park’s current research includes distributionally robust optimization-based active sensing for a wide range of federal and state government sponsors, including the National Science Foundation, US- DOT, and the US Department of Energy.
Data deposition
Not applicable
Acknowledgements
The data used for this study was from the RITIS Data Archive provided by the CATT laboratory at the University of Maryland. This paper is partially supported by start-up fund provided by North Carolina A&T State University and USDOT University Transportation Centers (Contract 69A3551747125), Chancellor’s Distinguished Fellows, and US Department of Education Title III HGBI Grant.
Disclosure statement
The authors have no conflicts of interest to declare.
Data availability statement
The data used in this study was accessed through access to Regional Integrated Transportation Information System (RITIS). Organizations can request access to RITIS if certain eligibility requirements are met. Please refer to https://ritis.org/access#request for more information regarding access.
Additional information
Funding
Notes on contributors
Nigel Pugh
Manuscript ID: 215600179
High-Order Markov Model for Prediction of Secondary Crash Likelihood considering Incident Duration
Nigel Pugh, Hyoshin Park
Cogent Engineering
Nigel Pugh is a PhD candidate and Chancellors Distinguished PhD Fellow in the Computational Science and Engineering department at North Carolina A\&T State University. He received his B.S.degrees in computer science and mathematics from Elizabeth City State University in 2017. His current research interest includes dynamic path planning and AI-based decision-making under uncertainty. Nigel works under is his advisor Dr.Hyoshin Park. Dr.Park’s current research includes distributionally robust optimization-based active sensing for awide range of federal and state government sponsors. This project can be used to help reduce traffic congestion and the number of crashes on the road. Findings from our work can aid in developing countermeasures such as allowing emergency operators to allocate more resources to clear primary incidents quicker, or better prepare for secondary crashes based on the predicted probability of additional incidents..
References
- Aceto, G., Bovenzi, G., Ciuonzo, D., Montieri, A., Persico, V., & Pescapé, A. (2021). Characterization and Prediction of Mobile-App Traffic Using Markov Modeling. IEEE Transactions on Network and Service Management, 18(1), 907–16. https://doi.org/10.1109/TNSM.2021.3051381
- Ahmed, M., Abdel-Aty, M., & Yu, R. (2012). Bayesian Updating Approach for Real-Time Safety Evaluation with Automatic Vehicle Identification Data. Transportation Research Record, 2280(1), 60–67. https://doi.org/10.3141/2280-07
- Ching, W. K., Fung, E. S., & Ng, M. K. (2003). A Higher-Order Markov Model for the Newsboy’s Problem. The Journal of the Operational Research Society, 54(3), 291–298. https://doi.org/10.1057/palgrave.jors.2601491
- Chow, J. Y. J., & Nurumbetova, A. E. (2015). A multi-day activity-based inventory routing model with space–time–needs constraints. Transportmetrica A: Transport Science, 11(3), 243–269. https://doi.org/10.1080/23249935.2014.958120
- Djavadian, S., & Chow, J. Y. J. (2017). An agent-based day-to-day adjustment process for modeling ‘Mobility as a Service’ with a two-sided flexible transport market. Transportation Research Part B: Methodological, 104, 36–57. https://doi.org/10.1016/j.trb.2017.06.015
- Goodall, N. J. (2018). Probability of Secondary Crash Occurrence on Freeways with the Use of Private-Sector Speed Data. Transportation Research Record: Journal of the Transportation Research Board, 2635(1), 11–18. https://doi.org/10.3141/2635-02
- Hossain, M., & Muromachi, Y. (2012, March). A Bayesian network based framework for real-time crash prediction on the basic freeway segments of urban expressways. Accid Anal Prev, 45, 373–381. Epub 2011 Sep 6. PMID: 22269521. https://doi.org/10.1016/j.aap.2011.08.004.
- Janssen, J., & Manca, R. (2010). Applied semi-Markov processes. Springer. https://doi.org/10.1007/0-387-29548-8
- Khattak, A., Wang, X., & Zhang, H. (2009). Are Incident Durations and Secondary Incidents Interdependent? Transportation Research Record: Journal of the Transportation Research Board, 2099(1), 39–49. https://doi.org/10.3141/2099-05
- Khattak, A. J., Wang, X., Zhang, H., & Cetin, M. (2011). Primary and secondary incident management: Predicting durations in real time. In Virginia Center for Transportation Innovation and Research. Report no. VCTIR 11-R11.
- Ki, S., F. E., C. W., & N. M, K. (2004). Higher-order Markov chain models for categorical data sequences. Naval Research Logistics (NRL), 51(4), 557–574. https://doi.org/10.1002/nav.20017
- Li, Y., Dong, Y. N., Zhang, H., Zhao, H. T., Shi, H. X., & Zhao, X. X. 2010. “Spectrum Usage Prediction Based on High-order Markov Model for Cognitive Radio Networks. ” Paper presented at the 2010 10th IEEE International Conference on Computer and Information Technology, IEEE, 2010, Bradford, UK.
- Ng, M., Khattak, A., & Talley, W. (2013). Modeling the time to the next primary and secondary incident: A semi-Markov stochastic process approach. Transportation Research Part B: Methodological, 58, 44-57. https://doi.org/10.1016/j.trb.2013.09.013
- NHTSA, “USDOT Releases 2016 Fatal Traffic Crash Data” 2016. http://www.nhtsa.gov/press-releases/usdot-releases-2016-fatal-traffic-crash-data
- Owens, N., Armstrong, A., Sullivan, P., Mitchell, C., Newton, D., Brewster, R., & Trego, T. (2010). Traffic Incident Management Handbook, Publication FHWA-HOP-10-013. FHWA. Department of Transportation.
- Park, H., Gao, S., & Haghani, A. (2017). Sequential interpretation and prediction of secondary incident probability in real time. Paper presented atTransportation Research Board 96th Annual Meeting Transportation Research Board, 2017, Washington DC, USA. https://trid.trb.org/view/1439495
- Park, H., Gao, S., & Samuel, S. (2017). Modeling Effects of Forward Glance Durations on Latent Hazard Detection. Transportation Research Record, 2663(1), 90–98. https://doi.org/10.3141/2663-12
- Park, H., & Haghani, A. (2016). Real-time prediction of secondary incident occurrences using vehicle probe data. Transportation Research Part C: Emerging Technologies, 70, 69–85. https://doi.org/10.1016/j.trc.2015.03.018. 2016/09/01/ 2016.
- Pugh, N., Park, H., Derjany, P., Liu, D., & Namilae, S. (2021). Deep adaptive learning for safe and efficient navigation of pedestrian dynamics. IET Intelligent Transport Systems, 15(4), 538–548.
- Raub, R. (1997). Occurrence of Secondary Crashes on Urban Arterial Roadways. Transportation Research Record: Journal of the Transportation Research Board, 1581(1581), 53–58. https://doi.org/10.3141/1581-07
- Road Crash Statistics” 0000 . http://asirt.org/initiatives/informing-road-users/road-safety-facts.
- Rossi, P. S., Ciuonzo, D., & Ekman, T. (2015). HMM-based decision fusion in wireless sensor networks with noncoherent multiple access. IEEE Communications Letters, 19.5(5), 871–874. https://doi.org/10.1109/LCOMM.2015.2413407
- Sayarshad, H. R., & Chow, J. Y. J. (2017). Non-myopic relocation of idle mobility-on-demand vehicles as a dynamic location-allocation-queueing problem. Transportation Research Part E: Logistics and Transportation, Review, 106, 60–77. https://doi.org/10.1016/j.tre.2017.08.003
- „Secondary Crashes” 0000 . http://nchrptimpm.timnetwork.org/?page_id=23
- Singh, G. B., & song, H. (2010). Comparison of Hidden Markov Models and Support Vector Machines for vehicle crash detection. International Conference on Methods and Models in Computer Science (ICM2CS-2010, pp. 1– 6). https://doi.org/10.1109/icm2cs.2010.5706709
- Singh, G. B., Song, H., & Chou, C. C., “Crash Detection System Using Hidden Markov Models. ”, SAE Technical Paper Series, SAE International. https://doi.org/10.4271/2004-01-1781 2004.
- Study Shows, N. H. T. S. A. (2015, January 1). Economic and Societal Impacts of Crashes. Public Roads.
- Traffic Incident Management (TIM) Performance Measurement: On the Road to Success” 0000. http://ops.fhwa.dot.gov/publications/fhwahop10009/tim_fsi.html
- Wu, M., Shan, D., Wang, Z., Sun, X., Liu, J., & Sun, M., “A Bayesian Network Model for Real-time Crash Prediction Based on Selected Variables by Random Forest. ” 2019 5th International Conference on Transportation Information and Safety (ICTIS), 2019, pp.670–677, Liverpool, United Kingdom. https://doi.org/10.1109/ICTIS.2019.8883694.
- Xiong, Y., Tobias, J. L., & Mannering, F. L. (2014a). The analysis of vehicle crash injury-severity data: A Markov switching approach with road-segment heterogeneity. Transportation Research Part B: Methodological, 67, 109–128. https://doi.org/10.1016/j.trb.2014.04.007
- Xiong, Y., Tobias, J. L., & Mannering, F. L. (2014b). The analysis of vehicle crash injury-severity data: A Markov switching approach with road-segment heterogeneity. Transportation Research Part B: Methodological, 67, 109–128. https://doi.org/10.1016/j.trb.2014.04.007. 2014/09/01/ 2014.
- Xu, C., Liu, P., Yang, B., & Wang, W. (2016a). Real-time estimation of secondary crash likelihood on freeways using high-resolution loop detector data. Transportation Research Part C: Emerging Technologies, 71, 406–418. https://doi.org/10.1016/j.trc.2016.08.015
- Yang, H., Bartin, B., & Ozbay, K. (2014). Mining the Characteristics of Secondary Crashes on Highways. Journal of Transportation Engineering, 140(4), 04013024. https://doi.org/10.1061/(ASCE)TE.1943-5436.0000646
- Yang, H., Ozbay, K., Morgul, E., Bartin, B., & Xie, K. (2014). Development of Online Scalable Approach for Identifying Secondary Crashes. Transportation Research Record: Journal of the Transportation Research Board, 2470(1), 24–33. https://doi.org/10.3141/2470-03
- Yang, H., Ozbay, K., & Xie, K. (2014). Assessing the risk of secondary crashes on highways. Journal of Safety Research, 49, 143.e141–149. https://doi.org/10.1016/j.jsr.2014.03.007
- You, J., Wang, J., & Fang, S. (2016). Real-time freeway crash prediction model by using single ultrasonic detector lane-level data., Fundamental Pavement Design (1st edition), (pp. 1635–1643). https://doi.org/10.1201/9781315643274-181
- You, J., Wang, J., & Guo, J. (2017). Real-time crash prediction on freeways using data mining and emerging techniques. J. Mod. Transport, 25(2), 116–123. https://doi.org/10.1007/s40534-017-0129-7
- You, S. I., Chow, J. Y. J., & Ritchie, S. G. (2016). Inverse vehicle routing for activity-based urban freight forecast modeling and city logistics. Transportmetrica A: Transport Science, 12(7), 650–673. https://doi.org/10.1080/23249935.2016.1189723