
 ?Mathematical formulae have been encoded as MathML and are displayed in this HTML version using MathJax in order to improve their display. Uncheck the box to turn MathJax off. This feature requires Javascript. Click on a formula to zoom.
Abstract
This study examines the feasibility of a stand-alone photovoltaic, diesel generator and battery storage hybrid power system for the electrification of off-grid rural areas in northern Ghana. The HOMER software package was used for simulation analysis. Five optimization scenarios considered feasible by HOMER were evaluated. The evaluation criteria include net present cost (NPC), cost of energy (COE) and emissions. The results indicate that PV/diesel/battery storage hybrid system is the most feasible, optimized, cost-effective and environmentally friendly system among the systems considered. This system has a Cost of Energy (COE) of 0.399 $/kWh and an NPC of $296,552. Although this COE is approximately three times the current energy cost in Ghana, sensitivity analysis shows that changing certain parameters such as fuel costs, and capital subsidies can reduce COE. This shows that if policymakers create the necessary investment environment, such projects can be a viable alternative to rural electrification.
PUBLIC INTEREST STATEMENT
With growing concerns about climate change, renewable energy systems have emerged as the best alternative for future energy generation. Solar energy, in particularly, stands out as one of the cleanest energy sources and is gaining popularity the world over. This research investigated the technical and economic viability of using hybrid PV and diesel generator systems for rural electrification in northern Ghana. The findings may guide policymakers and other stakeholders in making informed decisions about the electrification of rural communities in the country.
1. Introduction
During the last decades, global energy demand has increased substantially (International Energy Agency, International Renewable Energy Agency, United Nations, World Bank Group and World Health Organization, Citation2018). This phenomenon is attributed to population growth, which has a significant impact on energy production, distribution and consumption (Menyah & Wolde-Rufael, Citation2010). While the generation of electricity from fossil fuels such as coal, diesel, and natural gas results in the emission of greenhouse gases in quantities that have adverse effects on humans and the environment (Awopone, Zobaa, & Banuenumah, Citation2017b; Reddy et al., Citation2013), it is generally agreed that the use of renewable energy resources will greatly reduce the current global environmental problems. Following a global shift in behaviour, the United Nations, in its Sustainable Development Goals, has explicitly demonstrated the need for clean energy transition in its seventh (7th) goal (International Energy Agency, International Renewable Energy Agency, United Nations, World Bank Group and World Health Organization, Citation2018). This together with the commitment of nations towards reducing their overall contribution to carbon emissions in their Nationally Determined Contributions (NDCs) from the Paris Agreement has increased the development rate for renewable energy technology
In sub-Saharan Africa, solar energy stands out as one of the cleanest energy sources and is becoming more and more popular (Nathaniel & Iheonu, Citation2019; Sokona et al., Citation2012). The potential for solar energy generation in the sub-region has been argued to be largely attributable to the simplicity of technology, the high life span of its projects, low overall costs (particularly in long-run estimates), the abundance of sunlight on the continent and the versatility of the systems with already existing grid connections. Notable statistics show that the continent has seen an increase in solar capacity of around 331 MW in 2011 to around 10.5 GW in 2020 (IRENA, Citation2021b). However, the share of solar energy in the continent’s energy capacity is low, accounting for around 1% of the total energy (IRENA, Citation2021a). Of these, influx rates are said to be higher in the northern and southern regions than in the rest of the continent. T
The electricity generation sector of Ghana, as is the case in most developing countries, is facing serious challenges (Gyamfi et al., Citation2015). A lot of constraints including uncertainty of rainfall for hydropower generation coupled with the rapid increase in demand has resulted in the expansion of thermal power generation. The total installed capacity of Ghana at the end of 2020 was 5,288 MW, including embedded generation. This is made up of 32.9% hydropower and 66.4% thermal generation. Renewable energy mainly from grid-connected photovoltaic (PV) accounts for the remaining 0.7% (Energy Commission Ghana, Citation2021). The shift from hydropower to thermal power generation has resulted in the inability of the power utility company to recover cost since the tariff regime in the country is based on the base load hydropower generation cost (Gyamfi et al., Citation2015). This has resulted in the inability of the utility company to raise adequate financial resources to procure sufficient fuel required for the thermal plants.
Northern Ghana has excellent solar radiation all year round. Average solar insolation is about 4.6 to 6.1 kWh/m2/day with average temperatures between (NASA, Citation2020) This makes the region very suitable for photovoltaic applications. Evidence from the existing academic research on renewable energy adoption in Ghana reveals a substantial number of relevant papers that confirm a strong potential for a sustainable transition to renewable energy (Asuamah et al., Citation2021; Awopone & Zobaa, Citation2017; Awopone, Zobaa, Banuenumah, & Aminifar, Citation2017a; Awopone, Zobaa, & Banuenumah, Citation2017b; Gyamfi et al., Citation2018; Sakah et al., Citation2017). Despite the vast potential of renewable energy resources in Ghana, adoption rates of these clean energy sources are low (Awopone, Zobaa, & Banuenumah, Citation2017b; Gyamfi et al., Citation2018; IRENA, Citation2019). Most rural electrification projects in Ghana are centred on grid extensions and diesel power plants (Adaramola et al., Citation2017). At the end of 2020, the country has four utility-scale grid-connected PV installations with a combined capacity of 49 MW (Asuamah et al., Citation2021), with an extra 10 MW Bui solar project undergoing a test run. Two of these installations are located in northern Ghana with a combined capacity of 9 MW (Energy Commission Ghana, Citation2021). Grid-connected renewable energy systems have been proven to be economically viable worldwide. The high capital cost of these systems, coupled with system stability and voltage control requirements limits the high renewable energy penetration (Al-Badi, Citation2011). However, the development of standalone PV systems for off-grid locations is still not fully acceptable to be financially viable.
Many off-grid PV systems have been installed in rural communities in the North. Most of these systems, which are on pilot basis, do not fully satisfy the energy requirements of beneficiaries as many of them are designed mainly for lighting loads. Beneficiaries do not, therefore, see the need to properly maintain them. Proper sizing of PV systems, especially for off-grid applications, is essential to ensure public acceptance and increase reliability. This study aimed at designing an off-grid hybrid energy system for an isolated community in northern Ghana. This study examines the economic feasibility of a hybrid energy system for rural electrification in northern Ghana. The design explored the technical and economic viability of the utilisation of hybrid PV and diesel generator systems. The findings may guide policymakers and other stakeholders in making informed decisions about the electrification of rural communities in the country.
2. Materials and methods
2.1. HOMER algorithm
The Hybrid Optimization Model for Electric Renewables (HOMER), an analytical software engineered by the National Renewable Energy Laboratory, is the tool used in this study. HOMER, is the standard tool for microgrid design and has been widely applied worldwide (Acakpovi et al., Citation2020; Adaramola et al., Citation2017; Lambert et al., Citation2006). HOMER performs three main functions, which include simulation, optimization and sensitivity analysis. A full description is described in .
Figure 1. Framework of HOMER optimisation procedure
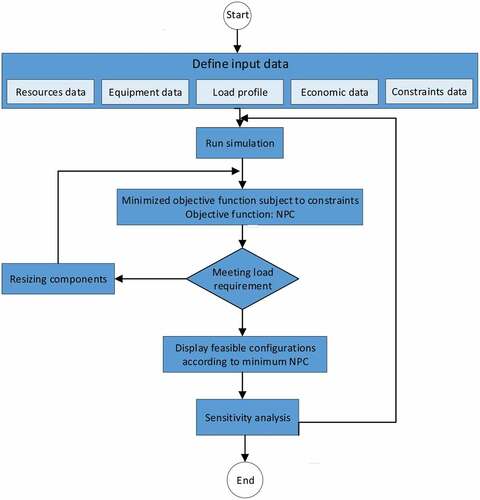
HOMER models each system configuration that is considered by performing a time step calculation over an entire year by comparing the power demand in the time step to the power that can be generated by the system in that time step. Life cycle cost analysis is then done by calculating the cost of installation and operation of the system that is considered feasible (Awopone, Zobaa, & Banuenumah, Citation2017b; Lambert et al., Citation2006; Lilienthal et al., Citation2004). The optimization is done to determine the least cost solution. The objective function is to minimise the total Net Present Cost (NPC), also referred to as the life-cycle cost. This is achieved by displaying possible configurations arranged in ascending order according to their Net Present Cost (NPC). NPC is the present value of the total cost of a system minus the total revenue over its lifetime and can be calculated using EquationEquation 1(1)
(1) (Lilienthal et al., Citation2004).
Where is the total net present cost,
is the total annualised cost,
is the capital recovery factor (%) which is modelled in HOMER using EquationEquation 2
(2)
(2) ,
is the annual real discount rate, which is given by EquationEquation 3
(3)
(3) and
is the project lifetime in years.
Where N is the number of years and is the annual inflation rate and
is the nominal interest rate. The optimization results also display the Levelized Cost of Energy (LCOE) of each system. COE which is the average
of producing the useful energy of the system is calculated using EquationEquation 4
(4)
(4) .
Where is the annualised cost of the system ($/year),
is the boiler marginal cost ($/kWh),
is the total thermal load served (kWh/yr) and
is the total electric load served (kWh/yr). However, in this design, the boiler and thermal load were not considered; thus, the COE was calculated using EquationEquation 5
(5)
(5) .
The sensitivity analysis explores the effect of change in the input variables. HOMER repeats the optimization process for each sensitivity value specified. The sensitivity function thus makes it easier to compare thousands of scenarios in a single run.
2.2. Solar resource
Ghana lies between latitudes and
. The western and eastern extremities lie at longitudes
and
. The country has a tropical, hot and humid climate and a land area of approximately
. There is an abundant solar resource throughout the year and in all parts of the country with an average ground measurement radiation of between
(Lilienthal et al., Citation2004) and suitable ambient temperature for photovoltaic application (Aburiya & Mutaka, Citation2007). This resource, however, varies slightly across the country, with the highest occurring in the northern Savannah region.
The long-term average solar energy incident on the horizontal surface of a hypothetical community in Builsa North district of the Upper East Region (), the location of the proposed micro-grid system was used for the model. Builsa north has a high non-electrification rate of about 83.7% (Descoqs & Bhattacharyya, Citation2018).
Table 1. Average monthly global horizontal irradiance and temperature data of study site (NASA, Citation2020)
2.3. Equipment considered
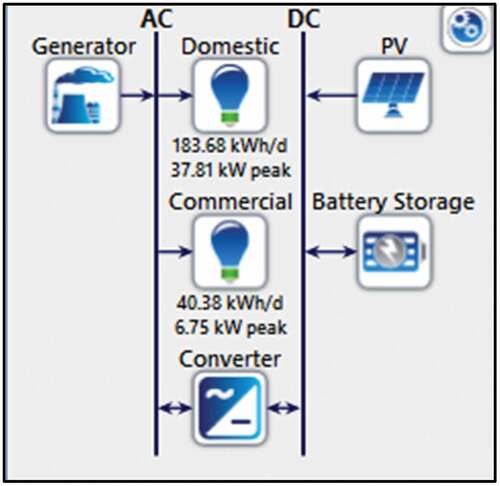
The HOMER simulation was tested for a standalone PV system with a backup generator for a typical domestic consumer. shows the components for the system design.
Figure 2. Components considered for system design
The PV system consists of a series-parallel arrangement of solar cells to meet the required current and voltage capacity. The power output of the PV system () is given by EquationEquation 6
(6)
(6) .
Where is the rated power of the PV array under standard test conditions (STC) in kW,
is the PV derating factor,
is the incident solar radiation on the PV array in kW/m2,
is the incident radiation at STC, and
is the temperature coefficient of power and temperature of PV cell at STC.
The PV capacities considered for the model range from 0 to 150 kW. Investment and replacement costs are estimated at 1200 $/kW and 1200 $/kW, respectively. The maintenance cost of such systems is minimal and was considered to be 10 $/year. The lifespan of the PV system was considered to be 25 years with a derating factor of 80%.
HOMER uses the kinetic battery model, which represents batteries as a two-tank system. One tank provides immediately available energy (), while the second, bound energy (
) can only be discharged at a limited rate. The total amount of energy stored in the system (Q) is the sum of the available and bound energy. This two-tank system can be described using three parameters: the maximum storage capacity of the two tanks (
), the capacity ratio (c), which is the ratio of the available energy tank to the combined capacity, and the rate constant (k), which is the conductance between the two tanks. The maximum amount of power
that the battery storage can absorb over a specific period (
) is expressed by the differential equation presented in EquationEquation 7
(7)
(7) (HOMER Energy, Citation2020).
Homer imposes three limitations to the battery bank’s maximum charge power:
Similarly, the maximum amount of power that can be discharged over a specific period (T) is expressed by EquationEquation 8(8)
(8) (HOMER Energy, Citation2020).
The battery storage allows the displacement of energy, that is, the storing of excess energy produced at a favourable time and then use of it at a time of no or low production. The battery considered has a nominal voltage of 12 V, a maximum capacity of 83.4 Ah, a maximum charge current of 16.7 A, a maximum discharge current of 24.3 A, a nominal battery capacity of 1 kWh, and an average lifespan of 10 years. These generic batteries were used in this study since they are a low-cost option that requires little maintenance. In a practical installation, a lesser number of bigger batteries may be selected, and this difference would have no major impact on HOMER’s economic analysis (Asuamah et al., Citation2021). Capital and battery replacement cost is considered to be $300/piece and 250 $/piece, respectively (Asuamah et al., Citation2021). The operation and maintenance costs (O&M) are considered to be 5% of the capital cost (Ali et al., Citation2020). A string size of four batteries (48 V system) was considered for the design, with a minimum state of charge of 40%.
Converters (comprising both inverter and rectifier) allow for the system to transition between alternating and direct currents. PV arrays produce a direct current that can be fed into batteries or DC loads. Most domestic appliances, however, operate on alternating currents. Inverters are therefore needed to modify the current from the PV array and batteries to the AC load. Rectifiers function in the opposite direction by converting AC back to DC. The system was designed to allow HOMER to optimize the converter size to meet the system requirements. The converter is considered to have a useful life of 20 years and an efficiency of 85%. The converter is designed to run in parallel with a diesel generator. According to market research during the research period, the capital and replacement costs for a 1 kW converter were considered to be $350.00 and $300.00, respectively (Odoi-Yorke et al., Citation2021).
Generators are normally used to supplement the power supplied by renewable energy systems, especially for off-grid applications. The size of the generator is largely determined by the peak demand to avoid capacity shortage. HOMER determines the amount of time the generator must be used in a year and calculates the total operating costs from this value. The operating cost of the generator depends largely on the fuel consumption, which is calculated using EquationEquation (9)(9)
(9) .
Where is the fuel consumption in L/hr,
is the fuel curve slope (0.273 L/hr/kW),
is the electricity output of the generator in kW,
is the coefficient of the fuel curve intercept (0.033 L/hr/kW),
is the rated capacity of the generator (60 kW). Capital and generator replacement costs are estimated at 300 $/kW and 250 $/kW, respectively, with operation and maintenance costs of 0.03 $/hr (Odoi-Yorke et al., Citation2021). The price of fuel is 0.98 $/L based on an exchange rate of $1.00 = 5.783 Ghana cedis (April 2021).
2.4. Load profile
The load demand for the community was estimated using survey data gathered on the energy consumption pattern of households. The survey provided details on the type of appliances and daily usage by typical rural households in Ghana and their daily rate of usage. The load consumption was estimated for two distinct sessions in Ghana: the rainy and dry seasons. In northern Ghana, the wet season lasts from June to October, with the dry season occurring for the rest of the year. provides a summary of the estimated demand for the two distinct seasons of the year. The study considered domestic load for estimated 80 households in the community, commercial load and a community health centre.
Table 2. Load assessment of the proposed rural area (Acakpovi et al., Citation2017; Olatomiwa et al., Citation2015)
Domestic energy demand is greatly influenced by behavioural characteristics and income levels. Income levels determine the capability of individuals to own appliances. The ownership of levels of various appliances was therefore considered in the estimation of the demand. Although ownership levels of appliances may vary with changes in economic and education status, this was considered a much accurate approach. This is because different households have different energy requirements. Therefore, estimating the consumption of one household and multiplying it by the number of households may not fully capture the load requirements of the community.
3. Results and discussion
This section analyses the technical, economic and environmental performance of the configuration of each microgrid power system that meets the specified load requirement. The evaluation focuses on the microgrid power system with the lowest cost and superior technical and environmental performance.
3.1. Optimization results
HOMER simulated all possible configurations of the system based on the range of equipment options considered, over varying constraints to meet the required load. In this study, 5,412 possible solutions were simulated, 3,244 of which were found to be feasible. The possible cases are then sorted in ascending order of net present cost (NPC) or life-cycle cost. NPC is the present value of the system capital, replacement, operation and maintenance, and fuel costs. HOMER lists the best system configuration for each type of system, defined as the configuration with the lowest net cost available. ranks feasible system configuration for benchmark conditions in the ascending order of NPC. Five categorized configurations of the microgrid system consisting of PV, diesel generator (DG), battery storage (BS) and converter system (CS) were identified: PV/DG/BS/CS (Case I), DG/BS/CS (Case II), PV/BS/CS (Case III), DG (Case IV) and PV/DG/CS (Case V).
Table 3. Optimization results in categorized form
HOMER is designed to evaluate systems feasible by NPC instead of the Average Cost of Energy (COE). This is because NPCs are a more reliable and less biased metric for these decisions. The NPCs decision does not require many arbitrary assumptions, as in the case of a COE that requires many assumptions (Lambert et al., Citation2006). Interestingly, the results in show that there is a positive correlation between NPC and COE.
Based on a comparative analysis of the technical, economic and environmental aspects of all the case designs in , it should be noted that the system in Case IV has the lowest initial capital cost but a high NPC. This is mainly due to the high operating and fuel cost of the DG. It is worth noting that the system in Case II achieves the best technical performance. This is because Case II produces just enough electricity to meet the demand with 0% excess energy.
Case III has the best environmental performance, but high initial capital requirements are very high, and poor technical performance. The Case I system was selected as the best hybrid microgrid system. This system has the lowest economic cost and acceptable technical performance (excess energy 0.6%). It can effectively help the Ghanaian government achieve its commitment to the Paris Agreement on Climate Change and the Kyoto Protocol.
The optimal system’s (Case I) payback time has been tested to determine how long it takes to recover the capital spent on investment. This metric is important to investors because it gives a quick indication of when they will begin to generate profits. From , the optimal system’s NPC is determined to be $296,552 over the life of the project or 25 years. This system generates 108,535 kWh per year to meet the load demand. Considering the cost per kWh of grid electricity in Ghana, which is 0.118 $/kW (March 2021), and the estimated demand of 81,782 kWh, the payback period can be determined using EquationEquation 10(10)
(10) .
Case I offers a simple payback period of 19 years, which is unattractive for private business investment. Grants help to improve the financial viability of the hybrid systems. examines the effect of grants under different tariff rates have on the profitability of the optimum system. The results reveal that the simple payback period improves as the tax rate increases, reaching less than 10 years for a tax rate of about 0.6 $/kWh or more. Therefore, it is necessary to apply some form of incentive to encourage investment in this system. Green energy incentives such as capital subsidies significantly improve the profitability or financial viability of hybrid systems.
Figure 3. Effect of a grant on payback period under different tariffs conditions
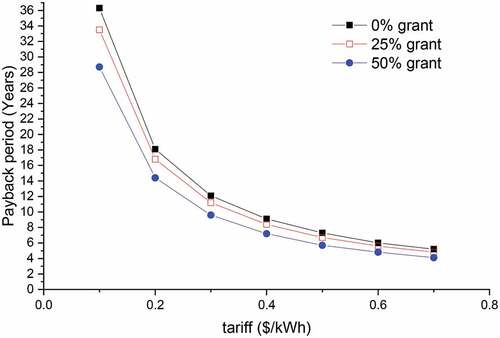
It can be seen from that the simple payback period of the reference case can be reduced from 19 to 17 years with a grant of 25% of the total initial cost, while the subsidy of 50% shows a simple payback period of 14.8 years. The results in also show that payback periods of less than 10 years require a judicious mix of capital subsidies and right tariffs. This is what individual investors pay attention to as most investors are interested in projects that involve a simple payback period of not more than 10 years.
A comparative analysis of similar studies conducted in Ghana and other countries using HOMER was carried out to validate the results of this study and provide stakeholders with a global perspective. Based on the information provided in , the COE of the PV/diesel/battery storage system in this study compares favourably with similar studies. The small difference in COE may be partly due to the relative different hybrid configurations of the various studies. Although the economics of such projects depends on the site, the analysis still provides further insights for project appraisals.
Table 4. Review of selected similar studies
3.2. Sensitivity results
Several iterations of the model were constructed and certain parameters were observed during the course of this research, to have significant impacts on optimal system configuration and cost requirements. These were determined to be an ideal parameter for conducting sensitivity analysis. There are disparities in the reported availability of solar irradiance for the region. Available annual average solar irradiance imported from NASA and applied to the benchmark model (5.54 kWh/m2/d) was likely determined from satellites, not ground measurements. A value of 5.42 kWh/m2/d is provided by the Energy Commission of Ghana as the anticipated annual average solar irradiance available in northern Ghana. To evaluate the impact of anomalous reductions on available solar irradiation, a range of 5.0 to 6.0 kWh/m2d was analyzed. Since interest rates are a major determining factor in NPC calculations and, subsequently, HOMER’s optimal system ranking, interest rate sensitivities were run ranging from 0% to 25%. Generator sizes that were considered for the sensitivities analysis include 0, 10, 20, 30, 40, 50, 60 kW, while, in the case of PV, converter and battery capacities, the HOMER optimizer algorithm was used to automatically select the best capacity for the sensitivity cases. However, an upper limit of 150 kW was set for the PV capacity.
The discount rate is the interest rate used to determine the present value of an investment. It measures the present value of a project’s future cash flows. shows the impact of discount rates on system NPCs and COEs
Figure 4. Impact of discount rates on system NPC and COE
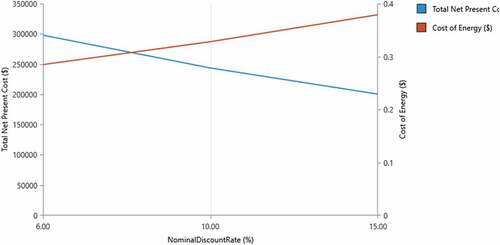
It can be seen that the cost of energy increases as the discount rate increases, while NPC decreases as the discount rate increases. When the discount rate is reduced from 10% to 6%, the COE of the system is reduced by about 28%, while the NPC is increased by about 25%. These changes are due to the discount rate affecting the system’s annualized total. The annualized cost decreases as the discount rate decreases, which leads to a decrease in COE. Generally, capital-intensive technologies are sensitive to changes in discount rates. Therefore, policies aimed at facilitating the development of this system should be geared towards providing investors with a low discount rate to attract the implementation of the system and create a profitable COE for customers.
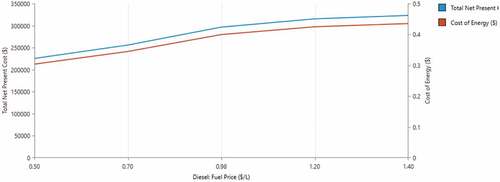
Over the years, the fuel market in Ghana has been turbulent. The country’s oil prices are affected by factors such as exchange rates, international oil prices, and inflation. Therefore, it is necessary to predict the economic viability of such fluctuations in projects that may depend on fuel for their operation. The average price used in this study is 5.66 GHS, equivalent to $0.98 at the current exchange rate of $1 = 5.783 GHS (April 2021). An analysis of the fuel costs of diesel generators shows that fuel costs have an increasing impact on the NPC and COE of both systems. This is because the cost of generation from diesel generator largely depends on the fuel cost. The generators in the hybrid system operate almost throughout the year to supplement the generation from the PV system.
As shown in , if the fuel cost is reduced to 0.7 $/liter, the cost of energy of the optimal system may be reduced to 0.35 $/kWh on average. If the cost of fuel can be lowered even further, it can even be lowered further, making the system more competitive.
Figure 5. Impact of fuel price on system NPC and LCOE
An additional study was conducted on the impact of solar radiation and diesel prices on the net present cost and cost of energy. shows the total net present cost under different diesel prices and solar radiation
Figure 6. Effect of variation in fuel price and solar radiation on NPC
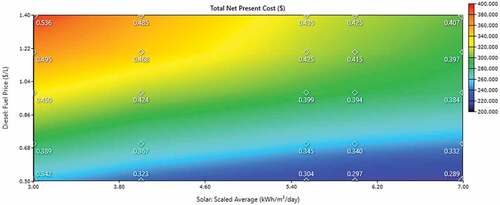
In there is a clear trend of decreasing cost of energy decreases in response to falling diesel prices and higher amounts of solar radiation. The findings provide evidence that the cost of energy will decrease as the price of diesel decreases and the amount of solar radiation increases.
4. Conclusion
The hybrid system is cost-effective for the electrification of isolated communities in northern Ghanaian. The most cost-effective system is a PV-diesel generator battery-converter installation (Case I), with a total NPC of $296,552 and a COE of 0.399 $/kWh. This system has a renewable penetration of 40%, and the excess power generation is 10.6%, with no capacity shortage. The next attractive configurations that can be implemented are the diesel with battery storage (Case II) and PV and battery storage systems (Case III), which have NPC of $388,358 COE of 0.523 $/kWh and NPC of 580,170 COE of 0.782 $/kWh, respectively. Although these systems are more expensive compared to the optimum system, they are still cost-effective compared to the generation of power from a diesel-only system (Case IV). Moreover, the diesel-only system has poor environmental performance. These results confirm the multiple benefits of using a hybrid grid-connected system as described in previous studies (Al-Badi, Citation2011). These include increased reliability and energy services, reduced emissions and pollution, continuous power supply and increased operating life. Energy is supplied from three different sources operating in parallel, and reliability and energy services are automatically improved, given the fact that each of the sources is highly reliable
The optimum system that consists of 40 kW PV, 30 kW generator and 108 batteries with a 28.8 kW converter yields a simple payback period of 19 years at the current bulk tariff of 0.118 $/kWh, which is unattractive for private business investment. Bulk supply tariffs of 0.4 $/kWh will be required to have a simple payback period of 10 years under reference conditions. A reduction in the capital cost of the PV system through financial support mechanisms could be one way of improving the simple payback period and hence increasing the financial viability of this technology. However, a judicious mix of capital subsidies with the right tariff was identified as the best means of reducing the payback period. A 50% capital subsidy for instance will reduce the payback period to 9.31 years at tariffs of $0.30/kWh. Therefore, a judicious mix of major capital subsidies and reasonable tariffs to make the PV system cost-effective.
It is expected that within the next few years, PV systems will become competitive with utility grid power for widespread distributed applications. Hence, there is a need to investigate the potential and performance of PV systems and develop strategies to increase the level of penetration to improve the quality of power supply in the country.
Disclosure statement
No potential conflict of interest was reported by the author(s).
Additional information
Funding
Notes on contributors

Albert K. Awopone
Albert K. Awopone holds a PhD in Electrical Engineering with key competence in Sustainable Energy Systems from Brunel University London. He is currently the Head of Department of Electrical and Electronics Technology at the Akenten Appiah-Menka University of Skills Training and Entrepreneurial Development (AAMUSTED) in Ghana. He is also a visiting lecturer at the Pan African African University of Water and Energy Sciences (PAUWES) in Algeria. His research interests include energy management, energy planning and policy, energy sustainability and distribution automation.
References
- Aburiya, M. A., & Mutaka, M. M. (2007). The effects of solar irradiance and ambient temperature on solar PV module output in Northern Ghana. Ghana Journal of Development Studies, 4(2), 117–15. https://doi.org/10.4314/gjds.v4i2.35065
- Acakpovi, A., Adjei, P., Nwulu, N., Asabere, N. Y., & Pai, P.-F. (2020). Optimal hybrid renewable energy system: A comparative study of wind/hydrogen/fuel-cell and wind/battery storage. Journal of Electrical and Computer Engineering, 2020, 1–15. https://doi.org/10.1155/2020/1756503
- Acakpovi, A., Michael, M. B., & Majeed, I. B. (2017). Grid connected hybrid solar and diesel generator set: A cost optimization with HOMER. Advances in Science, Technology and Engineering Systems Journal, 2(4), 92–98. https://doi.org/10.25046/aj020412
- Adaramola, M. S., Quansah, D. A., Agelin-Chaab, M., & Paul, S. S. (2017). Multipurpose renewable energy resources based hybrid energy system for a remote community in northern Ghana. Sustainable Energy Technologies and Assessments, 22, 161–170. https://doi.org/10.1016/j.seta.2017.02.011
- Agyekum, E. B., & Nutakor, C. (2020). Feasibility study and economic analysis of stand-alone hybrid energy system for southern Ghana. Sustainable Energy Technologies and Assessments, 39, 100695. https://doi.org/10.1016/j.seta.2020.100695
- Al-Badi, A. (2011). Hybrid (solar and wind) energy system for Al Hallaniyat Island electrification. International Journal of Sustainable Energy, 30(4), 212–222. https://doi.org/10.1080/1478646X.2010.503276
- Ali, T., Ma, H., & Nahian, A. J. (2020). Techno-Economic analysis of a hybrid mini-grid in rural areas: A case study of Bangladesh. Journal of Energy Research and Reviews, 4(1),10–29. https://doi.org/10.9734/jenrr/2020/v4i130116
- Ansong, M., Mensah, L. D., & Adaramola, M. S. (2017). Techno-economic analysis of a hybrid system to power a mine in an off-grid area in Ghana. Sustainable Energy Technologies and Assessments, 23, 48–56. https://doi.org/10.1016/j.seta.2017.09.001
- Asuamah, E. Y., Gyamfi, S., & Dagoumas, A. (2021). Potential of meeting electricity needs of off-grid community with mini-grid solar systems. Scientific African, 11(6), e00675. https://doi.org/10.1016/j.sciaf.2020.e00675
- Awopone, A. K., & Zobaa, A. F. (2017). Analyses of optimum generation scenarios for sustainable power generation in Ghana. AIMS Energy, 5(2), 193–208. https://doi.org/10.3934/energy.2017.2.193
- Awopone, A. K., Zobaa, A. F., & Banuenumah, W. (2017b). Techno-economic and environmental analysis of power generation expansion plan of Ghana. Energy Policy, 104, 13–22. https://doi.org/10.1016/j.enpol.2017.01.034
- Awopone, A. K., Zobaa, A. F., Banuenumah, W., & Aminifar, F. (2017a). Assessment of optimal pathways for power generation system in Ghana. Cogent Engineering, 4(1), 1314065. https://doi.org/10.1080/23311916.2017.1314065
- Descoqs, B., & Bhattacharyya, S. (2018). Preliminary identification of potential markets for off-grid electrification: Tool development and a case study of Ghana. International Journal of Sustainable Energy, 37(2), 147–172. https://doi.org/10.1080/14786451.2016.1210145
- Energy Commission Ghana. (2021). 2021 Energy outlook for Ghana. Retrieved June 06, 2021, from http://www.energycom.gov.gh/planning/data-center/energy-outlook-for-ghana
- Gyamfi, S., Diawuo, F. A., Kumi, E. N., Sika, F., & Modjinou, M. (2018). The energy efficiency situation in Ghana. Renewable and Sustainable Energy Reviews, 82, 1415–1423. https://doi.org/10.1016/j.rser.2017.05.007
- Gyamfi, S., Modjinou, M., & Djordjevic, S. (2015). Improving electricity supply security in Ghana—The potential of renewable energy. Renewable and Sustainable Energy Reviews, 43, 1035–1045. https://doi.org/10.1016/j.rser.2014.11.102
- HOMER Energy. (2020). HOMER Pro 3.14 User Manual. Retrieved September 08, 2021, from https://www.homerenergy.com/products/pro/docs/latest/how_homer_calculates_the_maximum_battery_charge_power.html
- International Energy Agency, International Renewable Energy Agency, United Nations, World Bank Group and World Health Organization. (2018). Tracking SDG7: The Energy Progress Report 2018. World bank. Retrieved June 06, 2021, from http://hdl.handle.net/10986/29812
- IRENA. (2019). Renewable energy highlights. Retrieved June 06, 2021, from https://www.irena.org/-/media/Files/IRENA/Agency/Publication/2019/Jul/IRENA_Renewable_energy_highlights_July_2019.pdf?
- IRENA. (2021a). Prospects for the African Power Sector. 2021: International Renewable Energy Agency. Retrieved August 01, 2021, fromhttps://www.irena.org/-/media/Files/IRENA/Agency/Publication/2011/Prospects_for_the_African_PowerSector.pdf
- IRENA. (2021b). Renewable Capacity Statistics 2021. Retrieved August 01, 2021, from https://www.irena.org/publications/2021/March/Renewable-Capacity-Statistics-2021
- Lambert, T., Gilman, P., & Lilienthal, P. (2006). Micropower system modeling with HOMER. Integration of Alternative Sources of Energy, 1(1), 379–385. https://doi.org/10.1002/0471755621.ch15
- Lilienthal, P., Lambert, T., & Gilman, P. (2004). Computer modeling of renewable power systems. Encyclopedia of Energy, 1, 633–647. http://dx.doi.org/10.1016/b0-12-176480-x/00522-2
- Menyah, K., & Wolde-Rufael, Y. (2010). Energy consumption, pollutant emissions and economic growth in South Africa. Energy Economics, 32(6), 1374–1382. https://doi.org/10.1016/j.eneco.2010.08.002
- NASA. (2020) NASA prediction of worldwide energy rResources. Retrieved August 09, 2021, from https://power.larc.nasa.gov/
- Nathaniel, S. P., & Iheonu, C. O. (2019). Carbon dioxide abatement in Africa: The role of renewable and non-renewable energy consumption. Science of the Total Environment, 679, 337–345. https://doi.org/10.1016/j.scitotenv.2019.05.011
- Odoi-Yorke, F., Woenagnon, A., & Kalam, A. (2021). Techno-economic assessment of solar PV/fuel cell hybrid power system for telecom base stations in Ghana. Cogent Engineering, 8(1), 1911285. https://doi.org/10.1080/23311916.2021.1911285
- Olatomiwa, L., Mekhilef, S., Huda, A., & Ohunakin, O. S. (2015). Economic evaluation of hybrid energy systems for rural electrification in six geo-political zones of Nigeria. Renewable Energy, 83, 435–446. https://doi.org/10.1016/j.renene.2015.04.057
- Reddy, V. S., Kaushik, S. C., & Panwar, N. L. (2013). Review on power generation scenario of India. Renewable and Sustainable Energy Reviews, 18, 43–48. https://doi.org/10.1016/j.rser.2012.10.005
- Sakah, M., Diawuo, F. A., Katzenbach, R., & Gyamfi, S. (2017). Towards a sustainable electrification in Ghana: A review of renewable energy deployment policies. Renewable and Sustainable Energy Reviews, 79, 544–557. https://doi.org/10.1016/j.rser.2017.05.090
- Sokona, Y., Mulugetta, Y., & Gujba, H. (2012). Widening energy access in Africa: Towards energy transition. Energy Policy, 47, 3–10. https://doi.org/10.1016/j.enpol.2012.03.040