
 ?Mathematical formulae have been encoded as MathML and are displayed in this HTML version using MathJax in order to improve their display. Uncheck the box to turn MathJax off. This feature requires Javascript. Click on a formula to zoom.
Abstract
Service life of reinforced concrete constitutes initiation and propagation period. Tensile strength is among the mechanical hardened properties of concrete that influence the corrosion initiation. This research work examines the relationship between split tensile strength and corrosion initiation period of reinforced concrete. The physical and chemical properties of the materials were investigated for compliance for use in reinforced concrete. Concrete of three classes M25, M30 and M35 was cast. For each class,9 specimens for compression and split tensile strength respectively were prepared and tested at 7,14 and 28 days. A model for tensile strength was proposed and compared with other models. A parametric study of the critical penetration depth, -a component of the corrosion initiation period, was done using published models. From the results of the study, the proposed and published tensile strength models compare well. It was also noted that the critical penetration depth increases with an increase in tensile strength. The corrosion initiation period linearly increases with the split tensile strength. The tensile strength of concrete can be considered as an input parameter in the initiation period in corrosion service life models.
PUBLIC INTEREST STATEMENT
Currently, there is an increased construction of water infrastructure projects for supply of clean energy, consumption or irrigation in developing countries. These projects constitute reinforced concrete components as conveyancing, traffic support or housing structures. The performance of the structures at any age within their lifespan should be able to be defined for optimal performance and scheduled rehabilitations. Most codes of practice define a design life but not a structural behavior at a specific age. Corrosion initiation is affected by the hardened properties of concrete. While there is a huge investment in constructing the projects, the risks associated with accidents from their performance are high. It is against this background that the researchers investigated the relationship between the tensile strength and corrosion initiation of reinforced concrete. The results of this study confirmed a relationship between tensile strength and corrosion initiation period of reinforced concrete. The outcome of this research will help engineers in modeling the service life of reinforced concrete water structures.
1. Introduction
Understanding degradation due to corrosion of reinforced concrete water structures is crucial in modelling service life. In a service environment, carbonation and chloride ingress (aggressive agents) will occur until steel corrosion initiates (Huang & Goodwin, Citation2019) and these are the most relevant damaging mechanisms in reinforced concrete structures (Smilauer et al., Citation2013). Carbonation induces a generalized corrosion while the presence of chloride ions in the surroundings of the steel provokes localized corrosion (Yihui et al., Citation2014). During service life, corrosion of reinforcement can be divided into initiation and propagation phase described as shown in (Mogire et al., Citation2020).
Figure 1. Initiation and propagation phase (Mogire et al., Citation2020)
The initiation period (ti) is the time taken by the aggressive agents to reach the reinforcement or passivate the steel. Estimation of corrosion initiation period in RC structures is crucial for minimizing both maintenance costs and failure risks (Nguyen et al., Citation2017). As part of the design life, if a certain amount of steel deterioration until unacceptable degree of corrosion is reached is considered, then the propagation(tp) period is part of the service life (tl) formulated as:
Many achievements on corrosion initiation models due to chloride ingress by diffusion have been reported (Arteaga et al., Citation2011; Khan et al., Citation2017; Šmilauer et al., Citation2017). The corrosion starts when the concentration of chlorides exceeds a critical value in the place of reinforcement restricted to:
where Cs is the chloride content at surface in [kg/m3], Dm(t) is the mean (averaged) diffusion coefficient at time t [m2/s], x is the distance from the surface in [m] and f(w) introduces acceleration by cracking (equals to one for a crack-free concrete). Cs and C (x, t) can be related to a concrete volume or to a binder mass.
The initiation period is influenced by the mechanical properties of concrete and environmental factors. Reinforcement cover depth and porosity are the two main concrete actors. Cover plays a role because carbonation and chloride ingress are diffusion processes whose rate of development is a power function of time. Environmental actions are responsible for the lack of durability of reinforcement as they are the source of temperature cycles, water supply through rain and snow or as a conveyance system, carbonation and chlorides.
During propagation period, the corrosion rate for chlorides depends on the corrosion current density (icorr) is determined based on Faraday’s law (DuraCrete, Citation2000; Rodriguez et al., Citation1996) as:
Where is the average corrosion rate in the radial direction [μm/year], icorr is corrosion current density [μA/cm2] and t is calculated time after the end of initiation period [years].
By integration of EquationEquation (3)(3)
(3) ,
where xcorr is the total amount of corroded steel in radial direction [mm] and Rcorr is parameter, which depends on the type of corrosion [-]. For uniform corrosion (carbonation) Rcorr = 1, corrosion (chlorides) Rcorr = <4; 5.5> according to (Darmawan & Stewart, Citation2007). From EquationEquation (4)(4)
(4) :
Andrade et al. (Citation2010) have developed EquationEquation (6)(6)
(6) for calculating corrosion-induced crack widths of the concrete cover in natural environments based on experimental test results. This equation establishes a relationship between the crack width at any time in corrosion progression with original radius loss.
where w is the crack width (mm), c is the reinforcement cover (mm), ϕ is the original diameter of the bar (mm),xcorr is the radius loss (mm) and k is a factor the value of which is derived from experimental results, taken as 9.5.
Vu and Stewart (RILEM TC 154-EMC, Citation2003) developed an empirical model which gives the corrosion current density at the start of the propagation period (at time t1) as a function of water cement ratio and cover thickness as shown in EquationEquation (7)(7)
(7) :
Where w/c is the water cement ratio obtained from the Bolomey’s formula is the cover thickness (mm).
Substituting EquationEquation (6)(6)
(6) into 5 and t = 0 for the start of the propagation period, the initiation period can be obtained from EquationEquation (8)
(8)
(8) .
The critical penetration depth(xcrit) is the amount of radius loss of reinforcement during corrosion that initiates a longitudinal crack on the surface of reinforced concrete as shown in . (Mogire et al., Citation2018)
Figure 2. Critical penetration depth or the critical radius loss (Xcrit) (Mogire et al., Citation2018)
Substituting xcrit = xcorr for corrosion initiation period in EquationEquation (7)(7)
(7) :
None of the published literature shows the effect of the split tensile strength of concrete on corrosion initiation. This paper presents the results of the study to establish a correlation between the initiation period and the split tensile strength of concrete.
2. Materials and method
This research was conducted at the University of Nairobi Structures/ Concrete laboratory where the physical properties of the materials, sample preparation and testing were done. The chemical properties of the materials were done at State Department of Infrastructure in the Ministry of Transport, Infrastructure, Housing and Urban Development of the Government of Kenya.
2.1. Concrete samples
In the constituent materials for test samples, three series of specimens were prepared with a variation in the concrete characteristic strength. Ordinary Portland cement, clean river sand, 20 mm maximum size coarse aggregate and potable water.
2.2. Experimentation
2.2.1. Concrete composition
The concrete used for this study was of characteristic strength as shown in designed according to the Department of Environment’s Design (DOE) method (Ejiogu et al., Citation2020; Sharma, Citation2020).
Table 1. Basic mix proportions
Using the mix proportions in , fresh concrete was prepared by using an electric mixing pan, poured into the moulds in five layers and vibrated by a vibrating table for 60 seconds. A slump test was carried out to BS EN 12350–2 for each batch of concrete. After 24 hours, the moulds were removed and the concrete specimens cured at normal room temperature in a water tank for 27 days.
2.2.2. Test method for hardened concrete properties
150 mm cube, cylinders with a diameter of 150 mm* 300 mm long, cylinders of diameter 150 mm * 1200 mm and 150 mm *100 mm long in line with BS EN 12390–1:Citation2012 (Citation2012) and BS EN 12390–5 (Citation2009) concrete specimen specifications for compressive strength and tensile strength. A total number of 27 cubes and 27 cylinder specimens for tensile strength prepared, cured and tested according to the methods stipulated in BS EN 12390–2 (Citation2019) [16], BS EN 12390–6 (Citation2009) for 7,14 and 28 days’ compressive strength and tensile strength. Each sample for compressive strength was subjected to loading until failure using an automated electronic testing machine which conforms to BS EN 12390–4 (Citation2019). A Universal testing machine(UTM) maximum load of 2000 kN was used to test the cylinders for tensile strength.
2.2.3. Material properties
Water-soluble chloride ions were found to be zero in fine aggregates, 0.002% in coarse aggregates. The percentage of chloride is less than the maximum limit of 0.03% as per BS EN 12620 (Citation2002) and therefore acceptable for use. Chlorides below the acceptable threshold ensures that total bound chlorides which may contribute to corrosion is minimized. shows the physical and mechanical properties of the aggregates used in this study.
Table 2. Physical and mechanical properties of aggregates
As seen in , the specific gravity of all the aggregates is within the limits of 2.4–3.0 conforming to BS EN Citation1097–6:2013 (Citation2013) and they influence the mix design of the concrete. The optimal concrete strength is attained when the specific gravity of coarse aggregates is higher than that of water and lower than that of cement. The water absorption of the fine aggregates is within the limits of 1%—3% in BS EN Citation1097–6:2013 (Citation2013)] implying a low water absorption hence suitable for concrete works. The low water absorption in the coarse aggregates was taken into consideration in the mix design.
BS EN 12620:Citation2013(2013) give an upper limit of 3% for non-harmful fines. The silt content in the fine aggregate was more than the allowable percentage of silt content, it was washed and oven dried before use. The Aggregates Impact Value is less than 30% specified in KS EAS 18–1: Citation2017 (Citation2017). It therefore follows that Aggregates Impact Value of all the aggregates tested are very suitable for concreting works.
The particle size distribution analysis on a representative sample as shown in of the coarse aggregates for the work was carried out to obtain the proportions by weight of the different sizes of coarse aggregates present. The sample is well graded with a maximum aggregate size was 20 mm.
Figure 3. Gradation of Coarse aggregates
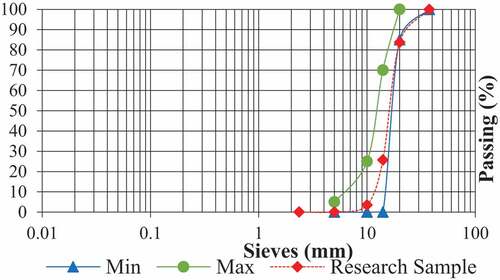
Particle size distribution analysis as shown in on a representative sample of the coarse aggregates for the research was carried out to obtain the proportions by weight of the different sizes of fine particles present according to BS EN 933–1 (Citation2012). The proportions were expressed as percentages by weight passing various sieve sizes conforming to BS 410. The sample is well graded with a maximum aggregate size of 20 mm. From the gradation curve, a portion of the sample falls within the gradation limits. Workability can be achieved with such aggregates without greater fines. This sample is expected to give a sample of high tensile strength and increased corrosion initiation period.
shows the grading of the fine aggregates used in the study. They were well graded and expected to give a well-interlocked composite concrete mix.
Figure 4. Gradation of fine aggregates
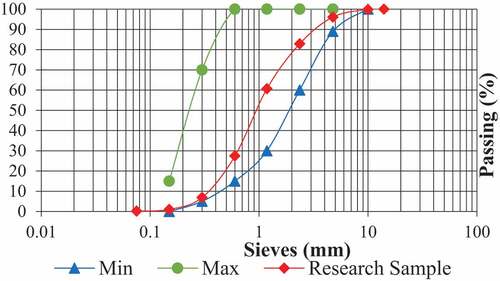
From the gradation curve of , the sample falls within the gradation limits. This minimizes the volume of the cement paste while increasing tensile strength and corrosion initiation period. This gradation is important as the quantity passing the 600 micron was used in the respective mix design of the study.
shows the chemical properties of the selected Cem 1 cement used in the study.
Table 3. Chemical composition of the cement used in the study
From , the sum of calcium oxide (CaO) and silicon dioxide (SiO2) is 80.67% and is greater than 50% as per KS EAS 18–1:2017. Increased sum of CaO and SiO2 increases compressive strength and subsequently, tensile strength and corrosion initiation. Similarly, an increase in insoluble residue reduces compressive strength. The ratio (CaO)/(SiO2) contents in Cem 1 cement should be greater than 2. The restriction is to ensure that the setting of concrete is not inhibited. The ratio of (CaO/SiO2) in interaction with insoluble residue of cement influences the compressive strength.
The quantity of magnesium oxide (MgO) in Cem 1 cement should not exceed 5% (Sharma, Citation2020). The cement samples satisfied this requirement with 1.04%. MgO contributes to the colour of cement and hardness of the resulting concrete. If the quantity of MgO is more than 5%, cracks will appear in concrete, which may reduce the bond strength by reducing the effective length. Cracks may subsequently increase and accelerate the ingress of aggressive agents that may initiate corrosion.
The chloride content in ordinary Portland cement should be less than 0.4%. The cement in this study satisfied this requirement. Chloride content limits ensure a reduced amount available to aggravate corrosion initiation. Na2O, K2O, TiO2 and P2O5 in Cem 1 are considered residues and their sum is limited to 5%(Sharma, Citation2020). If these values are more than 5%, efflorescence and unsightly cracking will occur, thus reducing the tensile strength.
3. Results and discussion
3.1. Results of fresh concrete
The result for the slump test of the fresh concrete is shown in . The slumps obtained are in the medium range (65–93 mm).
Figure 5. Slump for each characteristic strength of concrete in the study
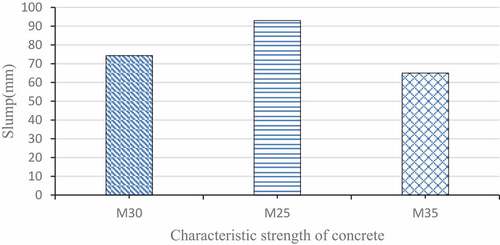
From , M25 had the highest slump while M35 had the lowest slump. Workability increases with increase in slump and this reduces the resulting strength on concrete. This result suggests that tensile strength and corrosion initiation period will decrease with characteristic strength of concrete.
3.2. Results of hardened properties of concrete
shows a relationship between the compressive and tensile strength of concrete used in this study. The strengths are the averages of the concrete of characteristic strength 25 N/mm2,30 N/mm3 and 35 N/mm2 respectively.
Figure 6. Relationship of split tensile strength and compressive strength from the study
The relationship of the tensile and compressive strength from forms a proposed model equation as one of the outputs of this work used to compare with other published models shown in . The coefficient of determination (R2 = 1) is very high. This implies that the 100% of the variability of tensile strength is accounted by the regression model. This result suggests that the developed model is adequate to explain the data. The proposed tensile strength model was used to establish a relationship with the corrosion initiation period of reinforced concrete.
Table 4. Results of hardened properties of the study
shows the results of compressive and split tensile strength of this study and the output of published models.
shows a relationship between split tensile strength and compressive strength as reflected in .
Figure 7. Relationship of split tensile strength and compressive strength from the study
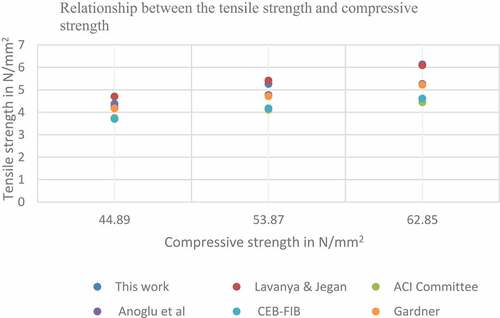
From , it can be noted that the tensile strength of this study generally compares well with the output of other authors but closely relate to the Lavanya and Jegan model, hence reliable in its application.
3.3. Critical penetration depth
shows the critical penetration depth of the samples for this study for a reinforcement bar of 10 mm.
Table 5. Critical penetration depth for the samples
From , was drawn showing a relationship between the critical penetration depth and concrete cover thickness of selected strength by various authors.
Figure 8. Relationship between the critical penetration depth and concrete cover thickness for (a)M25, (b) M30 and M35 by various authors
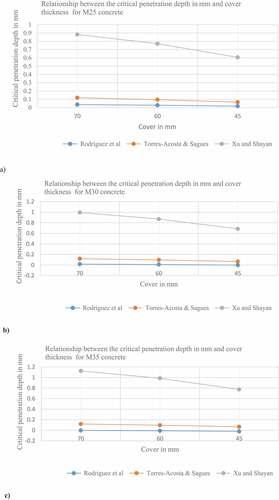
From the results of and , it can be noted that in all the models the critical penetration depth decreased with decrease in concrete cover. The Torres-Acosta and Sagues model has no variation in the strength of concrete. It is also noted that in the Rodriguez et al. model, the critical penetration depth tends to below zero for concrete strength of 30 N/mm2 and 35 N/mm2.This is due to non-consideration of the mechanical properties which affect the resistance of the concrete to cracking. The Xu and Shayan model for critical penetration depth considers the variables considered in this work and has been adopted in calculation of the corrosion initiation period.
shows a relation between reinforcement cover, crack width and critical penetration depth for a 10 mm bar diameter.
Table 6. Relationship between cover, crack width and critical penetration depth
From , it can be noted that the crack width increases with a reduction of concrete cover. Similarly, the critical penetration depth decreases with increase in crack width. Crack evolution and expansion on the surface of a specimen is due to stresses resulting from increase in corrosion products. More corrosion products are required to cause a surface crack in concrete with a larger reinforcement cover and the converse also is true. Similarly, there is an increase in the critical penetration depth with increase in concrete characteristic strength and this is due to increase in tensile strength resisting the expansive pressure of the corrosion products.
3.4. Corrosion initiation period
shows the corrosion initiation period and critical penetration depth from EquationEquation (9)(9)
(9) the Xu and Shayan mode (Shayan & Xu, Citation2016).
Table 7. Result of corrosion initiation period(t1)
shows a relationship between tensile strength and initiation period derived from .
Figure 9. Relationship between tensile strength and corrosion initiation period
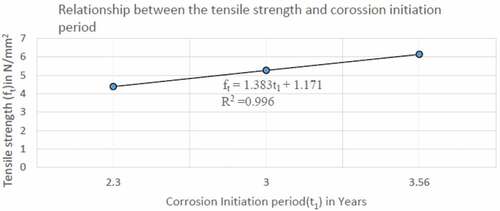
From the corrosion initiation period increases linearly with increase in tensile strength of concrete with a coefficient of determination of 0. 996.This implies that the 99.6% of the variability of tensile strength is accounted by the regression model. This result suggests that the developed model is adequate to explain the data. The crack initiation period is affected by the tensile properties of concrete after depassivation of the reinforcement in concrete.
4. Conclusion
A study of the relationship between the split tensile strength for M25, M30 and M35 concrete and corrosion initiation period has been done in this study. Corrosion initiation period increased with split tensile strength of concrete. A derived linear polynomial model as a function of corrosion initiation period is adequate to account for the variability in the tensile strength data. Based on the test results the following conclusions can be drawn;
Corrosion initiation period is longer with increased concrete cover/reinforcement thickness.
Corrosion initiation period increases linearly with increase of the tensile strength and this relationship can be incorporated in service life models of reinforced concrete.
Disclosure statement
No potential conflict of interest was reported by the author(s).
Additional information
Funding
Notes on contributors

Philip Mogire
Philip Mogire holds a B.Sc.(Civil) and M.Sc.in Civil Engineering (Structural). Currently, he is pursuing a PhD in Civil Engineering at the University of Nairobi, Kenya. He worked as a design engineer for small hydropower projects for three years. He has published several papers in international Journals. He is currently a Projects Engineer in Small Hydro Power projects at VS Hydro (K) Ltd and a Sessional Assistant Lecturer in Structural Engineering at the Technical University of Kenya. His research interests include service life modelling for concrete structures, application of nanotechnology in concrete materials and smart concrete structures.
John Mwero
John Mwero is a Senior Lecturer in the department of Civil and Construction Engineering at the University of Nairobi.
Silvester Abuodha
Silvester Abuodha is an Associate Professor in the department of Civil and Construction Engineering at the University of Nairobi.
Geoffrey Mang’uriu
Geoffrey Mang’uriu is a Professor of Civil Engineering in the department of Civil, Construction and Environmental Engineering at Jomo Kenyatta University of Agriculture and Technology.
References
- ACI Standard. (2014). Building code requirements for structural concrete (ACI 318–14). 720–730.
- Andrade, C., Muñoz, A., & Torres-Acosta, A. (2010). Relation between crack width and corrosion degree in corroding elements exposed to the natural atmosphere. Proceedings, Fracture Mechanics of Concrete and concrete structures, Seoul, Korea: Korea Concrete Institute.
- Aperador, W., Mejia de Getierrez, R., & Bastidas, D. M. (2009). Steel corrosion behaviour in carbonated alkali-activated slag concrete. Corrosion Science, 51(9),2027–2033. https://doi.org/10.1016/j.corsci.2009.05.033
- Arteaga, E. B., Chateauneuf, A., Silva, M. S., Bressolette, P., & Schoefs, F. (2011). A comprehensive probabilistic model of chloride ingress in unsaturated concrete. Engineering Structures, Elsevier, 33(3).
- Arιoglu, N., Girgin, Z. C., & Arιoglu, E. (2006). Evaluation of ratio between splitting tensile strength and compressive strength for concretes up to 120 MPa and its application in strength criterion. ACI Material Journal, 18.
- BS EN 1097–6:2013. (2013). Tests for mechanical and physical properties of aggregates. Determination of particle density and water absorption.
- BS EN 12390–1:2012. (2012). Testing hardened concrete: Shape, dimensions and other requirements for specimens and moulds.
- BS EN 12390–4. (2019). Compressive strength, specification for testing machines.
- BS EN 12390–6 (2009). Testing hardened concrete: Tensile splitting strength of test specimens.
- BS EN 12620:2013. (2013). Aggregates for concrete.
- BS EN 933–1. (2012). Tests for geometrical properties of aggregates - Part 1: Determination of particle size distribution - Sieving method.
- BS EN 12620. (2002). Aggregates for concrete.
- BS EN 12390–16. (2009). Testing hardened concretepart 5: Flexural strength of specimens.
- BS EN 12390–2. (2019). Testing hardened concretepart 2: Making and curing specimen for strength tests.
- CEB-FIP Model Code for Concrete Structures. (1990). Evaluation of the time dependent behaviour of concrete. Bulletin d’Information No. 199, Comite European Du Béton/Fédération Internationale De laPrecontrainte, Lausanne, 1991, 201(11), 184. https://www.icevirtuallibrary.com/doi/Abs/ 10.1680/ceb-fibmc1990.35430
- Darmawan, M. S., & Stewart, M. G. (2007). Effect of pitting corrosion on capacity of prestressing wires. Magazine of Concrete Research, 59(2), 131–139. https://doi.org/10.1680/macr.2007.59.2.131
- DuraCrete. (2000). Probabilistic performance based durability design of concrete structures. The European Union-Brite EuRam III.
- Ejiogu, I. K., Mamza, P. A. P., Nkeonye, P. O., & Yaro, S. A. (2020). Comparison of ACI, IS and DOE methods of concrete mix design. NJE, 27(1), 68–83.
- Gardner, N. J. (1990). Effect of temperature on the early-age properties of type I,type III, and type I/fly ash concretes. ACI Materials Journal, 87(1), 68–78. https://concrete.org/publications/internationalconcreteabstractsportal/m/detail/id/2381
- Huang, I.-W., & Goodwin, F. (2019). Modeling the corrosion related service life of existing concrete structures. Proceedings of the Corossion 2019, Nashville, Tennessee, USA: NACE International.
- Khan, M. U., Ahmad, S., & Al-Gahtani, H. J. (2017). Chloride-induced corrosion of steel in concrete: An overview on chloride diffusion and prediction of corrosion initiation time. International Journal of Corrosion, 2017, 1–9. https://doi.org/10.1155/2017/5819202
- KS EAS 18–1: 2017. (2017). Cement-part 1: Composition, specification and conformity criteria for common cements.
- Lavanya, G., & Jegan, J. (2015). Evaluation of relationship between split tensile strength and compressive strength for geopolymer concrete of varying grades and molarity. International Journal of Applied Engineering Research, 10(15), 35523–35527.
- Mogire, P., Mwero, J., Abuodha, S., & Manguriu, G. (2018). The effect of selected cement brands in Kenya on the critical penetration depth of rust in reinforced concrete water conveyancing structures. International Journal of Scientific and Research Publications, 8(11), 8333. https://doi.org/10.29322/ijsrp.8.11.2028.p8333
- Mogire, P., Mwero, J., Abuodha, S., & Manguriu, G. (2020). A corrosion model for prediction of service life of reinforced concrete water structures. International Journal of Scientific and Research Publications (IJSRP), 10(2), p98104. https://doi.org/10.29322/IJSRP.10.02.2020.p98104
- Nguyen, P. T., Arteaga, E. B., Amiri, O., & Soueidy, C. (2017). An efficient chloride ingress model for long-term lifetime assessment of reinforced concrete structures under realistic climate and exposure conditions. International Journal of Concrete Structures and Materials, 11(2), 199–213. https://doi.org/10.1007/s40069-017-0185-8
- RILEM TC 154-EMC. (2003). Electrochemical techniques for measuring metallic corrosion. Materials and Structures/Matériaux Et Constructions, 36, 461–471. https://doi.org/10.1617/13718
- Rodriguez, J., Ortega, L. M., Casal, J., & Diez, J. M. (1996). Corrosion of reinforcement and service life of concrete structures. In Proc. Of Int. Conf. On Durability of Building Materials and Components, 1, 117–126. https://www.researchgate.net/publication/285739202
- Sharma, M.(2020).Seismic potential parameter of concrete gravity dam. Conference: Recent trend in Civil Engineering. https://doi.org/10.13140/RG.2.2.28803.45600
- Šmilauer, V., Hájková, K., Jendele, L., & Červenka, J. (2017). Durability assessment of reinforced concrete structures due to chloride ingress up and beyond induction period. In the 39th IABSE Symposium – Engineering the Future. September 21–23, Vancouver, Canada: IABSE/vancouver.
- Shayan, A., & Xu, A. (2016). Relationship between reinforcing bar corrosion and concrete cracking. Aci Materials Journal, 113(1), 3–12. https://doi.org/10.14359/51688460
- Smilauer, V., Jendele, L., & Cervenka, J. (2013). Prediction of carbonation and chloride ingress in cracked concrete structures. In the proceedings of the Fourteenth International Conference on Civil, Structural and Environmental Engineering Computing, Civil-Comp Press, Stirlingshire, UK, Paper 215. https://doi.org/10.4203/ccp.102.215
- Torres-Acosta, A., & Sagüés, A. (2004). Concrete cracking by localized steel corrosion - geometric effects. ACI Materials Journal, 101(6), 501–507. https://www.concrete.org/publications/acimaterialsjournal.aspx
- Yihui, Z., Gencturk, B., Kaspar, W., & Arezou, A. (2014). Carbonation-induced and chloride-induced corrosion in reinforced concrete structures. Journal of Materials in Civil Engineering, 27(9). https://doi.org/10.1061/(ASCE)MT.1943-5533.0001209.