
 ?Mathematical formulae have been encoded as MathML and are displayed in this HTML version using MathJax in order to improve their display. Uncheck the box to turn MathJax off. This feature requires Javascript. Click on a formula to zoom.
Abstract
The spread of Coronavirus Disease-2019 worldwide necessitates the development of accurate identification methods and the determination of genetic relatedness. The result of genomic methods involving nucleotide alignment informed the considerations of several alignment-free techniques for virus detection. This paper presents a genomic sequence identification model, developed based on Genomic Signal Processing (GSP), deep learning, and genomic datasets of Coronavirus 2 (SARS-CoV-2), Severe Acute Respiratory Syndrome CoV (SARS-CoV), and Middle East Respiratory Syndrome CoV (MERS-CoV). Our results showed that the Z-Curve images for the three viral strains depicted high visual similarities in texture and color, thus making it difficult to differentiate the strains by visual inspection. However, the homogeneity distance showed that SARS-CoV-2 is closer to SAR-CoV than MERS-CoV. Following a validation accuracy of 98.33%, it became clear that Z-Curve images for MERS-CoV, SARS-CoV and SARS-CoV-2 have distinct features after transformation by the Convolutional Neural Network (CNN) classifier. The divergence in texture and color reflects genetic variation among the strains, which is too insignificant for differentiation via visual inspection. Our results showed that higher layers of CNN amplify aspects of input images that are critical for discrimination, thereby confirming the importance of deep learning and GSP in accurate viral detection.
PUBLIC INTEREST STATEMENT
Epidemiological effects of Coronavirus Disease-2019 (COVID-19) worldwide demand for the development of accurate methods to effectively determine the causative agent. The demerits of existing side-by-side comparison methods for sequences informed the need for other methods for virus detection. This paper explores Genomic Signal Processing (GSP) and deep learning to identify and compare the genomic datasets of Coronavirus 2 (SARS-CoV-2), Severe Acute Respiratory Syndrome CoV (SARS-CoV) and Middle East Respiratory Syndrome CoV (MERS-CoV). The image generated (Z-Curve) were visually and texturally similar for the three coronaviruses, but the homogeneity distance reflected that SARS-CoV-2 is closer to SAR-CoV than MERS-CoV. The Z-Curve images of the viruses along with Artificial Intelligence effectively differentiated the three strains of Coronavirus with high accuracy compare to visual inspection of the images. This confirms the importance of the DeepCOVID-19 model for accurate viral detection, which could ultimately be translated into clinical tool for prompt diagnosis, administration of specific therapy and monitoring of response to treatment by clinicians.
1. Introduction
For many reasons, the year 2020 will not be easily forgotten in the annals of human history. Apart from being the beginning of a new decade, it is also the year that has ushered in the most recent pandemic, which is ravaging the whole world. A pandemic caused by Severe Acute Respiratory Syndrome Coronavirus 2 (SARS-CoV-2), code named COVID-19. It broke out in December 2019 in Wuhan, a province in China but have since spread to almost every country of the world, infecting millions of people at a very alarming rate. Within a space of 11 months that COVID-19 broke out, over 46 million (>46,000,000) confirmed positive cases of human infections have been recorded and over 1 million, 200 thousand (>1,200,000) human deaths have been recorded worldwide (World Health Organization (WHO), Citation2020a). These statistics underscore the pandemic nature of this viral disease. According to the General Directorate of Health in Portugal, the transmission of COVID-19 can spread through respiratory droplets, direct contact with respiratory secretions, infected faeces or contaminated surfaces, and airborne transmission through aerosol generators (Chan et al., Citation2020; Perlman, Citation2020).
Paramount in the minds of every human, including researchers today is how to stem the tide of this pandemic. Research activities are ongoing in developing vaccines to prevent and cure the disease. However, forerunner research to the development of viable vaccines will be to understand how human genomes are impacted by Coronavirus activities. An identification model for the virus determined from the genomics characterization and quantification level needs to be developed. Coronavirus constitutes the subfamily Orthocoronavirinae, in the family Coronaviridae, order Nidovirales, and realm Riboviria. They are enveloped viruses with a positive-sense single-stranded RNA genome and a nucleocapsid of helical symmetry (Almeida et al., Citation1968).
To characterize, quantify, and analyze genomics data, an aspect of Artificial Intelligence (AI) is a viable state-of-the-art option. Deep learning technique is an aspect of AI that is adopted in this research to develop an identification model for COVID-19 genome sequences. Deep learning, a subset of machine learning contains multiple and hierarchical layers of artificial neurons to carry out the process of machine learning. The hierarchical functions in deep learning systems enable machines to process data in a nonlinear way (Yu & Deng, Citation2011).
In this study, genomic sequences of the MERS-CoV, SARS-CoV, and SARS-CoV-2 strains were extracted from the Virus Pathogen Database and Analysis Resource (ViPR) (Pickett et al., Citation2011). Encoding was done using GSP, which is the application of Digital Signal Processing (DSP) theories and algorithms to transform, analyze, and interpret the information that is inherent in the genome. The rest of this paper comprises a literature review in Section 2, the materials and methods in Section 3, Section 4 contains results and discussion, and the conclusion is presented in Section 5.
2. Literature review
2.1. Genomics of coronaviruses
Coronaviruses (CoV) are among the aetiological agents of human diseases (Chen et al., Citation2020). The critically important group called the Severe Acute Respiratory Syndrome Coronavirus 2 (SARS-CoV-2) belongs to genus Betacoronavirus, subgenus Sarbecovirus (Boheemen et al., Citation2012). SARS-CoV-2 is responsible for COronaVIrus Disease 2019 (COVID-19). Epidemics of Severe Acute Respiratory Syndrome CoV (SARS-CoV) in China in 2002–2003 led to about 10% mortality from 8,000 cases. In addition, there was the endemic Middle East Respiratory Syndrome CoV (MERS-CoV) in the Arabian Peninsula for around 8 years (Cheng et al., Citation2007; Chan et al., Citation2013). Severe Acute Respiratory Syndrome CoV-2 (SARS-CoV-2) is a single-stranded (positive-sense) RNA virus. The RNA genome is linked to a nucleoprotein inside a capsid containing matrix protein. Structurally, they are either spherical or pleomorphic with glycoprotein projection in its envelope. (Haan et al., Citation1998) remarked that some Coronaviruses bear Hemagglutinin-Esterase (HE) protein.
Four genera of Coronaviruses (CoV) are:
Alpha (α)
Beta (β)
Gamma (γ)- and
Delta (δ).
The first two groups can infect mammals, while the third and fourth groups are usually avian pathogens.
When compared with other RNA viruses, Coronaviruses have the largest genomes (26.4 to 31.7 kb) having 32–43% G + C contents. Coronaviruses bear varying numbers of minute Open Reading Frames (ORFs) within their conserved genes below the nucleocapsid gene in their progeny generations. Beginning from the 5ʹ end, their conserved gene is made up of replicase complex (ORFlab), spike, envelope, membrane, and nucleocapsid then the 3ʹend. These are also the main structural proteins designated by the first letters: S for spike, E for envelope, M for membrane, and N for nucleocapsid (Brian & Baric, Citation2005). The S, E, M proteins participate in the viral coating while the N protein is associated with RNA genome assemblage (Wu et al., Citation2020). The Open reading frame, ORF2-10 encodes not only the viral structural proteins such as S, M, N, and E proteins but also other auxiliary proteins (Wu et al., Citation2020). Most prominent here is the M with brief external NH2-terminus virus and an extended COOH terminus within the virion (Haan et al., Citation1998; Huang et al., Citation2004). M is also actively involved in the intracellular synthesis of the virus in the absence of S. When homologous nucleoside antibiotics, Tunicamycin is present, Coronavirus brings about spikeless, nonpathogenic virions with M but without S (Woo et al., Citation2010).
The component polypeptides are metabolized by proteases, which may be normal or those like chymotrypsin and 1 or 2 papains forming 16 Non-Structural Proteins (NSPs), i.e. NSP 1–16 (Chen et al., Citation2020; Banerjee et al., Citation2004; Masters, Citation2006). All the proteins arise from the expression of CoVs’ sgRNAs. Furthermore, Coronaviruses (CoVs) code for these proteins: Hemagglutinin Esterase (HE), membrane-binding 3a/b, and 4a/b. The proteins play integral roles associated with genome maintenance and Virus replication (Boheemen et al., Citation2012; Chen et al., Citation2020).
A typical CoV bears a minimum of six ORFs in its genome (Chen et al., Citation2020; Gennaro et al., Citation2020). Severe Acute Respiratory Syndrome CoV-2 (SARS-CoV-2) genome contains 10 open reading frames (Wu et al., Citation2020). Open reading frame, ORF1ab does for replicase polyprotein 1 ab. The replicase proteins might carry out multiple functions associated with transcription and replication of the viral RNAs when lysed by appropriate protein enzymes. The 2019 novel Coronavirus does not have the hemagglutinin-esterase gene expected in lineage A β-coronaviruses (CoVs).
The ORF1ab gene is made up of ORF1a and ORF1b. The position of the ORF1ab gene is located closely to the starting codon of SARS-CoV-2 at position 251–21541 unlike SARS-CoV and MERS-CoV at 265–21486 and 279–21514, respectively (Biswas et al., Citation2020).
The Genome sequence of SARS-CoV-2, which is 79.5% identical to SARS-CoV, has been reported to be 96.2% identical to CoV RaTG13 from bat (Guo et al., Citation2020). Sequence analysis and phylogeny predict bat as the original virus reservoir, though there are potential intermediate hosts predicted before infecting humans (Guo et al., Citation2020; Mousavizadeh & Ghasemi, Citation2020). Severe Acute Respiratory Syndrome CoV-2 (SARS-CoV-2) might be transmitted from bats via unknown intermediate hosts to infect humans. The similarities of SARS-CoV to other Severe Acute Respiratory syndrome-related Coronaviruses (SARSr-CoV) including SARS-CoV-2 are both in terms of their genome sequences and their affinities for binding to the human ACE2 receptor (Mousavizadeh & Ghasemi, Citation2020; World Health Organization (WHO), Citation2020b).
Also, there is a very close similarity index among various strains of SARS-CoV-2 sequenced in various countries. A phylogenetic analysis of 18 whole-genome sequences from the National Centre for Biotechnology Information (NCBI) (see ) revealed that they were “highly related (with minor potential mutations) to a common ancestor”. Multiple alignments showed a 99–100% alignment. Across three continents, SARS-CoV-2 HKG/HKU 902b, SARS-CoV-2 VNM, SARS-CoV-2 USA-CruiseA-1, SARS-CoV-2 USA-CruiseA-8, SARS-CoV-2 USA-CruiseA-10, SARS-CoV-2 USA-CruiseA-12 and SARS-CoV-2 USA-CruiseA-17 showed identical genome sequence (100% multiple alignment). With this, one may safely predict, as stated earlier that COVID-19 aetiologies are from the same ancestry. The same scenarios were observed in some strains from Wuhan compared to strains from the USA. The concept of multiple alignments that formed the basis of this is no doubt ladened with difficulties for comparing viruses along the genome (Wang et al., Citation2020). This informed the need for several alignment-free techniques for virus detection through genome sequences (Kantorovitz et al., Citation2007; Li et al., Citation2016). The central idea of this current study is hinged on exploring the combination of artificial intelligence and genomic signal processing to predict more effectively the genomic differences between SARS-CoV-2, SARS-CoV, and MERS-CoV.
Figure 1. Phylogenetics trees of full-length sequences showing the likelihood of relatedness of some sequenced strains in China, Hong Kong, Vietnam and USA (Sequence source: NCBI genbank. Molecular Phylogenetic analysis was carried out by the authors. Tree was constructed using Maximum Likelihood method).
2.2. Analysis of genomes with machine learning
Machine learning-based alignment-free methods have been used successfully for a variety of problems, e.g., virus classification to enhance efficient clinical management. They also encompass automated identification and classification of newly diagnosed infections by their genetic similarity to curated reference genotypes (Robertson, Citation2000).
There are many algorithms and studies for the classification of infections relating to the genotypes of disease-causing viruses. Solis-Reyes et al. (Citation2018) proposed an open-source, supervised and alignment-free subtyping technique called KAMERIS using k-mer frequencies in HIV-1 sequences as features. The researchers compared this technique with four other novel techniques. While testing with 2,784 samples of manually curated real-world HIV-1 sequences, the authors reported an overall accuracy of 97% and a processing rate of above 1,500 sequences by KAMERIS. The method was able to provide data security, privacy, transparency and reproducibility benefits above other techniques. This is an advantage especially for those requiring the transmission of HIV-1 sequence data over the network to remote servers. Also, this method was applied to genotype classification of other viruses such as Influenza A, and Hepatitis B and C.
Randhawa et al. (Citation2020) identified an intrinsic COVID-19 virus genomic signature and applied a machine learning-based alignment-free approach for the classification of whole COVID-19 virus genomes. A combination of supervised machine learning and digital signal processing techniques were used for genome analysis and augmented by a decision tree approach. A Spearman’s rank correlation coefficient was used for the result validation. The over 5,000 unique viral genomic sequences, which are 61.8 million bp datasets consist of 29 COVID-19 virus sequences that include Wuhan-Hu-1 complete reference genome of 29,903bp. All the available 28 sequences of COVID-19 Virus and the Bat Betacoronavirus RaTG13 from the GISAID platform with two additional sequences (bat-SL-CoVZC45 and bat-SL-CoVZXC21) were utilized for experiments. A two-dimensional k-mer (oligomers of length k) based numerical representation known as Chaos Game Representation (CGR) was used with a k-mer value of 7 for all the experiments conducted. The magnitude spectra were then calculated by applying Discrete Fourier Transform (DFT) to the genomic signals. Furthermore, a pairwise distance matrix was computed using the Pearson Correlation Coefficient (PCC) as a distance measure between magnitude spectra. The distance matrix was used to generate the 3D Molecular Distance Maps (MoDMap3D) by applying the classical Multi-Dimensional Scaling (MDS). The MoDMap3D represents an estimation of the relationship among sequences based on the genomic distances between the sequences. The feature vectors were constructed from the columns of the distance matrix and were used as an input to train the linear discriminant, linear SVM, quadratic SVM, fine KNN, subspace discriminant, and subspace KNN supervised-learning based classification models. A 10-fold cross-validation was used to train and test the classification models. The trained machine learning models were then used to test the COVID-19 virus sequences. The results obtained by the authors support a hypothesis of a bat origin and classify the COVID-19 virus as Sarbecovirus within Betacoronavirus.
An alignment-free method named Machine Learning and Digital Signal Processing GUI (MLDSP-GUI) was developed in (Randhawa, Hill, Kari et al., Citation2019) with high accuracy for flavivirus genus to species classification. This technique utilized the 2D Chaos Game Representation (CGR) as numerical representation of DNA sequences. The authors posited that the identification of genomic signatures consisting of particular species that exist throughout the genome with species-level accuracy could be achieved with MLDSP-GUI.
In order to unmask the pathogenetic, epidemiological, and clinical features of SARS-CoV-2, hundreds of researchers globally are combining data and developing solutions. Amongst the solutions is the use of machine learning to help identify who is at risk, diagnose patients, predict the virus spread, and fast track drug development. To determine COVID-19 infection, (Xu et al., Citation2020) conducted a comparative study between the use of a Reverse Transcription-Real Time Polymerase Chain Reaction (RT-PCR) and an early screening model using deep learning techniques with pulmonary Computed Tomography (CT) images. The RT-PCR had a relatively low positive rate of early detection for COVID-19 infection, as it was primarily used for the detection of viral RNA from sputum or nasopharyngeal swab. A three-dimensional deep learning model was developed from pulmonary CT image sets, using a total of 618 CT samples. The model learned to separate images and categorize them into COVID-19, Influenza-A, viral pneumonia and non-infections, using a location-attention classification model (Xu et al., Citation2020). The deep learning models developed were effective for early diagnosis of COVID-19 patients, following an overall accuracy of 86.7% from the CT samples taken.
As opined by (Xu et al., Citation2020) and (Zheng et al., Citation2020), the use of RT-PCR as a standard for COVID-19 detection, greatly delays the diagnosis of suspected patients, thereby posing a great deal of unprecedented challenges to prevent the spread of the infection. A training set of 540 patient samples (COVID-positive and COVID-negative) were enrolled in the COVID-19 detection study (Zheng et al., Citation2020). From the samples, 313 and 229 patients were positive and negative respectively. A 3D Deep Convolutional Neural Network (DeCoVNet) was proposed to detect COVID-19 from CT volumes. There are three stages, which consist of the DeCoVNet (the network stem), two 3D residual blocks and a Progressive Classifier (ProClf). The prediction results emanate from the ProClf. It extracts the information in the CT volumes and directly outputs the probabilities of being COVID-positive and COVID-negative. The study affirmed that the algorithm used was a weakly supervised deep learning algorithm. However, it obtained strong COVID-19 detection performance.
Deep learning architectures have been applied in diverse bioinformatics, computer vision, and computational biology studies including classification and prediction of DNA and RNA-binding specificity (Trabelsi et al., Citation2019). According to (Alipanahi et al., Citation2015), the DeepBind for instance, utilized a single layer of convolution in a Convolutional Neural Network (CNN) architecture to learn a signal detector that recapitulate known motifs while (Zeng et al., Citation2016) investigated other parameters in architectures including the number of layers and operations such as pooling. Other studies such as iDeepS (Pan et al., Citation2018) and DanQ (Quang & Xie, Citation2016) have used more complex architectures integrating both the CNN and Recurrent Neural Network (RNN) layer models. In a separate study, the KERGU method (Shen et al., Citation2018), which is a purely RNN-based architecture utilized a layer of bidirectional Gated Recurrent Units (bi-GRUs). This was combined with a k-mer, embedding representation of input sequence to create an internal state of the network that allows it to capture long-range dependencies.
Earlier in this paper, we have highlighted the strong relationship among MERS-CoV, SARS-CoV and SARS-CoV-2 strains. The study at hand thus explores the development of an alignment-free genome analysis pipeline using deep learning and GSP to uniquely identify MERS-CoV, SAR-CoV and SARS-CoV-2 from their genomic sequences in order to facilitate accurate identification of the COVID-19 virus.
3. Materials and methods
3.1. Data acquisition
The genomic sequences used for this study were extracted from the Virus Pathogen Database and Analysis Resource (ViPR). The ViPR is an integrated repository of information about human pathogenic viruses that integrate genome, gene, and protein sequence information. The database is fully funded by the U.S. National Institute of Allergy and Infectious Diseases, National Institutes of Health, Department of Health and Human Services, USA. Apart from direct deposition of genomic sequences and protein data by researchers on ViPR, other data sources include National Centre for Biotechnology Information (NCBI) Genbank, NCBI RefSeq, Research Collaboratory for Structural Bioinformatics (RCSB) Protein Data Bank (PDB), etc (Pickett et al., Citation2011). The database particularly inspired us because it contains up-to-date complete genomic sequences (from real human subjects) for human pathogenic viruses.
We downloaded all the available genome sequences for MERS, SARS-CoV, and SARS-CoV-2 from ViPR at the commencement of this study. Howbeit, we were left with 100 unique samples per category after removing all the duplicates, which culminated in a total of 300 unique samples of the dataset for this study. Notably, the samples for SARS-CoV-2 in the ViPR corpus were drawn from 25 countries due to it being a pandemic virus. The range of the genome sequence length for each sample of the three strains is shown in .
Table 1. The range of genome sequence length of the selected viruses
3.2. Encoding of genomic signals as Z-Curve RGB images
A genome is the complete genetic information of an organism. It is a large biomolecule that is wound by a series of nucleotides, which are arranged in a unique manner for every organism. Nucleotides are distinguished by four bases, which are Adenine (A), Cytosine (C), Guanine (G) and Thymine (T). These bases are engaged to completely specify any Deoxyribonucleic Acid (DNA) as a string of characters {A, T, G, C}. Thus, in GSP the nucleotide sequences of an organism are firstly mapped to the appropriate numerical values (i.e. the genomic signals), which represent the information contained in them (Adetiba & Olugbara, Citation2016; Adetiba et al., Citation2015; Mendizabal-Ruiz et al., Citation2017).
In the literature, the various DNA encoding methods can be grouped into two: (i) Fixed value-based mapping (ii) Biology-based mapping. Due to the ability to capture inherent biochemical and biophysical characteristics from DNA sequences, the latter has been applied for different bioinformatics tasks such as classification of exon and intron sequences, alignment-free genomic distances, viral classification, identification of species, and categorization of sequences as pathogenic or healthy (Adegoke et al., Citation2019; Adetiba et al., Citation2017, Citation2018; Morales et al., Citation2020; Yu et al., Citation2018). In genomic signal processing, there exist many mapping methods such as single atomic number, Electron–Ion Interaction Potential (EIIP), DNA walk, Z-Curve, tetrahedron, Frequency Chaos Game Representation (FCGR), etc. (Borrayo et al., Citation2014; Kwan & Arniker, Citation2009; Randhawa, Hill, Kari et al., Citation2019).
However, the Z-Curve and tetrahedron mapping methods capture the base composition and distribution of any given sequence quantitatively thereby possessing rich visualization advantage (Kwan & Arniker, Citation2009). Whereas the base composition provides the total content of each base in a sequence and can be determined easily; the base distribution is more difficult to determine, but provides a better discrimination amongst various genes, even if the base composition are the same. Earlier studies have established Z-Curve and tetrahedron as the “rgb” transformation of DNA sequences (Abo-Zahhad et al., Citation2012), with Z-Curve “RGB” images having a marginal discriminatory edge over tetrahedron “RGB” images (Adetiba et al., Citation2015). Thus, the study at hand leverages Z-Curve mapping to generate “RGB” images for alignment-free identification vis-à-vis classification of the sequences of MERS-CoV, SARS-CoV and SARS-CoV-2.
For a nucleotide sequence of N bases, the cumulative numbers, which represent the base composition of A, C, G and T nucleotides are symbolically denoted as An, Cn, Gn and Tn. In a 3-D coordinate system, Z-Curve is the line that connects the different nodes with coordinates (xi, yi, zi) for i = 0, 1, 2, …, N-1. The corresponding coordinate values of each node are accumulated to form the 3-dimensional Z-Curve “rgb” vectors, which are normalized to obtain (Zhang & Zhang, Citation2002):
As shown in EquationEquation (1)(1)
(1) , each channel captures a distinct relationship between the base compositions and the base distributions of any given nucleotide sequences of length N, with xr[n] corresponding to the distribution of the purine/pyrimidine bases, xg[n] corresponding to the distribution of the amino/keto bases, while xb [n] corresponds to the distribution of the strong/weak hydrogen bonds. The Z-Curve “rgb” vectors for each of the acquired sequences were transformed into a 3-dimensional matrix in the spatial domain using a window size of 200, an overlap of size 50 and each element of the matrix normalized to values between 0 and 255. Furthermore, each of the normalized 3-D matrices was rendered in RGB color space to generate the Z-Curve “RGB” images from our datasets (Adetiba et al., Citation2015; Dimitrova et al., Citation2006; Santo & Dimitrova, Citation2007; Yu et al., Citation2018). Samples of these images are presented in Section 4 of this paper.
3.3. Deep convolutional neural network for image classification
A Convolutional Neural Network (CNN) is a supervised deep learning architecture that uses convolution mathematics in at least one of the layers. It was developed primarily to adapt neural network for image processing tasks. Nothwithstanding, it can be used for other types of temporal, spatial, and spatiotemporal data (Goodfellow et al., Citation2016; Saha, Citation2020). As shown in , a CNN architecture is made up of several layers, which include input layer, convolution layers, max pooling layers, a dense/fully connected layer, and a softmax layer (Saha, Citation2020). The descriptions of each of these layers are hereafter presented with their mathematical representations.
Figure 2. Convolutional Neural Network Architecture.
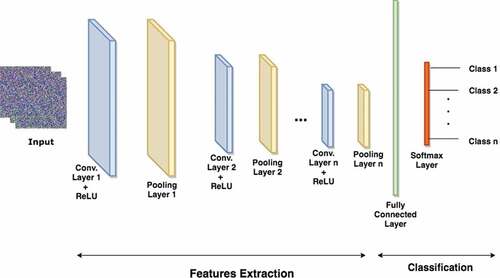
i) Input layer: CNNs are designed to work with grid-structured inputs, which have strong spatial dependencies in local regions of the grid. The most obvious example of grid-structured data is a 2-D image, which exhibits spatial and temporal dependencies. An additional dimension captures the different colors that create a 3-D input volume. Thus, a color image X is a third-order tensor with H rows (height), W columns (width) and D channels (depth) with EquationEquation (2)(2)
(2) showing the relationship:
where 0 ≤ i < H, 0 ≤ j < W, 0 ≤ d < D,
For a grayscale image, there is only one channel with D = 1. For a color image that is stored in Red, Green, and Blue (RGB) color space, there are three channels with D = 3. Each channel is an H × W matrix, which contains the R or G or B pixel (px) values in the range 0 ≤ px ≤ 255.
ii) Convolution layer: Convolution is the mathematical process of implementing a 2-D convolution with a filter (or kernel) on an input image to extract salient image features. The kernel is scanned across the input image and a dot product is computed between the corresponding image and the kernel values using four hyperparameters namely; number of filters (K), spatial dimension of the filter (F), stride (S) and the amount of zero padding (P). The dimension of the input image is H1 × W1 × D1 and the output of the convolution operation is referred to as a feature map (Z) with size H2 × W2 × D2 (Savarese, Citation2020) where;
After getting all the values of the feature map from the kernel computation as shown in EquationEquations (3)(3)
(3) to (5), the map is passed through the Rectified Linear Unit (ReLU) activation function. The ReLU function converts all negative values to zero, which increases the non-linearity of the network and culminates in faster training time (Shafkat, Citation2020). The ReLU function is represented as EquationEquation (6)
(6)
(6) .
Notably, the first convolution layer is responsible for extracting low-level image features like color, edges, and gradient orientation. The upper convolution layers extract high-level features of the image (Shafkat, Citation2020).
iii) Pooling layer: This layer reduces the dimension of a convoluted image by summarizing regions via the application of non-linear downsampling on the feature map. This layer accepts the feature map of dimension H2× W2× D2 as inputs and applies the spatial extent (F) and stride (S) as hyperparameters to produce an output of dimension H3× W3× D3 where;
The available pooling options are, max and average poolings with the max pooling being used commonly in CNN. To perform max pooling, the pooling size (or spatial extent F) and stride (S) are selected. In each selected grid, the highest pixel value is chosen as the value of the corresponding pixel in the new image. On the other hand, for average pooling, the average value of the pixels in the selected grid is computed. The number of pixels to slide the grid across the image is a function of the stride. The sliding of the grid continues until the entire convoluted image (i.e. feature map) is covered (Brownlee, Citation2020).
iv) Fully connected or dense layer: The Fully Connected (FC) or dense layer in a CNN is the last learning phase that maps the extracted features in the previous layers to the desired outputs. The neurons in this layer are fully connected to neurons in the previous and the following layers with links (or edges), which are called weights (W) and biases (b). Assuming there are L layers in the CNN with 0 ≤ l ≤ L and the number of neurons for the lth layer is n[l], the sum of weighted inputs to each layer and the corresponding output from each layer are represented as:
for 1 ≤ i ≤ n[l] where
n[l]—is the number of neurons in the lth layer,
Z[l]—represents the sum of weighted inputs for the neurons in each of the layers,
a[l]—denotes the layers’ neurons activation,
a[0]—is the input layer of the network,
a[L]—is the predicted output from the network,
W[l] and b[l]—are the lth layer’s parameters and,
σ[l]—represents the activation functions for each of the neurons, which may be ReLU as represented in EquationEquation (6)(6)
(6) (Saha, Citation2020; Savarese, Citation2020).
v) Softmax layer: This follows the FC layer output and contains a special kind of activation function. It performs multi-class classification and objects recognition by generating a discrete probability distribution across the neurons in the layer with each neuron representing a label (or class) in the dataset. The probability distribution of softmax activation for a neuron to generate an output y = j given the test dataset X is represented as:
Some state-of-the-art techniques used in CNN to prevent overfitting and enhance generalization include dropout, batch normalization and gradient clipping among others (Goodfellow et al., Citation2016; Savarese, Citation2020).
3.4. Identification of the Coronavirus Z-Curve “RGB” images using deep CNN
Definition 1: Unique identification of the Z-Curve “RGB” images of each of the coronavirus strains is a supervised learning problem (LeCun et al., Citation2015). In supervised learning, the training dataset is {(xj,cj)} with j ε {1, …,N}, where each xj is a training sample, N is the total number of samples in the dataset, and the corresponding set of class labels is cj ε {1, …,m}, where m is the number of classes in the dataset. Therefore, the supervised learning task involves the development of a model with the set of N samples as inputs. The developed model is used to predict the class label during training (or unknown samples during testing) as the outputs. In this study, xj represents the Z-Curve “RGB” images obtained from curated samples of each of the three strains (or extracted features from the images), N = 300 and m = 3 classes (i.e. MERS, SARS-CoV, and SARS-CoV-2).
Definition 2: For image classification with deep CNN, cross-entropy is often engaged during supervised training to evaluate the difference between the expected and actual predictions (Savarese, Citation2020). Given the predictions ŷ, on all examples m, and a target output y, the cross-entropy loss J, is represented as:
3.5. Development of machine learning models
In order to build a supervised learning model using the Z-Curve images generated in this study, we carried out two experiments based on two different deep learning approaches and a third experiment using shallow machine learning approach. In the first experiment, we created our own 15-layer CNN architecture to explore the potency of a natively designed deep learning model based on our experimental exploration of an optimal architecture for the problem at hand. The description of the different layers of the architecture for our designed CNN model is detailed in . The 15-layer architecture has input layer of dimension 227 × 227 × 3 with zero center normalization. There are three convolutional layers, three batch normalization layers, three Rectified Linear Unit (ReLU) layers, two max-pooling layers, one Fully connected (FC) layer of three neurons, one softmax layer, and one classification layer.
Table 2. Parameters of the architecture for the 15-layer CNN model in experiment 1
In the second experiment, we explored Transfer Learning (TL) by adopting AlexNet as the pre-trained CNN model. Notably, AlexNet was trained by Krizhevsky et al. (Krizhevsky et al., Citation2017) with a million images having 1,000 different object classes, thereby possessing rich feature representations for a wide range of image classes.
All our datasets were resized to 227 × 227 × 3, which is the dimension of the AlexNet image input layer (this is the first procedure for using any pre-trained CNN model in TL). Afterward, we transferred all the architectural parameters and weights from the second layer (the first convolution layer) to the 22nd layer (a dropout layer). Since the last three layers of AlexNet were configured for 1,000 classes, we replaced these layers with a fully connected layer. This includes three neurons (for the three classes in this study), a softmax layer, and a classification output layer. The configuration summary of the 25 different layers of our TL-CNN model (based on AlexNet) in the second experiment is presented in .
Table 3. Parameters of the architecture for the AlexNet-based CNN model in experiment 2
The CNN models in the first and second experiments were both trained with a Stochastic Gradient Descent with Momentum (SGDM) optimizer having a learning rate of 0.0001 and a mini-batch size of 10.
Furthermore, we conducted a third experiment with the aim of comparing the deep architectures in the first and second experiments with the classical shallow machine learning approach. This involves the use of Histogram of Oriented Gradient (HOG) as a handcrafted descriptor to extract discriminative features from the Z-Curve images in each of the three classes and Multilayer Perceptron (MLP) as the classifier (Adetiba et al., Citation2015).
HOG is a texture, shape, and appearance descriptor with good invariance to illumination. Earlier works have shown that HOG outperforms the Local Binary Pattern (LBP) descriptor for the extraction of handcrafted features from genomic images (Adetiba et al., Citation2015; Adetiba & Olugbara, Citation2015; Dalal & Triggs, Citation2005). To implement the HOG for this study, we utilized a 3 × 3 block of cells and 9 bins, which culminated in a feature vector of 81 elements from each of the images following the approach (Dalal & Triggs, Citation2005).
Multilayer Perceptron (MLP) neural network is a shallow machine learning method that is commonly used by researchers to solve pattern classification and function approximation problems (Zhang, Citation2000). MLP normally comprises of at least one input layer, one or more hidden layers and an output layer. MLP network with one hidden layer can approximate any continuous functions, while more hidden layers can lead to poor performance due to the vanishing gradient effect in few local minimal (Che et al., Citation2011; Popescu et al., Citation2009). Thus, we configured one input, hidden, and output layer respectively for the MLP. The input layer contains 81 neurons based on the number of elements in each HOG feature vector. The output layer contains three neurons since there are three classes in the dataset while we experimented with varying numbers of neurons in the hidden layer from 10 to 100 in step of 10.
Other configuration details of the MLP model are presented in .
Table 4. Configurations of the mlp neural network
The datasets for the three experiments were partitioned into 80% for training and 20% for validation. The code for the Z-Curve color image transformation was implemented in MATLAB R2020a; we utilized its Deep Learning toolbox for the deep learning experiments while the Neural Network toolbox was used for the third experiment. Our development system is an HP ML110 G7 server with four core Intel Xeon processor. The results of these experiments are presented in Section 4.
4. Results and discussions
The Z-Curve color images as well as the power spectrum plots for MERS-CoV, SARS-CoV, and SARS-CoV-2 are shown in . Through visual inspection of , it is evident that the texture of the Z-Curve images of the Coronavirus strains is fine-grained and highly similar. Apart from the textural similarity, the color distributions and rendering of the images are so similar that it is difficult to differentiate the strains by mere qualitative visual inspection. However, we carried out a quantitative analysis of each of these images based on contrast and homogeneity measures. These measures are both second-order Haralick statistical values used for quantification and/or differentiating the textural features of images (Adetiba et al., Citation2015; Gebejes & Huertas, Citation2013). Images with heavy texture usually have high contrast with low homogeneity values, while the reverse is the case for images with soft texture. The low contrast values obtained for all the strains as shown in confirm the soft texture of the images. Nonetheless, SARS-CoV-2 posted the highest contrast value (4.6626), followed by SARS-CoV (4.6599) while MERS-CoV has the least value (4.5888). The corresponding homogeneity values are also shown in the Table. In codicil, we computed the Euclidean distance matrices among the three strains based on the contrast and homogeneity values as shown in . This is to quantitatively ascertain the extent of similarity of the Z-Curve image textures. The values we obtained show that the textural characteristics of the three Z-Curve images are very close with borderline distinctiveness. In terms of the contrast values in , SARS-CoV-2 is closer to SARS-CoV with a distance of 0.0027 than to MERS-CoV with a distance of 0.0738. In the same vein, the homogeneity distance presented in indicates that SARS-CoV-2 and SARS-CoV are closer with a distance of 0.0006, while the distance of SARS-CoV-2 to MERS-CoV is 0.0029.
Figure 3. Sample Z-Curve color images for the three Coronavirus strains.
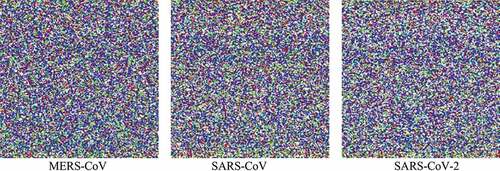
Figure 4. Power spectrum plot for—a) MERS-CoV strain b) SARS-CoV strain and c) SARS-CoV-2 strain.
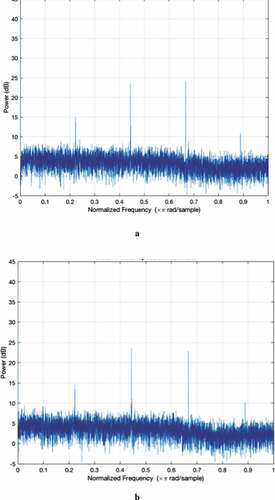
Figure 4. Continued.
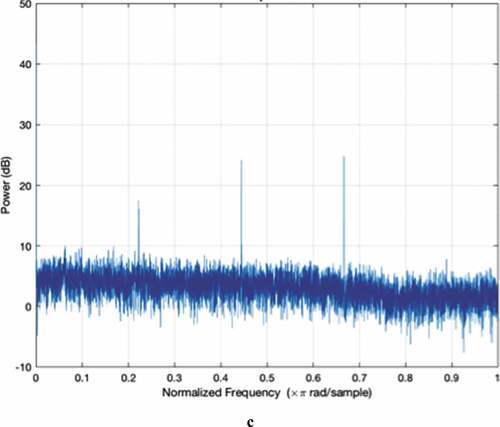
Table 5. Contrast and homogeneity values of the Z-Curve images
Table 6. Z-Curve images’s contrast distance matrix
Table 7. Z-Curve images’ homogeneity distance matrix
Notably, the shapes of the power spectra of the three strains are highly similar in terms of spectral details and sharp peaks as shown in (a–c). Both MERS-CoV and SARS-CoV have four sharp peaks at similar nucleotide positions. In addition, SARS-CoV-2 has three sharp peaks at locations similar to where MERS-CoV and SARS-CoV have the first three sharp peaks, which suggest similar protein-coding locations for the three strains. However, the absence of a fourth sharp peak minimally differentiates the power spectrum of SARS-CoV-2 from the other two.
We further carried out analysis of variance (ANOVA) to test the null hypothesis that the Z-Curve images of MERS-CoV, SARS-CoV and SARS-CoV2 have the same contrast and homogeneity values. At 95% Confidence Interval (CI), p = 1.38e-08 for contrast and p = 3.85e-09 for homogeneity indicate that the textural features of the Z-Curve images of the three strains are not the same despite the similar visual rendering ().
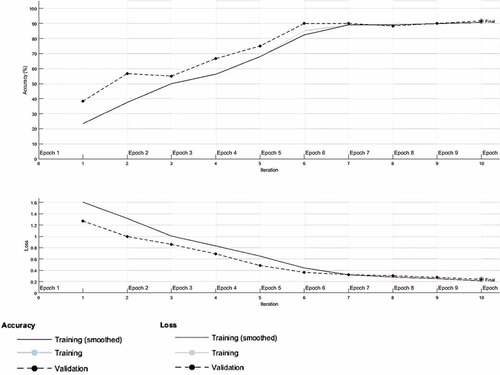
presents accuracy and loss functions with respect to the epoch for the first experiment. The training was completed after 10 epochs with 10 iterations, a training time of 76 seconds, a validation accuracy of 91.67% and a validation loss of 0.2397. The computational strength of the server on which the experiments were performed as well as the number of classes in the dataset provided a basis for the high processing speed obtained for this and other experiments.
Figure 5. Training outcome of the CNN model in the first experiment.
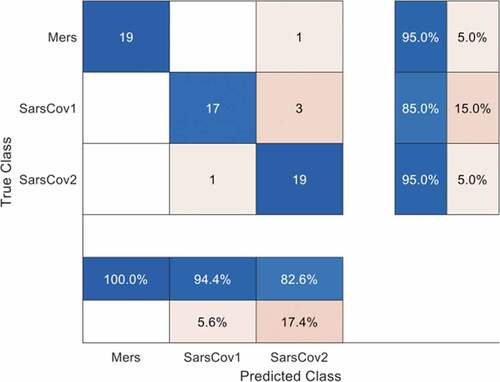
The validation accuracy and loss represent the generalization ability of the CNN model in our first experiment since they were obtained with the testing dataset. The confusion matrix in provides details of the overall accuracy and the accuracy of each of the classes. Note that MERS-CoV is labeled as MERS and SARS-CoV is labeled as SARS-CoV1 in the confusion matrix for programming convenience. shows that one MERS-CoV instance was wrongly classified as SARS-CoV-2, three SARS-CoV instances were wrongly classified as SARS-CoV-2, while one SARS-CoV-2 was wrongly classified as SARS-CoV.
Figure 6. Confusion matrix for the first experiment.
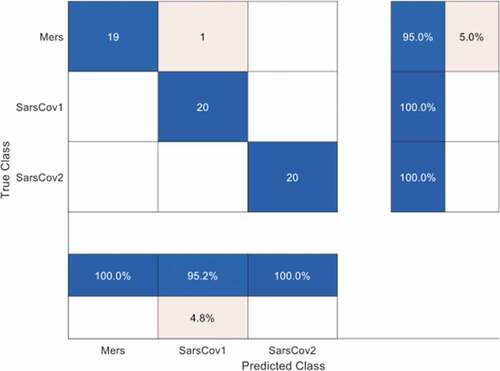
shows the accuracy and loss plots for the TL-CNN model (based on AlexNet) of 25-layers in our second experiment. The model posted a validation accuracy of 98.33% and a loss of 0.0222 after 10 epochs with 240 iterations. The model’s confusion matrix in , which provides details of the overall classification accuracy and the accuracy for each of the classes shows that only one instance of MERS-CoV was misclassified as SARS-CoV. This result strongly attests to the stronger generalization ability of a pre-trained model used for a new task in a similar domain (i.e. transfer learning). Furthermore, we explored the basis for this high accuracy and low loss by unearthing the feature visualization of the fully connected layer (i.e. layer 23) of the second model.
Figure 7. Training outcome of the TL-CNN model in the second experiment.
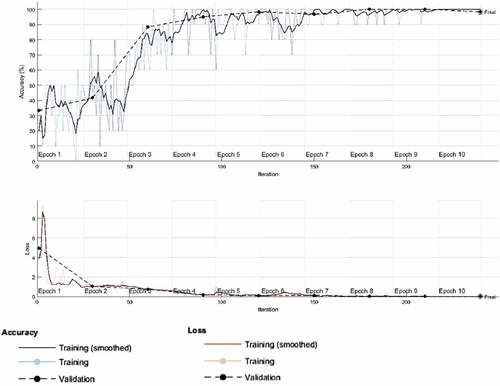
Figure 8. Confusion matrix for the second experiment (TL-CNN model).
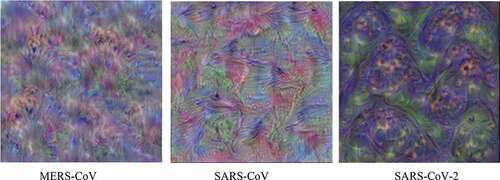
The images that formed the basis for the classification outputs of the second model are shown in . By visual inspection, it is clear that the Z-Curve images for MERS-CoV, SARS-CoV, and SARS-CoV2, respectively, have distinct texture vis-a-vis color features after the transformation by the TL-CNN model. This result is a confirmation that the higher layers of a deep learning model (especially using TL approach) amplify aspects of the input image that are critical for discrimination (LeCun et al., Citation2015).
Figure 9. Features visualization of the last fully connected layer for the second experiment (TL-CNN model).
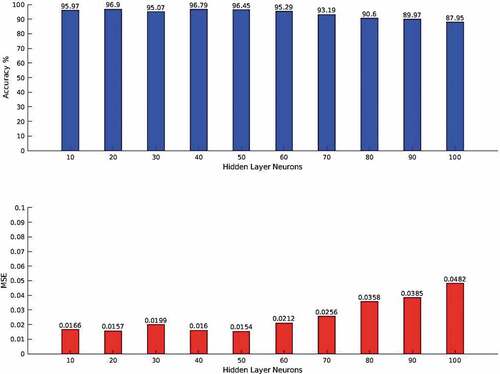
The validation accuracies and MSEs for the third experiment are presented using the bar charts in . The model with 20 neurons in the hidden layer posted the highest accuracy of 96.90% with MSE of 0.0157. From 50 hidden layer neurons (with an accuracy of 96.45% and MSE of 0.0154), the performance of the model degraded gradually until the lowest accuracy of 87.95% (with MSE of 0.0482) was obtained at 100 neurons in the hidden layer. This result implies that the MLP model overfits the training features when the number of neurons in the hidden layer becomes high. The overfitting became appreciable from 80 neurons (with an accuracy of 90.60% and MSE of 0.0358) until the least performance was obtained at 100 neurons. This indicates that for shallow machine learning models, too many neurons in one hidden layer may lead to lack of generalization depending on the underlying characteristics of the dataset. This corroborates an earlier assertion that more hidden layers can lead to poor performance (Popescu et al., Citation2009).
Figure 10. Plots of the accuracy and MSE of the MLP model in the third experiment.
Furthermore, we carried out “deployment” testing in which we curated 10 new samples for each of the classes (MERS-CoV, SARS-CoV, and SARS-CoV2), culminating in a total of 30 samples. These samples were not part of the training/validation samples utilized for building the models. This is to investigate how well the three different models generalize to samples that are not in the training and validation dataset. This also simulates a production scenario in which the model is deployed either in the cloud or on edge devices for real-time analysis of genomic sequences. shows the results obtained. The CNN model of 15-layer that we designed from the scratch in the first experiment could identify 15 (50%) samples correctly (i.e. 1 MERS-CoV, 9 SARS-CoV, and 5 SARS-CoV2). The TL-CNN model in the second experiment identified 27 (90%) samples correctly (i.e. 7 MERS-CoV, 10 SARS-CoV, and 10 SARS-CoV2). While the shallow MLP model identified only 10 (33.33%) samples correctly (i.e. 10 MERS-CoV, 0 SARS-CoV, and 0 SARS-CoV2).
Table 8. “Deployment” testing results
The ANOVA carried out on the “deployment” result shows that the prediction accuracies of the three models are statistically different (p = 1.04e-05). A multi-comparison analysis at 95% CI indicates that the prediction accuracies of the 15-layer CNN (first experiment) and TL-CNN (second experiment) are significantly different (p = 0.002) with a 95% CI of [−0.6711,-0.1289]. Similarly, the difference between the prediction accuracies of the TL-CNN (second experiment) and MLP (third experiment) is statistically significant (p = 0.0000) with 95% CI of [0.2956, 0.8378]. However, the difference between the prediction accuracies of the 15-layer CNN (first experiment) and MLP (third experiment) is not significant (p = 0.3122) with 95% CI of [−0.1044, 0.4378].
The foregoing statistical analysis further attests to the superior performance of the TL-CNN model over the other two models. Thus, the TL-CNN model (tagged DeepCOVID-19 identification model in this paper) is deemed appropriate for the unique identification of SARS-CoV-2 genomic sequences and its explicit differentiation from the highly similar MERS-CoV and SARS-CoV genomic sequences. This model with associated codes and files are available on our Github at (https://github.com/aspmirlab/DeepCOVID-19.git) for interested researchers to download and explore.
Overall, the observed similarity in SARS-CoV-2 and SARS-CoV displayed in the Z-Curve images in , corroborated the assertion of similarities in both Coronaviruses after phylogenetic analysis of full-length genome sequences by Wang et al. (Wang et al., Citation2020). This is further validated by our observation of a closer homogeneity distance of 0.0006 between these two viruses as contained in . This similarity in SARS-CoV-2 and SARS-CoV might also be responsible for the reported genetic clusters among the two members of Betacoronaviruses (World Health Organization (WHO), Citation2020c; World Health Organization (WHO), Citation2020d). The similarity displayed in the Z-Curve images of MERS-CoV with SARS-CoV and SARS-CoV-2 in our study () can as well be attributed to the same genetic clusters of SARS-CoV-2 to other related members of Betacoronaviruses (World Health Organization (WHO), Citation2020c; World Health Organization (WHO), Citation2020d). However, our second experiment in this study, which produced the TL-CNN model, has shown that deep learning, which is a state-of-the-art Artificial Intelligence (AI) method with the GSP-based Z-Curve imaging can accurately differentiate the genomes of the three Coronavirus strains (MERS-CoV, SARS-CoV, and SARS-CoV-2) in spite of their very high similarity. This can be leveraged as a bioinformatics phase in a workflow for differentiation of the three Coronaviruses. In corroboration of our methodology in this study (although in another vital application area of bioinformatics), Morales et al. (Morales et al., Citation2020) recently carried out a study where images generated from Voss mapping and deep learning were utilized to build a model for classification of coding regions, long non-coding regions and pseudogenes with acceptable accuracy. Therefore, our model has proven very effective in differentiating SARS-CoV-2 from their closely related coronavirus strains based on the statistical analysis of our results and the model is thus recommended for further studies and applications.
5. Limitations of the study
An alignment-free-based model that depends on GSP and deep learning has been developed in this study. Besides the general limitations of memory for storing multigenome sequences and the computation requirements, which can be circumvented with the use of state-of-the art cloud platforms, the model is limited to the tested coronaviruses. This kind of limitation is not uncommon in bioinformatics domain, as every microorganism’s identification model needs frequent retraining or dataset updates to be applicable for more microbial diversities and the emergence of mutant or novel strains (Galperin et al., Citation2020). Nevertheless, more training and validation of the model would be done in our follow-up studies to accommodate additional respiratory viruses or even other pathogenic viruses.
MATLAB is one of the scripting environments that is actively used by researchers in GSP, machine learning and bioinformatics, aside from other programming tools like Python, R, Perl and C/C++ (Zielezinski et al., Citation2017). Thus, the computational methods that underlie our model were developed as MATLAB scripts, which most computational researchers in the domain can comfortably use and extend. However, practitioners in bioinformatics may see this as a limitation. Therefore, in order to address this, software developers could supplement the model with either a web application or cloud pipeline for ease of access by practitioners.
6. Conclusion
In this article, the development of a DeepCOVID-19 identification pipeline has been presented. The model was developed based on GSP, deep learning and genomic datasets of Severe Acute Respiratory Syndrome CoV-2 (SARS-CoV-2), Severe Acute Respiratory Syndrome CoV (SARS-CoV), and Middle East Respiratory Syndrome CoV (MERS-CoV) with a validation accuracy of 98.33% obtained with the transfer learning-based approach in the second experiment. Based on this value of accuracy and the statistical comparison of our results, DeepCOVID-19 can successfully differentiate the genomes of the three Coronavirus strains despite their very high similarity. This provides an innovative pipeline for an alignment-free-based sequence analysis with GSP and deep learning, which is a vital contribution to the bioinformatics body of knowledge. This pipeline can be extended and/or adapted to other sequence analysis problems. Thus, our future studies will involve an exploration of the efficacy of the model for other critical bioinformatics tasks.
Acknowledgements
This work was carried out at the Advanced Signal Processing and Machine Intelligence Research (ASPMIR) group laboratory, IoT Enabled Smart and Connected Community Research Cluster, Covenant University. The High Performance Computing node of the Covenant Applied Informatics and Communication African Centre of Excellence (CApIC-ACE) FEDGEN Testbed was utilized for experimentations. The Covenant University Centre for Research, Innovation and Development (CUCRID), Covenant University, Ota, Nigeria provided full sponsorship for the publication of this work.
Disclosure statement
No potential conflict of interest was reported by the author(s).
Additional information
Funding
Notes on contributors
Emmanuel Adetiba
The work reported in this paper is an output of a fruitful collaboration among scholars from Universities in Nigeria and South Africa (as indicated in the affiliation). The formation of the multidisciplinary team was anchored on the need to draw expertise from different scientific, engineering, clinical and spatial backgrounds to tackle the COVID-19 pandemic that almost brought the world to her knees in it’s wake. The erstwhile research activities by this team that provided the impetus for this work include genomic signal processing, artificial intelligence, molecular biology, metagenomics, data mining and big data analytics. The model herein reported provides a gismo that the team (or the larger community of practice) can leverage to develop more accurate, specific and reconfigurable diagnostic solutions for both known and emerging variants of Coronavirus.
References
- Abo-Zahhad, M., Ahmed, S. M., & Abd-Elrahman, S. A. (2012). Genomic analysis and classification of exon and intron sequences using DNA numerical mapping techniques. International Journal of Information Technology and Computer Science, 4(8), 22–26. https://doi.org/10.5815/ijitcs.2012.08.03
- Adegoke, A. A., Adetiba, E., Babalola, D. T., Akanle, M. B., Thakur, S., Okoh, A. I., & Aiyegoro, O. A. (2019). Detection of pools of bacteria with public health importance in wastewater effluent from a municipality in south africa using next generation sequencing and metagenomics analysis. Bioinformatics and Biomedical Engineering Lecture Notes in Computer Science. 11466 , 136–146 doi:10.1007/978-3-030-17935-9_13.
- Adetiba, E., Badejo, J. A., Thakur, S., Matthews, V. O., Adebiyi, M. O., & Adebiyi, E. F. (2017). Experimental investigation of frequency chaos game representation for in silico and accurate classification of viral pathogens from genomic sequences. Bioinformatics and Biomedical Engineering Lecture Notes in Computer Science. 10208. 155–164 doi:10.1007/978-3-319-56148-6_13.
- Adetiba, E., Olugbara, O. O., & Li, X. (2015). Improved classification of lung cancer using radial basis function neural network with affine transforms of voss representation. Plos One, 10(12), e0143542. https://doi.org/10.1371/journal.pone.0143542
- Adetiba, E., Olugbara, O. O., Taiwo, T. B., Adebiyi, M. O., Badejo, J. A., Akanle, M. B., & Matthews, V. O. (2018). Alignment-Free Z curve genomic cepstral coefficients and machine learning for classification of viruses. Bioinformatics and Biomedical Engineering Lecture Notes in Computer Science. 10813 , 290–301. https://doi.org/10.1007/978-3-319-78723-7_25.
- Adetiba, E., & Olugbara, O. O. (2015). Lung cancer prediction using neural network ensemble with histogram of oriented gradient genomic features. The Scientific World Journal, 2015, 117. https://doi.org/10.1155/2015/786013
- Adetiba, E., & Olugbara, O. O. (2016). Classification of eukaryotic organisms through cepstral analysis of mitochondrial DNA. Lecture Notes in Computer Science Image and Signal Processing. 9680 , 243–252. https://doi.org/10.1007/978-3-319-33618-3_25.
- Alipanahi, B., Delong, A., Weirauch, M. T., & Frey, B. J. (2015). Predicting the sequence specificities of DNA- and RNA-binding proteins by deep learning. Nature Biotechnology, 33(8), 831–838. https://doi.org/10.1038/nbt.3300
- Almeida, J. D., Berry, D. M., Cunningham, C. H., Hamre, D., Hofstad, M. S., Mallucci, L., Mcintosh, K., & Tyrrell, D. A. J. (1968). Virology: Coronaviruses. Nature, 220(650), https://doi.org/10.1038/220650b0 , 650–650.
- Banerjee, R., Weidman, M. K., Echeverri, A., Kundu, P., & Dasgupta, A. (2004). Regulation of poliovirus 3C protease by the 2C polypeptide. Journal of Virology, 78(17), 9243–9256. https://doi.org/10.1128/JVI.78.17.9243-9256.2004
- Biswas, A., Bhattacharjee, U., Chakrabarti, A. K., Tewari, D. N., Banu, H., & Dutta, S. (2020). Emergence of novel coronavirus and COVID 19: Whether to stay or die out? Critical Reviews in Microbiology, 46(2), 182–193. https://doi.org/10.1080/1040841X.2020.1739001
- Boheemen, S. V., Graaf, M. D., Lauber, C., Bestebroer, T. M., Raj, V. S., Zaki, A. M., Osterhaus, A. D. M. E., Haagmans, B. L., Gorbalenya, A. E., Snijder, E. J., & Fouchier, R. A. M. (2012). Genomic characterization of a newly discovered coronavirus associated with acute respiratory distress syndrome in humans. mBio, 3(6), doi:10.1128/mBio.00473-12.
- Borrayo, E., Mendizabal-Ruiz, E. G., Vélez-Pérez, H., Romo Vázquez, R., Mendizabal, A. P., Morales, J. A., & Bajic, V. B. (2014). Genomic signal processing methods for computation of alignment-free distances from DNA sequences. PLoS ONE, 9(11), e110954. https://doi.org/10.1371/journal.pone.0110954
- Brian, D. A., & Baric, R. S. (2005). Coronavirus genome structure and replication. Current Topics in Microbiology and Immunology Coronavirus Replication and Reverse Genetics. 287 , 1–30 doi:10.1007/3-540-26765-4_1.
- Brownlee, J. (2020). A Gentle Introduction to Pooling Layers for Convolutional Neural Networks. Retrieved August 20, 2020, from https://machinelearningmastery.com/pooling-layers-for-convolutional-neural-networks/
- Chan, J. F.-W., To, K. K.-W., Tse, H., Jin, D.-Y., & Yuen, K.-Y. (2013). Interspecies transmission and emergence of novel viruses: Lessons from bats and birds. Trends in Microbiology, 21(10), 544–555. https://doi.org/10.1016/j.tim.2013.05.005
- Chan, J. F.-W., Yuan, S., Kok, K.-H., To, K. K.-W., Chu, H., Yang, J., Xing, F., Liu, J., Yip, C. C.-Y., Poon, R. W.-S., Tsoi, H.-W., Lo, S. K.-F., Chan, K.-H., Poon, V. K.-M., Chan, W.-M., Ip, J. D., Cai, J.-P., Cheng, V.-C.-C., Chen, H., Hui, C. K.-M., & Yuen, K.-Y. (2020). A familial cluster of pneumonia associated with the 2019 novel coronavirus indicating person-to-person transmission: A study of a family cluster. The Lancet, 395(10223), 514–523. https://doi.org/10.1016/S0140-6736(20)30154-9
- Che, Z.-G., Chiang, T.-A., & Che, Z.-H. (2011). Feed-forward neural networks training: A comparison between genetic algorithm and back-propagation learning algorithm. International Journal of Innovative Computing, Information and Control, 7(10), 5839–5850, http://www.ijicic.org/10-03015-1.pdf.
- Chen, Y., Liu, O., & Guo, D. (2020). Emerging coronaviruses: Genome structure, replication, and pathogenesis. Journal of Medical Virology, 92(4), 418–423. https://doi.org/10.1002/jmv.25681
- Cheng, V. C. C., Lau, S. K. P., Woo, P. C. Y., & Yuen, K. Y. (2007). Severe acute respiratory syndrome coronavirus as an agent of emerging and reemerging infection. Clinical Microbiology Reviews, 20(4), 660–694. https://doi.org/10.1128/CMR.00023-07
- Dalal, N., & Triggs, B. (2005). Histograms of oriented gradients for human detection. In 2005 IEEE computer society conference on computer vision and pattern recognition (CVPR’05), 1. San Diego, CA, USA, 886–893 doi:10.1109/CVPR.2005.177.
- Dimitrova, N., Cheung, Y. H., & Zhang, M. (2006). Analysis and visualization of DNA spectrograms: open possibilities for the genome research. In Proceedings of the 14th annual ACM international conference on Multimedia. Santa Barbara CA USA, pp. 1017–1024. https://doi.org/10.1145/1180639.1180861.
- Galperin, M. Y., Wolf, Y. I., Makarova, K. S., Alvarez, R. V., Landsman, D., & Koonin, E. V. (2020). COG database update: Focus on microbial diversity, model organisms, and widespread pathogens. Nucleic Acids Research, 49(D1) . https://doi.org/10.1093/nar/gkaa1018
- Gebejes, A., & Huertas, R. (2013). Texture characterization based on grey-level co-occurrence matrix. In Proceedings of the Conference of Informatics And Management Sciences, ICTIC. Yogyakarta, Indonesia, pp. 375–378.
- Gennaro, F. D., Pizzol, D., Marotta, C., Antunes, M., Racalbuto, V., Veronese, N., & Smith, L. (2020). Coronavirus diseases (COVID-19) current status and future perspectives: A narrative review. International Journal of Environmental Research and Public Health, 17(8), 2690. https://doi.org/10.3390/ijerph17082690
- Goodfellow, I., Bengio, Y., Courville, A., & Bengi, Y. (2016). Deep learning (Vol. 1). MIT press.
- Guo, Q., Li, M., Wang, C., Wang, P., Fang, Z., Tan, J., Wu, S., Xiao, Y., & Zhu, H. (2020). Host and infectivity prediction of Wuhan 2019 novel coronavirus using deep learning algorithm. BioRxiv. https://doi.org/10.1101/2020.01.21.914044.
- Haan, C. A. M. D., Kuo, L., Masters, P. S., Vennema, H., & Rottier, P. J. M. (1998). Coronavirus particle assembly: Primary structure requirements of the membrane protein. Journal of Virology, 72(8), 6838–6850. https://doi.org/10.1128/JVI.72.8.6838-6850.1998
- Huang, Y., Yang, Z.-Y., Kong, W.-P., & Nabel, G. J. (2004). Generation of synthetic severe acute respiratory syndrome coronavirus pseudoparticles: Implications for assembly and vaccine production. Journal of Virology, 78(22), 12557–12565. https://doi.org/10.1128/JVI.78.22.12557-12565.2004
- Kantorovitz, M. R., Robinson, G. E., & Sinha, S. (2007). A statistical method for alignment-free comparison of regulatory sequences. Bioinformatics, 23(13), i249–i255. https://doi.org/10.1093/bioinformatics/btm211
- Krizhevsky, A., Sutskever, I., & Hinton, G. E. (2017). ImageNet classification with deep convolutional neural networks. Communications of the jACM, 60(6), 84–90. https://doi.org/10.1145/3065386
- Kwan, H. K., & Arniker, S. B. (2009). Numerical representation of DNA sequences. In 2009 IEEE International Conference on Electro/Information Technology. ON, Canada, pp. 307–310 doi:10.1109/EIT.2009.5189632.
- LeCun, Y., Bengio, Y., & Hinton, G. (2015). Deep learning. Nature, 521(7553), 436–444. https://doi.org/10.1038/nature14539
- Li, Y., Tian, K., Yin, C., He, R. L., & Yau, S. S.-T. (2016). Virus classification in 60-dimensional protein space. Molecular Phylogenetics and Evolution, 99, 53–62. https://doi.org/10.1016/j.ympev.2016.03.009
- Masters, P. S. (2006). The molecular biology of coronaviruses. Advances in Virus Research, 48, 193–292 doi:10.1016/S0065-3527(06)66005-3.
- Mendizabal-Ruiz, G., Román-Godínez, I., Torres-Ramos, S., Salido-Ruiz, R. A., Morales, J. A., & Ouzounis, C. A. (2017). On DNA numerical representations for genomic similarity computation. Plos One, 12(3), e0173288. https://doi.org/10.1371/journal.pone.0173288
- Morales, J. A., Saldaña, R., Santana-Castolo, M. H., Torres Cerna, C. E., Borrayo, E., Mendizabal-Ruiz, A. P., Vélez-Pérez, H. A., & Mendizabal Ruiz, G. (2020). Deep learning for the classification of genomic signals. Mathematical Problems in Engineering, 2020, 1–9. https://doi.org/10.1155/2020/7698590
- Mousavizadeh, L., & Ghasemi, S. (2020). Genotype and phenotype of COVID-19: Their roles in pathogenesis. Journal of Microbiology, Immunology and Infection 24(2) doi:10.1016/j.jmii.2020.03.022 .
- Pan, X., Rijnbeek, P., Yan, J., & Shen, H.-B. (2018). Prediction of RNA protein sequence and structure binding preferences using deep convolutional and recurrent neural networks. BMC Genomics, 19(1). 1–11. https://doi.org/10.1186/s12864-018-4889-1
- Perlman, S. (2020). Another decade, another coronavirus. New England Journal of Medicine, 382(8), 760–762. https://doi.org/10.1056/NEJMe2001126
- Pickett, B. E., Sadat, E. L., Zhang, Y., Noronha, J. M., Squires, R. B., Hunt, V., Liu, M., Kumar, S., Zaremba, S., Gu, Z., Zhou, L., Larson, C. N., Dietrich, J., Klem, E. B., & Scheuermann, R. H. (2011). ViPR: An open bioinformatics database and analysis resource for virology research. Nucleic Acids Research, 40 .D593–D598. doi:10.1093/nar/gkr859.
- Popescu, M. C., Balas, V. E., Perescu-Popescu, L., & Mastorakis, N. (2009). Multilayer perceptron and neural networks. WSEAS Transactions on Circuits and Systems, 8(7), 579–588. https://dl.acm.org/doi/10.5555/1639537.1639542.
- Quang, D., & Xie, X. (2016). DanQ: A hybrid convolutional and recurrent deep neural network for quantifying the function of DNA sequences. Nucleic Acids Research, 44(11), e107. https://doi.org/10.1093/nar/gkw226
- Randhawa, G. S., Hill, K. A., Kari, L., & Hancock, J. (2019). MLDSP-GUI: An alignment-free standalone tool with an interactive graphical user interface for DNA sequence comparison and analysis. Bioinformatics, 36(7), 2258–2259. https://doi.org/10.1093/bioinformatics/btz918
- Randhawa, G. S., Hill, K. A., & Kari, L. (2019). ML-DSP: Machine learning with digital signal processing for ultrafast, accurate, and scalable genome classification at all taxonomic levels. BMC Genomics, 20(1), 267. https://doi.org/10.1186/s12864-019-5571-y
- Randhawa, G. S., Soltysiak, M. P. M., Roz, H. E., Souza, C. P. E. D., Hill, K. A., Kari, L., & Schildgen, O. (2020). Machine learning using intrinsic genomic signatures for rapid classification of novel pathogens: COVID-19 case study. Plos One, 15(4), e0232391. https://doi.org/10.1371/journal.pone.0232391
- Robertson, D. L. (2000). HIV-1 nomenclature proposal. Science, 288(5463), 55–55. https://doi.org/10.1126/science.288.5463.55d
- Saha, S. (2020). A Comprehensive Guide to Convolutional Neural Networks — The ELI5 way. Retrieved August 20, 2020, from https://towardsdatascience.com/a-comprehensive-guide-to-convolutional-neural-networks-the-eli5-way-3bd2b1164a53
- Santo, E., & Dimitrova, N. (2007). Improvement of spectral analysis as a genomic analysis tool. In 2007 IEEE International Workshop on Genomic Signal Processing and Statistics. Tuusula, Finland, pp. 1–4.
- Savarese, S. (2020). Introduction to Convolutional Neural Network. Retrieved August, 2020, from https://web.stanford.edu/class/cs231a/lectures/intro_cnn.pdf
- Shafkat, I. (2020). Intuitively Understanding Convolutions for Deep Learning. Retrieved August 20, 2020, from https://towardsdatascience.com/intuitively-understanding-convolutions-for-deep-learning-1f6f42faee1
- Shen, Z., Bao, W., & Huang, D.-S. (2018). Recurrent neural network for predicting transcription factor binding sites. Scientific Reports, 8(1), 1–10. https://doi.org/10.1038/s41598-018-33321-1
- Solis-Reyes, S., Avino, M., Poon, A., Kari, L., & Tee, K. K. (2018). An open-source k-mer based machine learning tool for fast and accurate subtyping of HIV-1 genomes. Plos One, 13(11), e0206409. https://doi.org/10.1371/journal.pone.0206409
- Trabelsi, A., Chaabane, M., & Ben-Hur, A. (2019). Comprehensive evaluation of deep learning architectures for prediction of DNA/RNA sequence binding specificities. Bioinformatics, 35(14), i269–i277. https://doi.org/10.1093/bioinformatics/btz339
- Wang, C., Horby, P. W., Hayden, F. G., & Gao, G. F. (2020). A novel coronavirus outbreak of global health concern. The Lancet, 395(10223), 470–473. https://doi.org/10.1016/S0140-6736(20)30185-9
- Woo, P. C. Y., Huang, Y., Lau, S. K. P., & Yuen, K.-Y. (2010). Coronavirus genomics and bioinformatics analysis. Viruses, 2(8), 1804–1820. https://doi.org/10.3390/v2081803
- World Health Organization (WHO). (2020a). WHO Coronavirus Disease (COVID-19) Dashboard. Retrieved August 20, 2020, from https://covid19.who.int/
- World Health Organization (WHO). (2020b). Statement on the second meeting of the International Health Regulations (2005) Emergency Committee regarding the outbreak of novel coronavirus (2019-nCoV). Retrieved May, 2020, from https://www.who.int/emergencies/diseases/novel-coronavirus-2019/events-as-they-happen
- World Health Organization (WHO). (2020c). WHO Statement regarding cluster of pneumonia cases in Wuhan, China 2020. Retrieved May 19, 2020, from https://www.who.int/China/news/detail/09-01-2020a-who-statement-regarding-cluster-of-pneumonia-cases-in-wuhan-China
- World Health Organization (WHO). (2020d). Novel Coronavirus – China 2020b. Retrieved May 20, 2020, from https://www.who.int/csr/don/12-january-2020-novel-coronavirus-China/en/
- Wu, C., Liu, Y., Yang, Y., Zhang, P., Zhong, W., Zheng, M., Zheng, M., Zheng, M., Zheng, M., Zheng, M., Zheng, M., Chen, L., & Li, H. (2020). Analysis of therapeutic targets for SARS-CoV-2 and discovery of potential drugs by computational methods. Acta Pharmaceutica Sinica B, 10(5), 766–788. https://doi.org/10.1016/j.apsb.2020.02.008
- Xu, X., Jiang, X., Ma, C., Du, P., Li, X., Lv, S., Yu, L., Chen, Y., Su, J., & Lang, G. (2020). Deep learning system to screen coronavirus disease 2019 pneumonia. arXiv Preprint arXiv:2002.09334. doi:10.1016/j.eng.2020.04.010.
- Yu, D., & Deng, L. (2011). Deep learning and its applications to signal and information processing [Exploratory DSP]. IEEE Signal Processing Magazine, 28(1), 145–154. https://doi.org/10.1109/MSP.2010.939038
- Yu, N., Li, Z., & Yu, Z. (2018). Survey on encoding schemes for genomic data representation and feature learning—from signal processing to machine learning. Big Data Mining and Analytics, 1(3), 191–210. doi:10.26599/BDMA.2018.9020018.
- Zeng, H., Edwards, M. D., Liu, G., & Gifford, D. K. (2016). Convolutional neural network architectures for predicting DNA–protein binding. Bioinformatics, 32(12), i121–i127. https://doi.org/10.1093/bioinformatics/btw255
- Zhang, G. P. (2000). Neural networks for classification: A survey. IEEE Transactions on Systems, Man and Cybernetics Part C: Applications and Reviews, 30(4), 451–462. https://doi.org/10.1109/5326.897072
- Zhang, R., & Zhang, C.-T. (2002). Single replication origin of the archaeon Methanosarcina mazei revealed by the Z curve method. Biochemical and Biophysical Research Communications, 297(2), 396–400. https://doi.org/10.1016/S0006-291X(02)02214-3
- Zheng, C., Deng, X., Fu, Q., Zhou, Q., Feng, J., Ma, H., Liu, W., & Wang, X. (2020). Deep learning-based detection for COVID-19 from chest CT using weak label. medRxiv. https://doi.org/10.1101/2020.03.12.20027185.
- Zielezinski, A., Vinga, S., Almeida, J., & Karlowski, W. M. (2017). Alignment-free sequence comparison: Benefits, applications, and tools. Genome Biology, 18(1), 186. https://doi.org/10.1186/s13059-017-1319-7