
 ?Mathematical formulae have been encoded as MathML and are displayed in this HTML version using MathJax in order to improve their display. Uncheck the box to turn MathJax off. This feature requires Javascript. Click on a formula to zoom.
Abstract
With an ever-growing demand for electronic products around the globe, electronic product-manufacturing organisations are seeking suitable strategies to improve the efficiency of their supply chain processes. Hence, this study seeks to reduce process wastes and exploit bottlenecks present within the supply chain processes of an electronic product-manufacturing organisation. In light of this, lean supply chain strategies premised on the DMAIC methodology were unveiled and validated using a discrete-event simulation approach. We value streamed the supply chain system of an electronic product manufacturing organisation, identified the root causes of the process wastes and inefficiencies present in the organisation’s supply chain and thereafter, identified suitable strategies capable of eliminating these process wastes and inefficiencies based on experts’ opinions obtained during a focus group discussion forum. As a result of this exercise, three types of process wastes were identified and reduced. The simulation results of this study revealed that the idling time experienced at the workstations, and WIP (Work-In-Progress) inventories present within the supply chain system of this organisation, would be reduced by 7.6% and 81.41% respectively while the overall workstations utilisation would be improved by 9.32%, if the supply chain improvement strategies proposed by the authors are implemented at the electronic product-manufacturing organisation considered in this study. In addition, the total non-value added time would also reduce by 63.89 days, thereby having a potential of improving the throughput and the process cycle efficiency of the supply chain system proposed for use, to the organisation by 63% and 8.82%, respectively.
Public Interest Statement
Process wastes elimination within the end-to-end processes of a manufacturing organisation is vital towards productivity improvement. Supply chain managers in various manufacturing organisations are therefore saddled with the responsibility of continuously mapping their processes with a view to minimise and eliminate process wastes present in their end-to-end process chain. Hence, the study deployed the DMAIC approach to (i) identify the bottlenecked workstations as well as the process wastes present in the process workstations of an electronic-product manufacturing organisation, (ii) pinpoint the root causes of the process wastes generated in this organisation and (iii) establish suitable strategies and control measures that could be used to eliminate the process wastes towards improving the productivity of the organisation as well as sustaining the gains achieved by the organisation. The study will benefit supply chain managers, manufacturing organisation policy makers and supply chain management researchers around the globe.
1. Background
Manufacturing organisations have been continuously pressured to eliminate process wastes and improve process cycle efficiency of their supply chain system (Vinodh & Kumar Chintha, Citation2011). Process wastes reduction, and bottleneck exploitation present within supply chain processes, which are vital to ensure supply chain performance improvement, over the years, have become the core objectives of most supply chain managers due to their impact on productivity, quality, cost and safety (Cudney & Elrod, Citation2011). To improve supply chain performance, various manufacturing organisations around the world have implemented strategies tailored towards ensuring the leanness of their supply chain processes, with a focus on eliminating process wastes while increasing values emanating from the actions exhibited by their supply chain processes (Kariuki & Mburu, Citation2013). Values, in this context, are set of manufacturing actions that aid right and prompt production of high-quality products required by the customers. From another perspective, values are set of manufacturing actions that increases the benefits that customers derived from the products produced by an organisation. However, process wastes are set of actions within the supply chain processes of an organisation that do not add value to the customers (Tortorella et al., Citation2017). There are seven (7) types of process wastes that could be generated within the supply chain processes of an organisation, namely; over-processing, waiting/idling, over-production, transportation, motion, defects and inventory (Simboli et al., Citation2014). Of lately, the study of Ibidunni et al. (Citation2014) and Batalova et al. (Citation2016) have identified underutilised skill has the eighth waste that could be experienced within the supply chain system of an organisation.
The concept of “Lean” which was established at a Toyota Production System in a Japanese manufacturing organisation is systematic approach that have been deployed by scientists to identify and eliminate the various process wastes present within the end-to-end processes of an organisation (Čiarnienė & Vienažindienė, Citation2015). Lean as a system reached the supply chain domain in the early 2000 and it is commonly referred to as Lean Supply Chain (Anand, G. & Kodali, Citation2008; Myerson, Citation2012). Increasing the performance and efficiency of supply chain systems by utilising Lean concepts premised on the use of DMAIC methodology has been identified as a suitable approach to lower operations costs and improve the throughput of an organisation (Lee & Chang, Citation2010). Different case studies of lean research projects available in the literature have been tailored towards reducing customer end-rejections in Indian Small and Medium Enterprise; SMEs (Senthilkumar et al., Citation2012), reducing WIP inventory generation in the manufacturing process of an organisation (Cheng, Citation2017), improving the throughput of the manufacturing process of an organisation (Khan et al., Citation2020), reducing workers transportation and waiting time occurrence experienced in the manufacturing process of an organisation (Arafeh et al., Citation2018) as well as, reducing defect production in: (i) a textile environment (Gupta, Citation2013), (ii) rubber glove manufacturing process (Jirasukprasert et al., Citation2014), (iii) polypropylene bag manufacturing process (Sajjad et al., Citation2021) and (iv) telecommunication cabinet door manufacturing process (Abhilash & Thakkar, Citation2019). In addition, previous literature studies have commented on the use of digitization and automation to minimize and alleviate process wastes present in a manufacturing organisation. Haddud and Khare (Citation2018) indicated that the digitalisation of supply chain system offers valuable functions that are tailored towards eliminating the seven types of process wastes generated in a manufacturing environment. The study of Junior and Godinho Filho (Citation2010) unveiled the usage of modern Information, Communication and Technology (ICT) to digitalize Kanban system with a view to ensure effective order-oriented production control. According to them, the usage of e-Kanban system would stimulate easy detection of missing or empty bins as well as ensure the automatic replenishment of empty bins. The study of Hoellthaler et al. (Citation2018) revealed that complementing lean manufacturing activities with various digitization and automation solutions will: (i) ensure individualisation of customers wishes, (ii) stimulate system flexibility, (iii) promote optimized decision making and (iv) enhance the productivity of a manufacturing organisation.
Despite the widely usage of the DMAIC problem-solving methodology to ensure the leanness of the manufacturing and supply chain systems used in an organisation, it was found by the authors that the studies of Raman and Basavaraj (Citation2019) and Jayanth et al. (Citation2020) are the available research studies that have deployed this technique to minimise defect production in an electronic product manufacturing organisation. Hence, this study intends to complement these two (2) studies. This study utilised the DMAIC approach to holistically identify and eradicate various process wastes limiting the performance and efficiency of a supply chain system used in an electronic product manufacturing organisation. The study was limited to the production process of the organisation considered in this study. The structure of the paper is highlighted as follows. Section 2 presents the materials and method using during the course of conducting the study. Section 3 presents and discusses the results obtained from this study and the last section draws relevant conclusions based on the core findings obtained from this study.
2. Research methodology
The DMAIC methodology was used in this study. The define problem phase started with visualizing the entire internal supply chain processes of an ABC Electronic Product-Manufacturing organisation using SIPOC tool, with a view to: (i) identify the internal and external customers of the internal supply chain processes of this organisation and (ii) pinpoint where disruptions emanate from and where they are present within the chain. To complement this action, a Project Charter was thereafter used to outline the scope and goal of the project, the category and the number of people involved in the project. The second phase, which is the measure phase, on the one hand, involve the collection of data about the supply chain process of the organisation, followed by the modelling and simulation of the supply chain system (parametrized with the collected data) using SIMIO software package with a view to identify the bottlenecks present in the supply chain. On the other hand, this phase also involves the utilisation of the core simulated key performance indicator results and other observed data such as defects, motions and transport, to map the entire supply chain process of the organisation as well as visualize/pinpoint the various process wastes present in the supply chain system of the organisation. The data used for this study were collected through system observation for a period of a month. Hence, the authors physically walked through the manufacturing factory from the inbound section, the production section and then finally the outbound section for the first 2 days. The remaining days were deployed by the authors to observe and time the various activities happening within the end-to-end processes of an ABC Electronic Product-Manufacturing organisation. The type of data collected through system observation and using stopwatch for a period of a month are summarized in .
Table 1. Summary of data collected from ABC Electronic Product-Manufacturing organisation for a period of one month
The third phase, which is the analysis phase, on the one hand, involve the analyses of: (i) core process wastes generated within the various workstations of this organisation and (ii) the core workstations whose throughputs are limited by process wastes, using Pareto tool. On the other hand, this phase, also involves the analysis of the root causes of the core and less-influential process wastes generated within the supply chain system of this organisation using a Fishbone Diagram, based on the opinions’ of the team members (who have high wealth of experience about the supply chain processes of this organisation) involved in this project. The fourth phase, which is the improvement phase where the team members (who are supply chain system experts) involved in the project, identified, scrutinized, and ascertained suitable strategies capable of eliminating process wastes present in the supply chain system of the organisation using a solution risk assessment register is depicted in .
Figure 1. Selection metrics for selecting suitable supply chain performance improvement strategies.
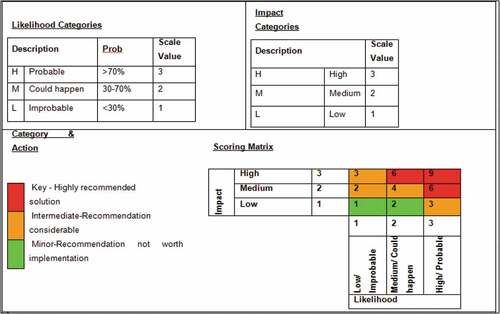
As depicted in , the likelihood of each proposed solution refers to the probability that the proposed solution will eliminate the identified supply chain problem. The impact of each of the proposed solution refers to how much impact the proposed solution has on the entire supply chain of the organisation. The overall weight score of each proposed solution is therefore calculated by multiplying the likelihood score with the impact score of each proposed solution. Proposed solution with an overall weight score of at least 4 points is considered suitable to be implemented in the supply chain system of an ABC electronic product-manufacturing organisation.
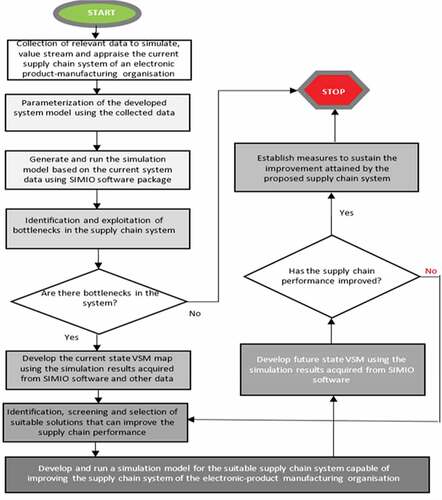
The last phase, which is the control phase, involves establishing various control measures that will help to sustain the gains to be achieved from the suitable strategies proposed at the improve phase. A comprehensive flow-chart methodology, which unveiled how the various research activities in the DMAIC methodology was carried out in achieving the aim of the study is depicted in .
Figure 2. Research framework.
3. RESULTS AND DISCUSSION
3.1. Define phase
3.1.1. The project charter
The project charter revealed the primary metric, secondary metric, problem statement, the project team and the project time-line for the study. The primary metric for this study, which is the success indicator of the project, is “the efficiency of supply chain processes”. This means the overall goal is to improve the efficiency of the supply chain processes. The secondary metrics include the inventory management (stock-outs and excess inventory), waste generated (number of defects, transportation, waiting time, number of motions, processing, and number of units produced) and productivity (turn over and manufacturing lead times). These secondary metrics should not be compromised during the course of improving the efficiency of supply chain process used in the organisation. The project charter identified the project team that assisted the researcher to carry out the stipulated milestones (phases). The authors were assisted by the chief operations officer, supply chain manager, production manager and the department team leaders of the organisation. Defining, measuring, analysing, improving, and controlling the performance of the supply chain were revealed as the five major milestones (phases) for the study. The SIPOC tool was used to define the research project boundaries and identify various internal and external customers within the chain.
3.1.2. Results of the SIPOC analysis of the supply chain
The supply chain system of ABC Electronic Product-Manufacturing organisation is made up of four departments namely the stores, electronic department, mechanical department and the dispatch department. Each department has processing stages required in order to produce finished goods. The SIPOC analysis provides better understanding of the processes and ensures that all the important stages of the supply chain are accounted for throughout the entire project. The internal and external customers and suppliers are both defined together with their needs. The SIPOC chart is presented in .
Figure 3. SIPOC chart of ABC electronic product-manufacturing organisation.
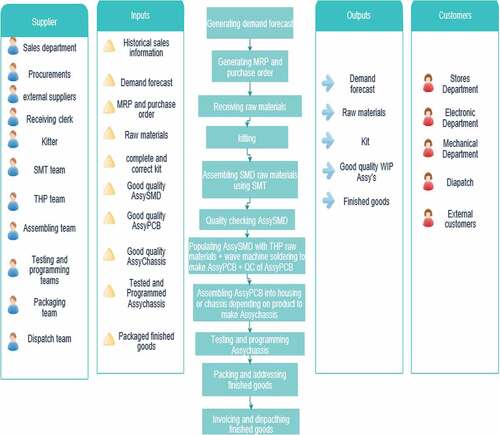
Based on , the various suppliers of raw materials and Work In Progress (WIP) inventories in the supply chain of the organisation could be identified as the sales department, procurements, external suppliers, receiving clerk, and kitter. Others would comprise the surface mount technology (SMT) team, Through-Hole Populating (THP), assembling team, testing and programming teams, packaging team and the dispatch team. The required inputs based on the requirements of various internal and external customers of the chain included historical sales data, MRP and purchase orders, raw materials, complete and correct kit, good quality AssySMD, good quality AssyPCB, good quality AssyChassis, tested and programmed AssyChassis and finished goods. In order to produce the outputs required by the external customers, the various processes such as generating demand forecast, generating MRP and purchase orders, receiving raw materials, kitting, SMT manufacturing, SMD quality check, THP manufacturing, assembling, testing and programming, packaging and dispatching are required. Based on the problems presented in the project charter and the project boundaries identified in the SIPOC tool, the identification of the various locations where these problems emanated within the supply chain and the quantification of these problems were carried out in the measure phase.
3.2. Measure phase
3.2.1. The current end-to-end processes of ABC Electronic product-manufacturing organisation
The supply chain of this organisation is made up of four departments. Firstly, the main store, where procurements and storage of raw materials and kitting takes place. Secondly, the electronic manufacturing department, which comprises of SMT manufacturing, SMD-QC and THP manufacturing, where various manufacturing processes such as surface mounting and through-hole populating of the electronic components on the circuit board, soldering of these components on the circuit board as well as quality control checks of WIP AssySMD and AssyPCB inventories, are carried out. Thirdly, there is the mechanical department, where assembling, testing and packaging takes place. Lastly, there is the dispatch department, where the distribution of finished products to distribution branches and customers takes place.
The various process wastes and bottlenecks limiting the performance of the supply chain is revealed through the simulation and value stream mapping of the supply chain of this organisation.
3.2.2. Simulation results of the end-to-end process model
A summary of parametrization actions carried out on the developed system model is depicted in and .
Figure 4. (a): Parametrization of the remaining process workstations and products manufacturing mix for ABC Electronic Product-Manufacturing organisation. b): Parametrization of the processing time for the products manufacturing mix for ABC Electronic Product-Manufacturing organisation.
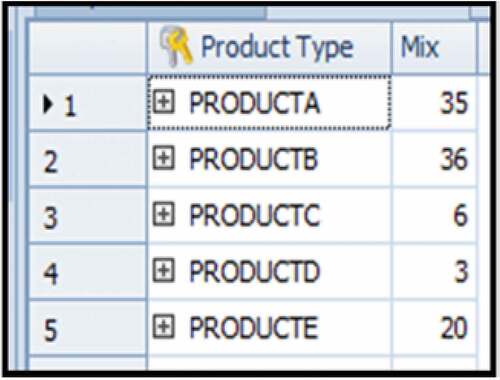
Figure 4. Continued.
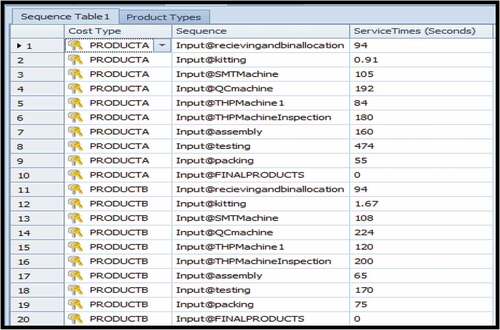
Table 2. Summary of parametrization actions for the developed system model
The outcome of the verification of the developed system model for the ABC Electronic Product-Manufacturing organisation revealed that the system model logic, parametrized variables and conditions perfectly match the logic and real-life operating conditions of the organisation. In addition, the validation exercise of the developed system model, conducted for a simulation run length of 40 hours, revealed that the products throughput of the simulated model corresponds with the throughput achieved by the organisation for this same period. Hence, the model was confirmed to be valid.
depicts the simulated model of the end-to-end process of this organisation, after running the model for a period of 25 days (i.e., 200 hours).
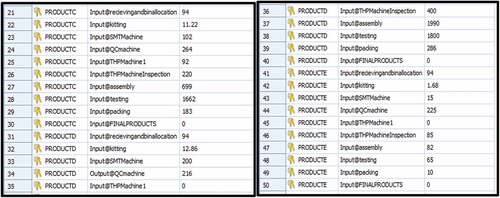
Figure 5. The current state simulated process chain model of ABC Electronic Product-Manufacturing organisation.
The simulated result of the current status of the developed system model for ABC Electronic Product-Manufacturing organisation is presented in .
Table 3. Supply chain performance simulation results for ABC Electronic Product-Manufacturing organisation
The input buffer simulation results unveils the number of raw materials/unit product that arrived to be kitted and processed at the various workstations while the output buffer simulation results unveils the number of raw materials/unit product and WIP inventories that were processed at the workstations of ABC Electronics Product Manufacturing Organisation. These results revealed that the manufacturing system is only capable of producing a total of 2805 packaged electronic products (which comprises of 891,921, 130, 346 and 517 units of packaged product A, product B, product C, product D and product E) out of a total of 12,400 units of electronic products (i.e. 4300, 4500, 750, 350 and 2500 units of products A, B, C, D and E respectively) that need to be produced, for a simulation run length of 200 hours (i.e. 25 working days at 8 hours per shift). The simulation results of the developed system model also revealed that, out of 12,400, 12,400, 12,400, 12,400, 2811, 2810, 2807, 2805, and 2805 units of raw materials and WIP inventories that entered the receiving & bin location, kitting, SMT manufacturing, SMD-QC machine, THP manufacturing, assembling, Testing, Packaging and dispatch respectively for further processing, 12,400, 12,400, 12,400, 2811, 2810, 2807, 2805, 2805, and 2805 units were processed in these workstations respectively. In light of this, SMD-QC machine is the primary bottleneck station, since it has the highest unprocessed work-in-progress inventory. The reason for sharp drop in the throughput of the SMD-QC station, is on the one hand, because of the high processing time required to inspect each AssySMD WIP inventory for quality conformance, by a single worker responsible for operating the quality control (QC) machine in this workstation. On the other hand, the throughput sharp drop was also experienced owing to the total production time loss of 45.64 hrs experienced by the same worker during its movements (i.e. motions) to execute other required tasks, for the 25 days of the system observation, which forces him to stop operating the QC machine. The tasks that prompt this worker to stop the operation of the QC machine include feeding PCB at entry point of SMT Oven, re-feeding components to SMT machine feeders and picking and piling of the assembled SMD at the exit point of SMT machine onto the rack, in preparation for inspection.
The simulation result of the developed system model further revealed that the THP manufacturing, assembling and testing stations are the secondary bottlenecked stations since they have relatively few work-in-progress inventories to be processed. The current simulation results of the developed system model also revealed the “starved time” which is the time the station was idling, including the frequency of idling experienced in the workstations for a month. The bin and receiving station experienced 133.2 seconds of idling once, while kitting experienced 64.8 seconds of idling 7642 times. The SMT manufacturing idled for 3.6 seconds 73 times; SMD QC idled for 219.6 seconds; THP manufacturing idled for 126 seconds 1663 times; Assembling idled for 133.2 seconds 472 times; Testing idling also for 133.2 seconds 158 times and lastly Packaging station idled 154.8 seconds for 2066 times. Approximately a total of 308.08 hours of operations is lost each month due to idling stations. The results of the processing time percentages were also revealed. The processing time percentage for the receiving and bin allocation, kitting, SMT manufacturing, SMD-QC machine, THP manufacturing, assembling, testing, and packaging processes are 99.99%, 4.89%, 97.29%, 99.96%, 18.68%, 32.36%, 22.87%, and 39.35% respectively. Based on the above results, it could be inferred that the supply chain of is incapable of meeting the required demand. In order to visualise and establish the various process wastes limiting the performance of the supply chain, a VSM of this supply chain was established. This exercise used WIP inventories of each workstation obtained from the developed model simulation results and data obtained through system observations such as distances between workstations and frequencies of motion, transportation and defect production information.
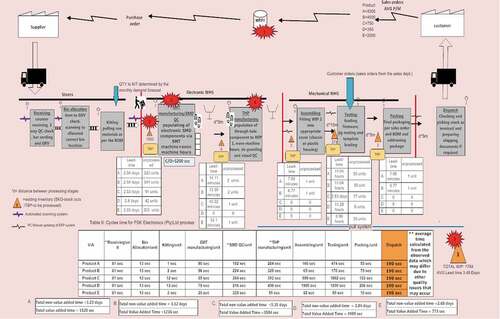
3.2.3. The current state value stream map results
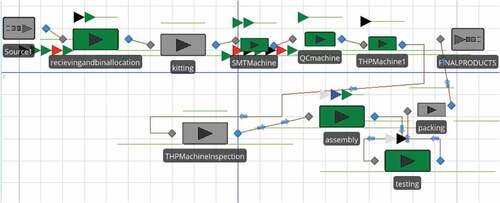
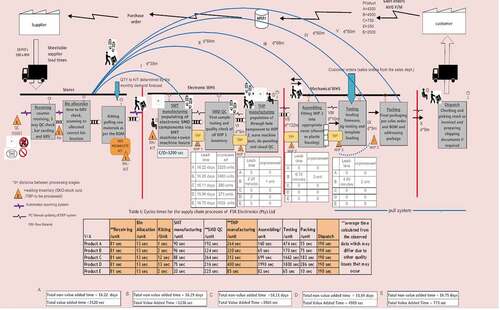
presents the value stream map of the current state of the supply chain system of ABC Electronic Product-Manufacturing organisation. The description of the other symbols used to construct the current and future value stream maps are: ![]()
Figure 6. Value Stream Map of the current state of supply chain system of ABC Electronic Product-Manufacturing organisation.
which implies excess motion, ![]() which implies push production and
which implies push production and ![]() which implies operator waiting, and blue lines which indicate raw material transport flow to appropriate work stations within the production process of ABC Electronics Product Manufacturing Organisation.
which implies operator waiting, and blue lines which indicate raw material transport flow to appropriate work stations within the production process of ABC Electronics Product Manufacturing Organisation.
Table I in the value stream map revealed the value-added time required for each process within this organisation’s supply chain.
Based on Table I, the total value-added time required to produce products A, B, C, D and E using the various manufacturing processes of the organisation are 1520 seconds, 1236 seconds, 3504 seconds, 4989 seconds and 773 seconds respectively. The Work-In-Progress (WIP) lead time (calculated using Equationequation 1(1)
(1) : adopted from Cuatrecasas-Arbós et al., Citation2015) experienced when manufacturing product A, B, C, D and E are 16.22 days (467,136 sec), 16.29 days (469,152 sec), 16.11 days (463,968 sec), 15.94 days (459,072 sec) and 16.75 days (482,400 sec) respectively. Hence, total non-value added lead-time experienced in the supply chain system used in the organisation is 81.31 days.
The takt time of the supply chain system of ABC Electronic Product-Manufacturing organisation, calculated using Equationequation 2(2)
(2) (adopted from Fekete & Hulvej, Citation2013) is 42.68 seconds per product.
Since the time it takes to produce products A, B, C, D and E, which are 1520 seconds, 1236 seconds, 3504 seconds, 4989 seconds and 773 seconds, are exponentially higher that the takt time, which is 42.68 seconds per product, therefore, it could be deduced that capacity of the workstations of this organisation is limited to meet 12,400 units of products A, B, C, D and E demanded by the customers on monthly basis.
Based on the aforementioned information, the Process Cycle Efficiency (PCE) of the supply chain system of the organisation, calculated using Equationequation 3(3)
(3) (adopted from Hossain & Uddin, Citation2015), to produce each products A, B, C, D and E are 0.32%, 0.25%, 0.75%, 1.07% and 0.16% respectively.
In light of this, it could be inferred that the current process cycle efficiency of the supply chain for the five products, for the period of investigation (i.e. 4 weeks) is 2.55% (i.e. 0.32% + 0.25% + 0.75% + 1.07% + 0.16%). A study by Hossain and Uddin (Citation2015) indicated that in order for any company to be globally competitive, the PCE needs to be more than 25%. With the PCE of 2.55%, the supply chain process of is not effective. Hence, it could be inferred that this organisation is not globally competitive.
3.2.3.1. Process wastes in the supply chain system of ABC electronic product-Manufacturing organisation
Defects are generated at the receiving, SMD manufacturing and THP manufacturing workstations of this organisation. During the receiving process, 180 raw materials were observed, and 79 raw materials (i.e. 44%) didn’t meet the quality check requirements. The classes of defects experienced during the quality control check of the raw materials at the receiving work station include wrong documentation of the received raw materials (i.e. wrong price or wrong order number on the invoice or delivery note) and quality issues where by wrong stock is supplied or the stock was of bad quality. These resulted in 41 (52%) and 38 (48%) of the total defects generated respectively. The defects experienced in the receiving stage cause challenges such as increased manufacturing lead times and other defects within the entire supply chain. Resolving this issue is not only time consuming but it also reveals the supplier unreliability when it comes to quality and services. Defects identified in the WIP products transformed at the SMT manufacturing process workstation include 750 unplaced components, 520 misplaced components and 480 broken tracks. Defects identified in the WIP products transformed at the THP manufacturing process include 480 un-soldered components, 125 components with excess solder, 620 incorrectly placed components and unplaced/missing components.
Another process waste found in the supply chain system of ABC Electronic Product-Manufacturing organisation is over-supply and under-supply of raw material. At the receiving process, 180 raw materials were observed, 8% of the raw materials received at the receiving workstation were over-supplied, meaning that the quantity delivered is more than the quantity ordered. This was due to supplier MOQ (minimum ordering quantity). The over-supplied raw materials received leads to excess inventory, more space requirements to accommodate these excess inventories and high holding and inventory costs. A total of 6% of the received inventory was under-supplied, meaning that the quantity delivered was less than the quantity ordered. This was due to stock unavailability and lack of planning from the suppliers. Under supplied raw materials resulted in stock-out cost and longer manufacturing lead times. In addition to the above-mentioned supplier issues, unreliable supplier lead-time was also identified during the period of investigation. Some of the raw materials were not delivered on the expected date.
Another process waste found in the supply chain system of ABC Electronic Product-Manufacturing organisation is the waiting time. It was observed that unprocessed WIP inventory, personnel/operators and machinery all experience a waiting period throughout the supply chain process of ABC Electronic Product-Manufacturing organisation. It was also discovered based on time study that approximately 9 hours a day in total is lost due to the current mechanism of inventory requisition and distribution among all the processing stages/workstations. It also become known based on the results of the observation that 9827 motions took place within the supply chain of FSK (Pty) Ltd in producing 4300 units of product A, 4500 units of product B, 750 units of product C, 350 units of product D and 2500 units of product E as demanded on a monthly basis by the customers.
The VSM revealed the excess inventory generated between the SMT manufacturing and SMD QC, SMD QC and THP manufacturing, the THP manufacturing and assembly and lastly between the assembly and testing processes in WIP form. The excess inventory waits before they are processed for up to 16.25 days on average as depicted on the value stream map (see, ). revealed that over produced WIP inventories for products A, B, C, D and E are been experienced at the kitting workstation and SMT manufacturing workstation. Overproduction is experienced at ABC Electronic Product-Manufacturing organisation owing to the fact that the organisation adopt the push strategy from the raw material receiving workstation up to the end of assembly process. Therefore, inventory is processed without being needed at that particular time, which is not following the lean philosophy.
A detailed information of workstations within the supply chain of ABC Electronic Product-Manufacturing organisation, where the afore-discussed process wastes are generated is presented in .
Table 4. Waste found in the supply chain system of ABC Electronic-Product-Manufacturing organisation
The result of , revealed that excess transportation and waiting were generated in all the workstations, followed by excess inventory which was generated in four workstations, followed by defects which was generated in three workstations, followed by excess motion which was generated in two workstations, and lastly, overproduction waste which was generated in only one workstation. However, over-processing waste was not generated in any workstation.
Based on the above-mentioned information, the study prioritised the resolution of the process wastes generated within the workstations. The Pareto analysis in was used to ascertain which workstations are the vital few workstations that generate more process wastes while the Pareto analysis in was used to determine critical wastes experienced within the supply chain system of the organisation.
Figure 7. Critical workstations generating more process wastes at ABC Electronic Product-Manufacturing organisation.
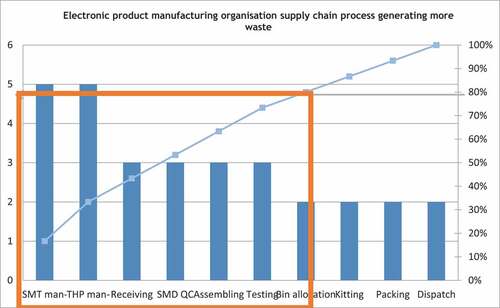
Figure 8. Critical and non-critical wastes experienced within the supply chain of ABC Electronic Product-Manufacturing organisation.
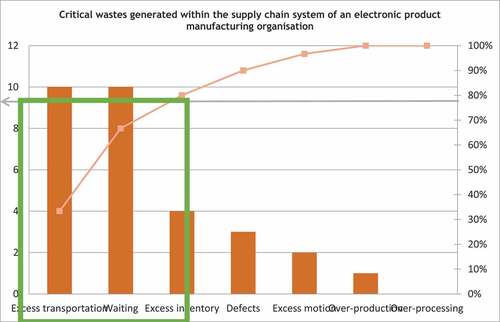
The result of the Pareto Analysis in revealed that SMT Manufacturing, THP Manufacturing, Receiving, SMD-QC, Assembling, Testing and Bin Allocation are the core workstations that generate more process wastes. The result of the Pareto Analysis in revealed that excess transportation, waiting time and excess Work In Progress (WIP) inventory were the critical wastes contributing significantly to the inefficiency of the supply chain system of ABC Electronic Product-Manufacturing organisation. In light of the above results, the next phases (i.e. analyse and improve phase) will focus on analysing the root causes of the critical process wastes generated at the workstations of the supply chain as well as proposing suitable strategies capable of eliminating the causes in these work stations.
3.3. Analyse phase
3.3.1. Root causes of excess transportation in the supply chain
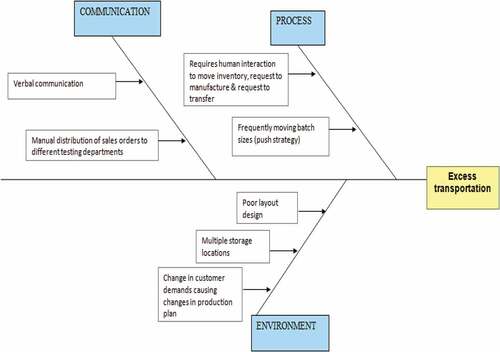
The Fishbone diagram depicted in was used to determine the major causes of excess transportation within the end-to-end processes of ABC Electronic Product-Manufacturing organisation. Based on , various process-related, environment-related and communication-related issues contributed to the excess transportation experienced at ABC Electronic Product-Manufacturing organisation. Various process-related issues such as the use of the adopted push strategy and the manual mode of carrying out operations requiring human interaction contributed to excess transportation. Various environmental-related issues such as poor facility layout and changes in customer demands contributed to the excess transportation. Lastly, various communication-related issues such as verbal and paper-based communication used within the supply chain of this organisation contributed to excess transportation experienced at ABC Electronics Product-Manufacturing organisation.
Figure 9. Cause and effect diagram for excess transportation within the supply chain of ABC Electronic Product-Manufacturing organisation.
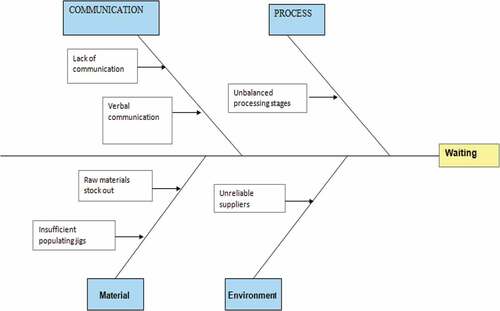
3.3.2. Root causes of high waiting time in the supply chain
unveiled the major causes of high waiting time within the supply chain of ABC Electronic Product-Manufacturing organisation. revealed that unbalanced processing stages, lack of efficient communication mechanisms between the operators of various workstations, verbal modes of communication between the operators of various workstations, insufficient populating jigs, unreliable suppliers and stock out of raw materials contribute to high waiting times within the end-to-end processes of ABC Electronic Product-Manufacturing organisation.
Figure 10. Cause and effect diagram for high waiting time within the supply chain of ABC Electronic Product-Manufacturing organisation.
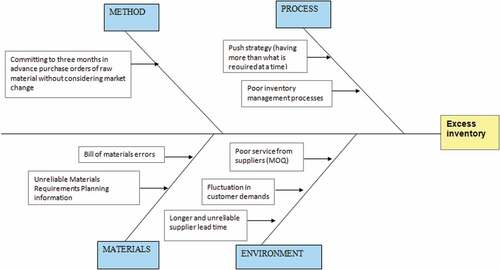
3.3.3. Root causes of excess inventories in the supply chain
The Fishbone diagram depicted in unveiled the causes of excess inventories within the supply chain of ABC Electronic Product-Manufacturing organisation. Based on , the use of a traditional procurement method which places little emphasis on frequent change in market demand, errors in billing of materials, unreliable information for materials requirements planning, poor service from suppliers and unreliable supplier lead times, fluctuation in customer demands, poor inventory management and the adopted push strategy (non-lean) are the root causes of excess inventory generated in the supply chain of this organisation.
Figure 11. Cause and effect diagram for excess inventories experienced within the supply chain of ABC Electronic Product-Manufacturing organisation.
As part of continuous improvement, the root causes of other process wastes contributing 20% of the inefficiency experienced at the supply chain system of ABC Electronic Product-Manufacturing organisation were also examined, with a view to holistically improve the performance of the supply chain system of the organisation. The result thereof is presented in the next section of the manuscript.
3.3.4. Root causes of defects in the supply chain
The investigation exercise revealed that human error, improper handling of electronic products, unskilled people, no written/standardised procedures, lack of communication, no standardised service plan for machines, no calibration plan for test equipment’s and lack of proper materials handling equipment’ are the root causes of defects production in the supply chain of this organisation.
3.3.5. Root causes of excess motion in the supply chain
Poor facility layout, lack of house-keeping policies, multiple-storage locations, supplier packing sizes, constantly exchanging products to process and the machines that are not fully automated are the causes of excess motions generated within the supply chain of ABC Electronic Product-Manufacturing organisation.
3.3.6. Root causes of over-production in the supply chain
Longer machine change over, the push production strategy and the seasonal change in customer demand contribute to over-production in the end-to-end processes of this organisation.
3.4. Improve phase
The result of the suitable strategies capable of eliminating the aforementioned process wastes as well as exploiting the bottlenecked workstations, in relation to their impact towards improving the performance of the supply chain system using the solution assessment register (presented in the methodology section) is depicted in .
Table 5. Solution mix capable of minimising and eliminating wastes and bottlenecks in the supply chain system of ABC Electronic Product-Manufacturing organisation
Since the overall weight score of all the proposed solutions in was at least 4 points, then all the solutions were proposed for adoption at the supply chain of the organisation. Therefore, the simulated model result of the future supply chain system that adopt the remedies proposed to solve the core process waste root causes 1, 2, 3, 5 and 17 of is presented in .
Table 6. Simulation model results for the proposed supply chain for ABC Electronic Product-Manufacturing organisation
The simulation results of the proposed supply chain system model recommended for use at ABC Electronics Product-Manufacturing organisation revealed that the throughput of the future state of the supply chain system would increase from 2805 to 10,614 packaged electronic products (i.e. 3680, 3850, 642, 300 and 2142 units of product A, product B, product C, product D and product E would be produced respectively for a simulation run length of 200 hours), which is approximately 86% of the customer demand. The simulation results of the proposed system model also revealed that the integrated SMT manufacturing-SMD QC machine is the primary bottleneck station. In this case, out of the 12,400 units that entered this station, 1500 units were not processed, creating a bottleneck at this station. The simulation results of the proposed system model also further revealed that the
THP manufacturing, assembling, testing and packaging stations are the secondary bottlenecked stations. In total, only 1784 units are expected to remain as work in progress inventories for the simulation run length of 200 hours.
The simulation results of the proposed system model also revealed the “starved time”. The bin and receiving station would experience 3.6 seconds of idling once, while kitting would experience 64.8 seconds of idling 7642 times, and the SMT manufacturing & SMD QC machine would be idle for 111.6 seconds once. Furthermore, the THP manufacturing would be idle for eight hundred and seventy six (876) times for a period of 198 seconds. The assembling workstation would be idle one hundred and seven (107) times for a period of 25.2 seconds. The testing workstation would be idle also once for a period of 615.6 seconds, and the packaging station would be idle two thousand five hundred and thirty (2530) times for a period of 46.8 seconds. As mentioned, the kitting workstation operator is not idled due to the secondary task allocated to the operator. The THP Manufacturing workstation is expected to experience more idling, followed by packaging, assembling, testing, SMT manufacturing/SMD QC, and the receiving and bin allocation work station in that order. The results of the processing time (utilisation) percentage were also revealed. The processing time percentage for the receiving and bin allocation, kitting, SMT manufacturing/SMD QC, THP manufacturing, assembling, testing, and packaging processes are expected to be 99.99%, 4.89 %, 99.97%, 53.98%, 68.42%, 99.19%, and 45.46% respectively.
3.4.1. Future value stream map of the supply chain of ABC electronic product-Manufacturing organisation
Based on the simulation results of the proposed supply chain system model for ABC Electronics Product-Manufacturing organisation, the future state of the supply chain was mapped and presented in . Based on the future VSM results depicted in , the cycle time required to process product A, B, C, D, and E is E are expected to be 1520 seconds, 1236 seconds, 3504 seconds, 4989 seconds and 773 seconds respectively. The Work-In-Progress (WIP) lead-time (calculated using Equationequation 2)(2)
(2) experienced when manufacturing product A, B, C, D and E are expected to be 3.23 days (93,024 sec), 3.12 days (89,856 sec), 5.35 days (154,080 sec), 3.04 days (87,552 sec) and 2.68 days (77,184 sec) respectively. Hence, the total non-value added lead-time experienced in the future state supply chain system proposed is 17.42 days. The process cycle efficiency (PCE) for products A, B, C, D and E are expected to be 1.55%, 1.30%, 2.20%, 5.38% and 0.94% respectively. This was determined also using Equationequation (3)
(3)
(3) . Hence, the total PCE of the proposed supply chain system is therefore 11.37%.
Figure 12. Value Stream Map of the future state of supply chain system of ABC Electronic Product-Manufacturing organisation.
3.4.2. Comparative analysis of the current state and second phase future state
compares the results of the current and future state of the supply chain system of ABC Electronic Product-Manufacturing organisation.
Table 7. Summary of previous state and future state results for the supply chain of ABC Electronic Product-Manufacturing organisation
As depicted in , the throughput of the organisation is expected to increase from 2805 to 10,614 units, which would result into a 63% increase in throughput, thereby having potential of minimising the WIP inventory from 9595 to 1784 units. The expected overall productivity throughput improvement of 63% would result in an additional monetary revenue generation of $399,792, for ABC Electronic Product-Manufacturing organisation, if the proposed supply chain improvement strategies are implemented in the organisation. The productivity improvement and WIP improvement was envisaged to be enormous (as confirmed by the simulation results) owing to the fact that the usage of three (3) more quality control machines, three (3) more quality control inspectors and deployment of an autonomous robot for picking and conveying PCBs assembled SMD, and electronic raw material components within the SMT+SMD-QC work station, will on the one hand, exponentially increase the number of assembled SMD WIP inventories inspected. On the other hand, it would ensure that the production loss time recovered owing to the usage of autonomous robot within the SMT+SMD-QC workstation, are channelled by the four (4) quality inspectors to continuously operate the QC machines, thereby increasing the number of assembled SMD WIP products inspected. In addition, the second strategy mentioned in remedy 17 to exploit the secondary bottlenecked THP manufacturing station (if implemented in the organisation), would ensure that THP manufacturing station is capacitated enough to process more assembled SMD WIP inventories. The capacity of the kitting, assembling and packaging workstations were not changed in proposed supply chain system owing to the fact that these stations were under-utilized and could process more WIP inventories (as confirmed by the simulation model results of the proposed supply chain system recommended for ABC Electronic Product-Manufacturing Organisation).
The overall utilisation percentage is expected to increase by 35.47% and the overall starve time occurrences is expected to decrease from 12,076 to 11,158. In addition, the total PCE of ABC Electronic Product-Manufacturing organisation in producing product A, B, C, D and E is expected to increase from 2.55% to 11.37%. In addition, the total non-value added lead-time experienced in the supply chain system of the organisation is expected to reduce from 81.31 days to 17.42 days.
3.5. Control phase
In order to sustain the improvement that could be achieved, if ABC Electronic Product-Manufacturing organisation implement the aforementioned strategies highlighted in the improve phase, the introduction of supplier audit exercise, is paramount with a view to ensure that suitable supplier that meet the core criteria that will ensure prompt supply of raw materials to ABC Electronic Product-Manufacturing organisation are selected. Continuous monitoring and audit of the usage of maintenance and machine service plan checklist need to be conducted in the organisation. Random observation of workers adherence to the standardized operating procedures to be used at different workstations of the organisation also needs to be given an attention. In order to prevent occurrence of unplaced and misplaced component at the THP manufacturing, which result into defect production, then monitoring of this automatic components loading at various random time intervals, premised on the predictive issue occurrence analytics, needs to be given attention in the organisation. In addition, in order to minimise errors in BOM generated in the organisation, the organisation should enforce the review of the BOM by the Product Design Engineer, Procurement Manager and Production Manager. The aforementioned initiatives will embrace operator’s ease of monitoring, identification and prevention of process wastes that occur within the supply chain of this organisation.
4. Managerial implication
Management, in general, is the first hindrance to continuous improvement. They should select, train workers appropriately, instil the culture that stimulate sense of ownership and responsibility for every actions taken by each worker and provide necessary resources for the smooth running of its supply chain system. Training plays a significant impact in the implementation of a new system. With respect to this project, it is vital for the organisation to create awareness about the proposed supply chain system to the operators at the production process of the organisation. In order to ensure effective training of workers within the supply chain system of an organisation, a skill assessment matrix of all the workers needs to be carried out by the management before and after the training, with a view to determine the workers’ awareness level on DMAIC concept. Communication of workers’ training schedule need to be made available in advance for proper preparation towards training. The study of Formento et al. (Citation2013) supported the aforementioned assertion that training of employees, which stimulate the use of well-tested operations strategies over the use of trial and error operations strategies based on individual experience, as well as management commitment towards facilitating and coordinating the training programs in its organisation, are key to ensure continuous supply chain performance improvement. However, workers within the supply chain system of the organisation have low knowledge base on this DMAIC technique.
5. Conclusion
Smooth running of the end-to-end processes of an organisation is vital for the production of high volume quality products required by the customers. In light of this, strategies capable of ensuring leanness of the supply chain system used at ABC Electronic Product-Manufacturing organisation was unfolded in this study using the DMAIC approach. On the one hand, based on the results of this study, it could be deduced that the SMD QC workstation is the primary bottlenecked workstation while the THP manufacturing, assembling and test workstations are the secondary bottlenecked workstations, limiting the throughput of the supply chain system of ABC Electronic Product-Manufacturing organisation. On the other hand, it could be deduced that excess transportation, waiting and excess inventory are the critical process wastes contributing significantly to the inefficiency of the supply chain system of ABC Electronic Product-Manufacturing organisation. Hence, it was deduced that the use of a standardized supplier assessment form for selection of a suitable supplier, re-arrangement of the factory layout configuration, use of raw material location tracking management system, increase in machine capacity available and automation of materials handling systems as well as the use of a Digital Kanban post are the suitable strategies that could eliminate the critical and non-critical process wastes present within the supply chain system of ABC Electronics product-manufacturing organisation. In addition, it was also confirmed via simulation that the purchase of extra two (2) integrated SMT manufacturing and SMD-QC machine, integration and automation of the currently used SMT manufacturing and SMQ-DC machines, automation of the THP manufacturing machine, reallocation of workers within the supply chain system, adoption of pull supply chain strategy and the use of a Kanban Post system, will improve the throughput and process cycle efficiency of organisation by 63% and 8.82% respectively, as well as reduce the total lead-time experienced in the supply chain system of the organisation by 63.89 days. The extra three (3) quality control machine and autonomous robot to be considered for purchase by the organisation should be machines with moderate cost price, installation, operations and maintenance cost. ABC Electronic Product-Manufacturing organisation should carefully select and train workers on how to effectively perform their job duties by means of well-defined work procedure in order to improve its supply chain performance. Further research work should be tailored towards implementing the strategies proposed in this study in ABC Electronic Product-Manufacturing organisation, with a view to confirm the potential gains inferred by the simulation results of the proposed supply chain system model considered in this study.
Acknowledgements
The authors wish to show appreciation to the research team of Operations Management Department, Tshwane University of Technology, for their support during this research project.
Disclosure statement
No potential conflict of interest was reported by the authors.
Additional information
Funding
Notes on contributors
Olasumbo Makinde
Dr Olasumbo Makinde is a Lecturer at the department of Operations Management at Tshwane University of Technology, Pretoria, South Africa. He specializes in Supply Chain System Design and Optimisation, and Ergonomics. Ms Refentse Selepe is a supply chain manager and hold a Master’s degree in Operations Management, obtained from Tshwane University of Technology, Pretoria West, South Africa. Dr Thomas Munyai is the Head of Department of Operations Management at Tshwane University of Technology, Pretoria, South Africa. His research interest includes Lean Six Sigma, productivity and supply chain management. Prof Kem Ramdass currently serves as an associate director in quality development in the School of Engineering, at University of South Africa. His research interest spans across quality management, supply chain management and work-study. Dr Edgar Nesamvuni, a PhD degree holder, is the Executive Dean of the Faculty of Management Sciences, Tshwane University of Technology, South Africa. His research experience span across operations and human resource management.
References
- Abhilash, C. R., & Thakkar, J. J. (2019). “Application of Six Sigma DMAIC methodology to reduce the defects in a telecommunication cabinet door manufacturing process: A case study. International Journal of Quality & Reliability Management, 36(9), 1540–29. https://doi.org/10.1108/IJQRM-12-2018-0344
- Anand, G., & Kodali, R. (2008). A conceptual framework for lean supply chain and its implementation. International Journal of Value Chain Management, 2(3), 313–357. https://doi.org/10.1504/IJVCM.2008.019517
- Arafeh, M., Barghash, M. A., Haddad, N., Musharbash, N., Nashawati, D., Al-Bashir, A., & Assaf, F. (2018). Using Six Sigma DMAIC methodology and discrete event simulation to reduce patient discharge time in King Hussein Cancer Center. Journal of Healthcare Engineering, 3(1), 1–17. https://doi.org/10.1155/2018/3832151
- Batalova, J., Fix, M., & Bachmeier, J. D. (2016). Untapped talent: the costs of brain waste among highly skilled immigrants in the United States. World Education Services, 5(1), 102–114. https://www.migrationpolicy.org/sites/default/files/publications/BrainWaste-FULLREPORT-FINAL.pdf
- Cheng, J. L. (2017). Improving inventory performance through lean six sigma approaches. International Journal of Operations Management, 16(3), 24–35. https://web.p.ebscohost.com/ehost/pdfviewer/pdfviewer?vid=0&sid=0f61b50f-61e7-4d17-896d-4cd5c42d5be3%40redis
- Čiarnienė, R., & Vienažindienė, M. (2015). An empirical study of lean concept manifestation. Procedia-Social and Behavioral Sciences, 207(1), 225–233. https://doi.org/10.1016/j.sbspro.2015.10.091
- Cuatrecasas-Arbós, L., Fortuny-Santos, J., Ruiz-de-arbulo-lópez, P., & Vintró-Sanchez, C. (2015). Monitoring processes through inventory and manufacturing lead time. Industrial Management & Data System, 115(5), 951–970. https://doi.org/10.1108/IMDS-12-2014-0375
- Cudney, E., & Elrod, C. A. (2011). Comparative analysis of integrating lean concepts into supply chain management in manufacturing and service industries. International Journal of Lean Six Sigma, 2(1), 5–22. https://doi.org/10.1108/20401461111119422
- Fekete, M., & Hulvej, J. (2013). Humanizing takt time and productivity in the labour intensive manufacturing systems. In: Management knowledge and learning international conference, 191–199. Zadar, Croatia: ToKnowPress.
- Formento, H. R., Chiodi, F. J., Cusolito, F. J., Altube, L. A., & Gatti, S. P. (2013). Key factors for a continuous improvement process. Independent Journal of Management & Production, 4(2), 391–415. https://doi.org/10.14807/ijmp.v4i2.76
- Gupta, N. (2013). An application of DMAIC methodology for increasing the yarn quality in textile industry. IOSR Journal of Mechanical and Civil Engineering, 6(1), 50–65. https://doi.org/10.9790/1684-0615065
- Haddud, A., & Khare, A. (2018). The impact of digitizing supply chains on lean operations (Anshuman Khare, Dagmar Kessler, and Jan Wirsam, Ed.). In Marktorientiertes Produkt-und Produktionsmanagement in digitalen Umwelten (pp. 27–46). Springer.
- Hoellthaler, G., Braunreuther, S., & Reinhart, G. (2018). Digital Lean Production: An Approach to identify potentials for the migration to a digitalized production system in SMEs from a Lean perspective. Procedia CIRP, 67(1), 522–527. https://doi.org/10.1016/j.procir.2017.12.255
- Hossain, M. M., & Uddin, M. K. (2015). An approach to improve the process cycle efficiency and reduce the lead time of a Mango juice processing line by using lean tools: A case study. International Journal of Scientific and Engineering Research, 6(1), 1442–1452. https://www.ijser.org/researchpaper/An-Approach-to-Improve-the-Process-Cycle-Efficiency-and-Reduce-the-Lead-Time.pdf
- Ibidunni, O. S., Falola, H. O., Ibidunni, A. S., & Olokundun, A. M. (2014). Effects of human resource waste on productivity in nigeria. International Journal of Human Resource Management and Research (IJHRMR), 4(3), 47–56. http://eprints.covenantuniversity.edu.ng/3312/1/EFFECT%20OF%20HUMAN%20RESOURCE%20WASTE%20-%20Ibidunni%2C%20Olanrewaju%20Samson%20-%20Nigeria.pdf
- Jayanth, B. V., Prathap, P., Sivaraman, P., Yogesh, S., & Madhu, S. (2020). Implementation of lean manufacturing in electronics industry. Materials Today: Proceedings, 33(1), 23–28. http://dx.doi.org/10.1016/j.matpr.2020.02.718
- Jirasukprasert, P., Garza-Reyes, J. A., Kumar, V., & Lim, M. K. (2014). A Six Sigma and DMAIC application for the reduction of defects in a rubber gloves manufacturing process. International Journal of Lean Six Sigma, 5(1), 1–21. https://doi.org/10.1108/IJLSS-03-2013-0020
- Junior, M. L., & Godinho Filho, M. (2010). Variations of the Kanban system: Literature review and classification. International Journal of Production Economics, 125(1), 13–21. https://doi.org/10.1016/j.ijpe.2010.01.009
- Kariuki, B. M., & Mburu, D. K. (2013). Role of Lean manufacturing on organization competitiveness. Industrial Engineering Letters, 3(10), 81–82. https://www.iiste.org/Journals/index.php/IEL/article/view/8012/8313
- Khan, S. A., Badar, M. A., & Alzaabi, M. (2020). Productivity improvement using DMAIC in a Caravan Manufacturing company. International Journal of Productivity and Quality Management, 30(2), 234–251. https://doi.org/10.1504/IJPQM.2020.107825
- Lee, M. C., & Chang, T. (2010). Developing a lean design for Six Sigma through supply chain methodology. International Journal of Productivity and Quality Management, 6(4), 407–434. https://doi.org/10.1504/IJPQM.2010.035891
- Myerson, P. (2012). Lean supply chain and logistics management. McGraw-Hill Education.
- Raman, R., & Basavaraj, Y. (2019). Defect reduction in a capacitor manufacturing process through Six Sigma concept: A case study. Management Science Letters, 9(2), 253–260. https://doi.org/10.5267/j.msl.2018.11.014
- Sajjad, M. H., Naeem, K., Zubair, M., Usman Jan, Q. M., Khattak, S. B., Omair, M., & Nawaz, R. (2021). Waste reduction of polypropylene bag manufacturing process using Six Sigma DMAIC approach: A case study. Cogent Engineering, 8(1), 1–22. https://doi.org/10.1080/23311916.2021.1896419
- Senthilkumar, T., Karthi, S., Devadasan, S. R., Sivaram, N. M., Sreenivasa, C. G., & Murugesh, R. (2012). Implementation of DMAIC methodology in supply chains to reduce customer end-rejections: A case study in an Indian SME. International Journal of Productivity and Quality Management, 10(3), 388–409. https://doi.org/10.1504/IJPQM.2012.048755
- Simboli, A., Taddeo, R., & Morgante, A. (2014). Value and wastes in manufacturing. An overview and a new perspective based on eco-efficiency. Administrative Sciences, 4(3), 173–191. https://doi.org/10.3390/admsci4030173
- Tortorella, G. L., Miorando, R., & Tlapa, D. (2017). Implementation of lean supply chain: An empirical research on the effect of context. The TQM Journal, 29(4), 610–623. https://doi.org/10.1108/TQM-11-2016-0102
- Vinodh, S., & Kumar Chintha, S. (2011). Application of fuzzy QFD for enabling leanness in a manufacturing organisation. International Journal of Production Research, 49(6), 1627–1644. https://doi.org/10.1080/00207540903568729