
 ?Mathematical formulae have been encoded as MathML and are displayed in this HTML version using MathJax in order to improve their display. Uncheck the box to turn MathJax off. This feature requires Javascript. Click on a formula to zoom.
Abstract
Globally, reliable access to electricity improves people’s well-being, provides quality education, and promotes good health. Greenhouse gas emissions associated with fossil fuel combustion have incited an intense interest in low-carbon technologies for power generation. This study analyses the prospect of utilising a solar PV/biogas/battery hybrid energy system to provide electricity for Ghana’s remote communities. The study goal is to utilise locally available renewable energy resources to achieve a cost-effective levelized cost of electricity (LCOE) and mitigate greenhouse gas emissions. Hybrid Optimisation of Multiple Energy Resources (HOMER) software was employed to model and analyse the hybrid energy system’s technical, economic, and environmental aspects. The findings indicate that PV/biogas/battery system perform better than PV/diesel/battery and diesel-only systems in terms of cost and emissions reductions. Also, the LCOE generated from the PV/biogas/battery system is around 0.256 $/kWh. However, this LCOE is only about 64% higher than the LCOE for Ghana’s household residents. The sensitivity test indicates that the PV/biogas/battery system is sensitive to discount rates and capital subsidies, making it attractive for future development. This attests that Ghanaian rural communities without electricity access and with substantial biomass potential are likely to be electrified when given the necessary attention. Moreover, this project could be a viable alternative to rural electrification in Ghana with proper investment support.
PUBLIC INTEREST STATEMENT
Several peri-urban and rural areas in developing countries, including Ghana, lack access to the utility grid. Electricity supply to remote locations in developing nations through grid extension is costly and requires long-term preparation. However, decentralised power generation systems that supply electricity from locally accessible renewable energy resources could be better for developing countries. In addition, renewable energy resources have emerged as the best viable option for future energy generation due to their ability to mitigate climate change. This study assesses the techno-economic viability of utilising a solar PV and biogas hybrid energy system to provide reliable and cost-effective electricity for Ghana’s remote communities. The study findings are relevant to decision-makers and policymakers towards increasing electricity access rates in remote communities in Ghana.
1. Introduction
Energy access is a critical driver for the socio-economic and sustainable development of every country. It plays a pivotal role in performing daily human activities such as cooking, lighting, heating, and transportation. According to the United Nations (UN) Sustainable Development Goals (SDG’s), achieving universal access to clean energy will transform the energy system as well as assist and contribute tremendously towards meeting other SDG’s such as poverty alleviation, good health, water supply, sustainable cities, and mitigating climate change (IEA, Citation2017; IRENA, Citation2015).
About 840 million of the global population are still living without electricity. The Sub-Saharan Africa region alone has about 573 million people without electricity access (IEA, IRENA, UNSD, WB & WHO, Citation2019). A few African countries, including Ghana, have better electricity access. Ghana’s electrification access rate in urban and rural areas was about 94% and 67%, respectively, in 2018 (World Bank, Citation2021). Presently, standalone and mini-grid systems are categorised among the cost-effective alternative energy choices required to expand and accelerate electricity access to many rural communities (IRENA, Citation2014).
Over the decades, fossil fuel combustion, including coal, oil, and natural gas, has significantly contributed to the world energy sector. Many scientific studies and research conducted worldwide depict fossil fuels as a significant contributor to greenhouse gas (GHG) emissions, which cause drastic changes to the climate, thus creating havoc for the environment. Furthermore, studies assert that fossil fuels will deplete in due time. Even though these conventional energy sources negatively impact the world, they are still today’s primary energy source for power generation and transportation in most developed and developing countries, including Ghana.
Recent efforts to protect and save the environment from GHG emissions have led to the drafting and implementation of national and international policies to curb the use of fossil fuels. The Paris Agreement, for example, aims to improve the global response to climate change by limiting global temperature rise to less than 2°C and committing to GHG emission reductions and adaptation.Additionally, it strengthens countries’ ability to cope with the impact of climate change (UNFCCC, Citation2015). Moreover, several nations have proposed and directed policies to encourage the use of biomass to meet future energy demands to achieve the carbon dioxide reduction target outlined in the Kyoto Protocol (Sarkar et al., Citation2012). The recent surge in electricity demands, the depletion and rising prices of fossil fuels, the depleting crude oil reserves, limited fossil fuels, and environmental issues have resulted in global attention to clean energy for power generation (Hailu & Mezgebu, Citation2017; Sarkar et al., Citation2012).
Renewable energy significantly reduces global GHG emissions (IRENA, Citation2015). Renewable energy is free, environmentally friendly, and available everywhere. It can offer a unique opportunity to provide electricity to people living in decentralised, remote locations that lack access to the grid. Many peri-urban and rural locations in Ghana lack access to the utility grid. Two main reasons undermine electricity supply in these areas: (1) insufficient power production to meet existing power demand and (2) some remote areas’ geographical locations may preclude grid extension (Ansong et al., Citation2017). Electricity supply to remote locations in developing nations through grid extension is costly and typically requires long-term preparation. However, decentralised power generation systems supplying electricity from locally accessible renewable resources could be a better option for developing countries (Sigarchian et al., Citation2015). A long-term promising renewable energy resource, such as biomass, can resolve environmental impacts, increasing fossil fuel prices, and security issues associated with the current reliance on fossil fuels (Ayamga et al., Citation2015).
Ghana has policies that drive renewable energy technologies (RET) deployment, making it one of Africa’s leading countries with renewable energy (RE) regulatory and fiscal policies (Sakah et al., Citation2017). The Ghana “Renewable Energy Act”, Act 832, ratified in 2011, promotes renewable energy sources for power and heat generation. The Ghana Renewable Energy Masterplan has also targeted increasing the renewable energy installed capacity to 1363.63 MW and saving about 11 MtCO2 by 2030 (Energy Commission, Citation2019). This plan incites the encouragement and utilisation of solar energy and biomass for electricity generation in Ghana.
The sporadic behaviour of certain energy sources has resulted in the evolution of hybrid systems. A hybrid renewable energy system (HRES) comprises more than one power generation technology, either renewable or conventional fuel units, that work in a standalone or grid-connected mode (Adaramola et al., Citation2014; Sinha & Chandel, Citation2014). Due to recent developments in RET, HRES has gained prominence as an attractive option for standalone electricity generation in rural and isolated locations. Several studies on viability, reliability, and economic analysis indicate hybrid systems as more economical and dependable than single-source power systems (Adaramola et al., Citation2014). Furthermore, the utilisation of hybrid systems helps to obtain higher efficiencies than that of a single power source.
Presently, efforts have been made to investigate the resilience of hybrid energy systems for several applications across the globe. For example, Nafeh (Citation2011) used a genetic algorithm to optimise a PV/wind/battery system. It was observed that the PV/wind hybrid system’s cost of energy is lower than single power systems. Fadli (Citation2019) used a multi-objective bat algorithm (MOBA) to design a PV/diesel/battery micro-grid system (MGS) for 200 Sebubus village households. The LPSP and LCOE are estimated at 0.108 and 0.238 $/kWh. This attests that MGS can meet the target limitations for rural electrification and ensure a reliable electricity supply. Shafiullah and Carter (Citation2016) used HOMER to investigate PV/diesel/battery hybrid systems’ technical and economic viability. The findings indicate that the PV/diesel/battery option is cheaper, though it has a higher upfront cost than the diesel option.
Girma (Citation2013) investigated the technical and economic feasibility of electrifying a rural school in Ethiopia. The author contrasted the performance of a PV/battery/diesel system with that of a standalone diesel genset system. It was observed that using a PV/battery/diesel system produced about 599.77 kgCO2/yr while the diesel generator system produced approximately 37,432.98 kgCO2/yr. The authors concluded that the PV/battery/diesel system stands out as being more lucrative and environmentally friendly than standalone diesel generators. Odoi-Yorke et al. (Citation2021) analysed a PV/fuel cell hybrid energy system for telecom applications in Ghana. The results indicate that the hybrid system LCOE is lower than the average grid tariff charged to grid-connected telecom base stations.
Goswami and Sadhu (Citation2021) investigated the performance of floating PV modules on waste water treatment systems. The authors revealed that a floating PV module has a higher efficiency than a land-based module. Also, the floating PV modules outshine land-based modules in terms of social and economic performance. Kumar and Verma (Citation2021) performed a techno-economic analysis of a PV/biomass/battery microgrid system for six different locations in India. The findings indicate significant benefits for both microgrid planning and operation. Also, the LCOE generated for the six locations is significantly less than the LCOE produced by the existing power system.
Several studies on hybrid renewable energy systems for rural, remote, and isolated community electrification are presently available in the literature. A few selected, most recent and notable studies are discussed as follows. Rinaldi et al. (Citation2020) utilised HOMER to assess the performance of hybrid energy systems for producing electricity for off-grid communities in Peru. The assessment was based on seven scenarios comprising different amalgamations of diesel generators, wind turbine units, and solar panels. The findings indicate that the hybrid combination of solar PV, wind turbines, and diesel generators is the most economically viable configuration for the selected communities. The authors concluded that providing adequate incentive policies would reduce the energy system’s cost and assist the communities in deploying the hybrid system.
Ahmed et al. (Citation2021) conducted a viability study on a PV/wind/battery system for electricity generation for remote localities in Balochistan, Pakistan, using HOMER software. The authors found that the LCOE generated from the hybrid system is cost-effective compared to the LCOE from other studies. Saleh et al. (Citation2019) used HOMER to investigate the performance of different hybrid energy systems for rural electrification in Iraq. The results show that the most economical option for rural electrification is the PV/hydro/diesel/battery system. Haghighat et al. (Citation2016) assessed the utilisation of PV modules, wind turbines, and diesel gensets for generating electricity for off-grid settlements in Colombia. The plant’s dynamic model was conducted in HOMER software to comprehensively analyse the system architectures and determine the most economical one. The study discovered that combining renewable energy with diesel significantly reduces carbon emissions.
Islam et al. (Citation2017) investigated a hybrid mini-grid system for rural electrification in northern Bangladesh. The study analysed three power generation scenarios emanating from PV, biomass, diesel, and batteries. It was observed that even with a 100% capital subsidy, the cost of energy produced from the optimum hybrid mini-grid system is above the tariff approved for domestic customers connected to the national utility grid. Also, the mini-grid’s energy cost is more affordable than running a diesel genset or acquiring a solar home system. Kolhe et al. (Citation2015) studied the best hybrid system configuration for a Sri Lankan village. The authors found that the hybrid system that comprises PV/wind turbines/battery/diesel generators is optimal for the rural community. Also, the optimal system is economically feasible for both grid-connected and off-grid applications.
Krishan and Suhag (Citation2019) examined the techno-economic performance of different hybrid energy systems consisting of wind/battery, PV/battery, and wind/PV/battery for electrifying the community of Yamunanagar district located in India. The authors combined both HOMER and MATLAB to determine the optimal system. The findings attest that a PV/battery/wind hybrid system is economical for generating electricity for the community. Correspondingly, in India, Rajbongshi et al. (Citation2017) utilised HOMER to design various hybrid system configurations based on PV, biomass gasifier, diesel generator, and grid for different load profiles. The authors discovered that a grid-connected hybrid system has a lower energy cost than an off-grid hybrid system. The biomass gasification system was also the optimal solution in all instances compared to the solar PV system.
Another study on the techno-economic viability of hybrid renewable energy systems for rural electrification in India was investigated by Murugaperumal and Vimal (Citation2019). The authors combined artificial neural network (ANN-BP) feed-back propagation with the Levenberg-Marguardt (LM) data training optimum technique and HOMER software to examine the optimal system. The findings indicate that deploying a hybrid system to power isolated locations could be a cost-effective solution for sustainable development in remote areas. Delano et al. (Citation2020) applied HOMER to conduct a viability analysis on a PV/battery/diesel hybrid system for rural electrification in Fouay village in Benin. The authors investigated that the hybrid system provides stable power, decreases battery usage by 70% compared to a PV/battery system, and delivers a 97% decrease in CO2 emissions compared to a diesel genset.
Olatomiwa et al. (Citation2015) employed HOMER to investigate the viability of generating electricity from different hybrid power system configurations in Nigeria. Components including PV, wind turbines, and diesel generators were combined to form different configurations. The findings revealed that the PV/diesel/battery system is the ideal system for all six locations, which exhibited outstanding performance in fuel use and CO2 savings. Li et al. (Citation2020) applied HOMER to model multiple hybrid system configurations for West China’s rural electrification. The hybrid system configuration stems from the combination of PV modules, wind turbines, and biogas gensets. Also, the study compared the cost-effectiveness of the modelled off-grid hybrid systems to that of grid extension. The findings indicate that a PV/wind/biomass system is a viable and economic system for sustaining remote electrification that also benefits the environment. Goswami et al. (Citation2020) examined the prospect of developing a PV/wind grid-connected hybrid system for a remote Island in India. The study aimed to achieve a lower LCOE. The authors found that the LCOE production from PV/wind grid-connected system is lower than the existing grid. Also, the hybrid energy system would reduce about 1894 tonnes of CO2 annually. In addition, it is expected to save about 587 tonnes of coal.
An economic viability of deploying PV/wind/diesel for electrification in remote areas of southern Ghana was investigated by Adaramola et al. (Citation2014). The authors used HOMER to perform the viability analysis. It was observed that the cost of energy from the optimal hybrid system is about 0.281 $/kWh. The authors revealed that the findings could be extended to similar places in southern Ghana that received the same amount of solar irradiation and wind speed nearly equal to the sites evaluated in the study. Adaramola et al. (Citation2017) applied HOMER to examine the feasibility of employing PV/battery/biodiesel generators to power a remote area in Ghana. The results show that the hybrid system’s energy cost is about 0.76 $/kWh without subsidies. However, even with a 100% subsidy, consumers could be charged close to 200% to keep the system running. Agyekum and Nutakor (Citation2020) assessed the feasibility of using PV/wind/diesel/battery to supply electricity to Mankwadze township in Ghana. The study aimed to minimise the monopolistic usage of fossil fuels by increasing hybrid renewable energy systems. The authors found that the hybrid energy system LCOE is higher than the grid tariff charged to domestic consumers in Ghana. Moreover, the system is sensitive to fluctuations in diesel prices, inflation, and discount rates.
Key observations from the studies on rural electrification for Ghana by Adaramola et al. (Citation2014), Adaramola et al. (Citation2017), and Agyekum and Nutakor (Citation2020) focused on utilising solar PV, wind turbines, fuel cells, diesel, and biodiesel generators for power generation, excluding biogas. This means it is prudent to investigate the viability of hybridising biogas with other available renewable energy resources in the context of Ghana for future deployment. This study’s objective is to assess the techno-economic viability of hybridising solar PV and biogas to provide reliable and cost-effective electricity for Ghana’s remote communities. The study aims to utilise low carbon technologies to achieve cost-effective LCOE, reduce GHG emissions and improve electricity access in remote areas. The study results are pertinent to policymakers towards increasing electricity access rates in remote communities in Ghana. Also, it alerts and informs policymakers to facilitate investment in renewable energy technologies like solar PV and biogas for sustainable development.
2. Materials and method
2.1. Description of study area
Mankramso community is the location for this study. Mankramso is situated in the Offinso North District of the Ashanti Region of Ghana. It is located at a latitude of 7° 24.8 N and a longitude of −1° 0.8 W. The community has an average household size of 5 people, with a population of about 1,892 people (Ghana Statistical Service, Citation2014). displays Mankramso’s location in the context of Ghana. Mankramso is a typical remote community, and the majority of household heads are farmers. Children help parents on the farm after school. Approximately 89.8% of homes in the community are engaged in agricultural activities such as crop farming (maize, cassava, tomatoes, etc.), livestock rearing (cattle, sheep, goats, pigs, poultry), and tree planting (Ghana Statistical Service, Citation2014).
Figure 1. Location of Mankramso community.
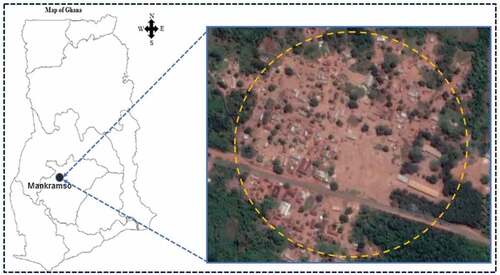
Electricity access has been a significant problem in the community over the decades. The community is about 7.0 km away from the national grid. People have to travel to the nearest community to access electricity for their daily activities. The community mainly relies on firewood, charcoal, kerosene lamps, candles, torches, and, to a lesser extent, solar lanterns for lighting and other energy activities. This electricity situation is a significant hindrance to quality education, human well-being, and community business activities.
2.2. HOMER Software
Hybrid Optimisation of Multiple Energy Resources (HOMER) software is broadly utilised for modelling hybrid systems in grid-connected and off-grid modes. It models both renewable and fossil fuel hybrid systems. HOMER performs simulation, optimisation, and sensitivity analysis. HOMER’s powerful optimising task speedily estimates numerous power system configurations. Also, the optimisation and sensitivity analysis techniques recognise numerous feasible system configurations (Okedu & Uhunmwangho, Citation2014). HOMER simulation designs the system by operating each system annually to ascertain which systems fulfil the electricity demand and restrictions assigned to them. The optimisation determines the most cost-effective method of meeting the electric load under the operating conditions. A sensitivity analysis examines the effects of changes in the system output under various input variables (Okedu & Uhunmwangho, Citation2014). HOMER discards infeasible systems and prioritises feasible ones based on the lowest NPC. displays the approach adopted in HOMER to determine a feasible hybrid energy system configuration.
Figure 2. Layout of the HOMER model.
Although HOMER is robust and gives extensive hybrid energy systems analysis, the software has some limitations. For instance, HOMER permits only a single objective function to be used for minimising the NPC, which means that multi-objective issues cannot be stated using this technique. Also, HOMER disregards intra-hour variability (Sinha & Chandel, Citation2014) and variations in bus voltage (Khan & Javaid, Citation2020; Kumar, Citation2016). It demands highly detailed input data and time, and the optimisation processes might be lengthy (Motjoadi et al., Citation2020).
2.3. Electrical load estimation for Mankramso community
The electricity demand for Mankramso was assessed through a field survey to investigate the electrical equipment/appliances that the people wish to own when electricity is available. The community household sizes vary from 4 to 7 people, and house sizes range from 1 to 3 bedrooms. In this study, an average of 3 rooms per household, a household size of 5 people, and a total of 400 households were considered for analysis. The study adopted the World Bank’s new multi-tier framework (MTF) energy access index (household use, productive use, and community use) to categorise the community’s electricity demand, as shown in . Also, the electrical appliance power ratings are classified into tier 1 (very low), tier 2 (low), tier 3 (medium), tier 4 (high), and tier 5 (very high) based on the multi-tier approach (Bhatia & Angelou, Citation2015). HOMER simulation and optimisation for hybrid mini-grid systems depends on the availability of electrical load profiles. The load profile is fed into the HOMER software for simulation and optimisation. Therefore, the electrical load profile for the community was generated using EquationEq. (1)(1)
(1) .
Table 1. Summary of electrical appliances under various tier categories for load estimation
where represents primary load (kWh/d),
represents appliance power rating (W),
is the number of appliances,
is the time of use (hr/d).
2.4. Resource assessment
2.4.1. Solar resource assessment
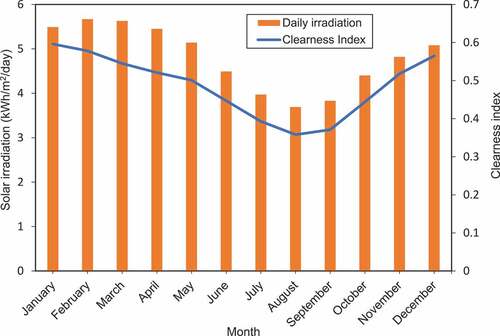
Solar irradiation was obtained from the National Aeronautics and Space Administration database based on the Mankramso location (latitude 7°24.8 N, longitude −1°0.8 W). HOMER uses solar irradiation to compute the photovoltaic (PV) power output. The solar irradiation and clearness index data for Mankramso are shown in . The community’s yearly average solar irradiation is about 4.99 kWh/m2/day. Solar irradiation is high from November—March (dry season) and relatively high from April—June. The months of July—September experience very low solar irradiation because of the rainy season in that period.
Figure 3. Mankramso’s monthly solar irradiation and clearness index.
2.4.2. Biomass resource assessment
Primary data on the livestock population was collected from Mankramso livestock farmers. This was done through a field survey using a comprehensive questionnaire to evaluate the community’s total livestock population. The ability to measure manure availability depends on the livestock population, mean manure output for each livestock, manure collection coefficient, and dry matter fraction (Junfeng et al., Citation2005; Kemausuor et al., Citation2014). The volume of manure is determined by body size, food type, physiological state, and nutrition level (Junfeng et al., Citation2005). The technical potential of livestock manure was computed using EquationEq. (2(2)
(2) ; Kemausuor et al., Citation2014):
where represents the livestock population,
is the manure produced per day, and
is the recoverability fraction. shows the estimated technical manure potential available for anaerobic digestion.
Table 2. Estimation of manure for anaerobic digestion
2.5. Hybrid energy system modelling and simulation
2.5.1. Solar PV Modules
HOMER computes PV power output (PVoutput) as follows (Odoi-Yorke et al., Citation2021):
where denotes PV module rated capacity (kW),
denotes PV derating factor (%),
denotes solar radiation incident on the module surface (kW/m2),
denotes incident solar radiation at STC (1000 W/m2),
denotes temperature coefficient (%/oC),
denotes PV cell temperature in oC and
represents PV cell temperature under STC (25 °C). shows the arrangement of the hybrid system under study. The PV modules would be mounted on the ground at a tilt angle of 10° and oriented towards the south. The derating factor is taken to be 85%. Also, a ground reflectance of 20% is considered. The PV array lifetime is assumed to be 25 years. presents selected PV module technical specifications used in the HOMER simulation.
Figure 4. Arrangement of hybrid system components.
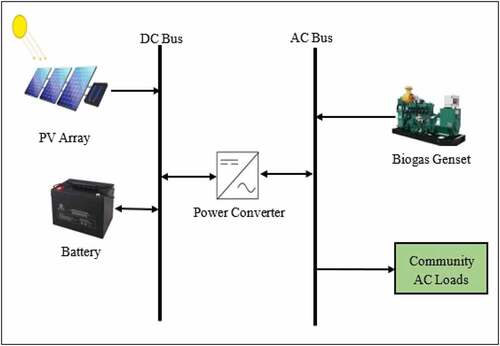
Table 3. Selected PV module technical specifications. (Jinkosolar, Citation2015)
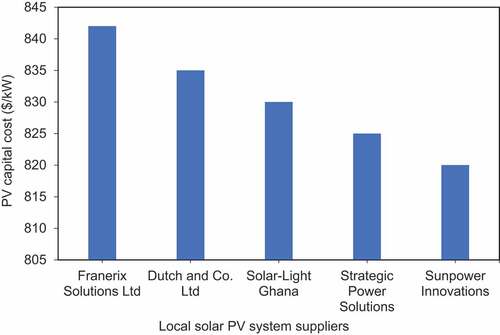
The PV capital costs comprise PV modules, mounting structure, wiring and cables, and installation costs. Currently, solar modules are free from import duties in Ghana, making them very cheap and affordable. This study obtained the PV system’s supply and installation costs by requesting prices from five local vendors, as shown in . As per quotations obtained in , the PV modules’ supply and installation cost is taken to be 830 $/kW for the study. The PV module has no replacement cost since the PV module’s lifespan is equivalent to the project’s life span. The operation and maintenance cost is assumed to be 8 $/kW/yr, mainly for cleaning and washing dirt and dust accumulated on the modules.
Figure 5. PV module supply and installation costs from local vendors.
2.5.2. Biogas system
The biogas system comprises a biodigester and a genset. The digester’s purpose is to convert raw biomass feedstock into biogas through anaerobic digestion. Thereafter, the biogas is injected into the biogas genset to generate electricity. Mankramso is a farming community with a considerable amount of biomass feedstock. This study’s primary biomass feedstock available for anaerobic digestion is livestock manure from cattle, goats, sheep, pigs, and chickens. The feedstock’s average price, which comprises feedstock collection, transportation, and seasonality, is assumed to be 2 $/kg because these feedstocks are collected within the community. This feedstock price is a reward for gathering feedstock to motivate people. The carbon content of the feedstock is assumed to be 50%. The lower heating value of biogas is taken to be 5.5 MJ/kg.
HOMER uses fuel consumption to estimate genset power output. The fuel slope specifies the amount of fuel used by the generator for electricity generation. The fuel consumption rate is computed using EquationEq. (4)(4)
(4) (Odoi-Yorke et al., Citation2021):
where represents genset fuel consumption (L),
denotes genset fuel curve coefficient,
denotes genset rated capacity,
denotes genset fuel curve slope, and
denotes genset output power. HOMER computes genset electrical efficiency using EquationEq. (5)
(5)
(5) :
Where is the yearly electrical output of the generator,
is the total yearly fuel consumed by the generator (kg/yr), and
is the lower heating value of biogas (MJ/kg). The factor of 3.6 in EquationEq. (5)
(5)
(5) is deduced from 1 kWh = 3.6 MJ. The genset consumes fuel (biogas) to generate electricity. The following key parameters were set in HOMER for genset modelling: minimum load ratio (30%), lifetime (15,000 hrs), intercept coefficient (0.17 kg/hr/kWrated) and (1.5 kg/hr/kWoutput). In this study, genset sizes ranging from 5–100 kW were considered for simulation.
Presently, local companies such as Biogas Technologies Limited, Green-Tech Biogas, DAS Biogas & Construction Company, Zesta Environmental Solutions Limited, etc., are responsible for the construction of biodigesters in Ghana. The capital cost of a biogas system includes the cost of the biodigester and the generator. Generally, the cost of a biodigester depends on the volume or size of the digester. The volume of the digester is computed as follows (German Solar Energy Society (DGS) & Ecofys, Citation2005):
represents digester volume,
represents the technical potential of livestock manure,
is the co-substrate, and
is the retention time, normally around 30–40 days for mesophilic digestion. The capital cost for the construction of biodigesters in Ghana ranges from $1,549 to $2,817 for a 6 m3 plant to $3000 to $6000 for a 10 m3 plant, with a unit cost of 235 to 446 $/m3 (Bensah et al., Citation2011).
A recent study shows that a digester’s cost in Ghana is 300 $/m3 (Mohammed et al., Citation2017). The biogas system’s cost, including piping and cleaning components, is approximately 1600 $/kW (Honny Power, Citation2021; Jumare et al., Citation2020). The costs for replacement and O&M are 1300/kW and 0.11/hr, respectively (Honny Power, Citation2021; Jumare et al., Citation2020). In this study, the biodigester’s cost is added to the HOMER system’s fixed capital cost. There are currently no local suppliers of biogas generators in the Ghanaian market. However, the price for the biogas genset was obtained from the international market and through literature. Hence, the biogas genset capital and replacement costs are 500 $/kW and 450 $/kW, respectively (Ettes Power Solutions, Citation2021; Ghenai & Janajreh, Citation2016). The O&M cost is $0.03 per hour (Ghenai & Janajreh, Citation2016).
2.5.3. Battery
The battery stores the energy that the hybrid system produces. The cost of a 1.2 kWh battery in the Ghanaian market ranges from 215–230 $/kWh (AIMS Power, Citation2020b). The O&M cost of the battery is assumed to be 2 $/kWh/year. Due to Ghana’s climatic conditions, a battery lifetime of 5 years is considered for simulation. Detailed specifications used for designing the battery bank is shown in . HOMER calculates battery autonomy and battery lifetime based on EquationEq. (7)(7)
(7) and EquationEq. (8
(8)
(8) ), respectively (Odoi-Yorke et al., Citation2021):
Table 4. Key technical specifications for designing battery bank
Where denotes battery quantity,
denotes battery nominal voltage,
denotes nominal battery capacity, and
denotes minimum battery state of charge.
represent the average electric load.
where denotes the number of batteries in the battery bank,
denotes a battery’s lifetime throughput,
denotes an annual battery throughput, and
denotes battery float life.
2.5.4. Power converter
The power converter has an inverter input (which converts DC to AC) and a rectifier input (which converts AC to DC). The PV power output is DC, and the genset power output is AC. The converter is sized to meet the community’s peak load. The converter efficiency and lifespan are taken as 95% and 15 years, respectively. A converter costs around 325 $/kW from reputable Ghanaian retailers (AIMS Power, Citation2020a; SUKA, Citation2020). The replacement cost is taken to be 300 $/kW. The operating and maintenance cost is taken to be 7 $/kW/yr.
2.5.5. Diesel genset
HOMER computes the diesel genset output power using EquationEq. (9(9)
(9) ; Singh et al., Citation2021):
where, denotes diesel genset fuel consumption rate,
denotes genset rated capacity,
denotes output power produced from the genset, and
and
denote the diesel genset fuel curve coefficient and slope, respectively. The capital, replacement, and operating and maintenance costs for the diesel genset are taken from a recent study in Ghana by Odoi-Yorke et al. (Citation2021). Also, the diesel price in Ghana at the study time was about 1.074 $/L (GlobalPetrolPrices, Citation2021). Thus, the addition of 10% to account for delivery and transportation costs increased the price to about 1.18 $/L.
2.6. System constraints and project input parameters
The maximum annual capacity shortage was set at 0% since the power system must meet the daily electric load demand throughout the year without a shortage. Also, since this study combines solar iradiation and biomass, the minimum renewable fraction was set at 100%. 10% of the hourly electric load is chosen for the operating reserve to ensure a reliable electricity supply. The operation reserve, also known as surplus operating capacity, immediately responds to an abrupt rise in the electric load or an unexpected decline in the renewable power output.
The project lifetime of 25 years, used in other similar projects, was assumed. The discount rate is about 12% (Bank of Ghana, Citation2020a). Also, the inflation rate at the time of the study was about 10% (Bank of Ghana, Citation2020b). The cost needed to develop mini-grid transmission and distribution was estimated based on an inter-household distance of 20 m. The distribution line’s cost was obtained from Trama Tecno Ambiental (TTA, Citation2017). The system’s fixed capital costs for biodigester, distribution, and transmission are estimated at $104,000. The O&M cost is taken to be 1% of the total fixed capital cost.
2.7. Key economic metrics and input sensitivity variables
The salient critical economic output metrics determining the project’s viability are Net Present Cost (NPC) and Levelized Cost of Electricity (LCOE). NPC sums all component costs minus revenues over the project’s lifespan. HOMER computes the total NPC as follows (Odoi-Yorke et al., Citation2021):
where represents total annualised cost,
denotes real discount rate per annum,
denotes project lifetime, and
denotes capital recovery factor. Expression for R is given by EquationEq. (11)
(11)
(11) :
where represents the real discount rate, and
represents number of years.
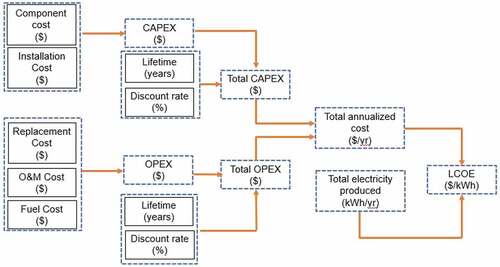
The LCOE calculates the unit cost of electricity throughout the project’s total lifetime and is extensively used to assess a project’s viability and profitability in contrast to other power systems (Shen et al., Citation2020). Globally, the LCOE is frequently used by investors, decision-makers, and policymakers to investigate the affordability of multiple technologies. This facilitates decision-making on whether to invest in a power generation project when comparing the cost of electricity to the market price at which an investment in power generation is lucrative (Bruck et al., Citation2018). Usually, the LCOE is given by EquationEq. (12(12)
(12) ; Bruck et al., Citation2018; Shen et al., Citation2020).
where is the system’s total lifecycle cost, and
is the system’s total lifetime energy production. EquationEq. (12)
(12)
(12) is further simplified to obtain the
as follows: (Ebenhoch et al., Citation2015; Lerch et al., Citation2018)
where, is the levelized cost of electricity,
is the total energy generated by the system in kWh in year t,
is the discount rate (%),
is the project lifetime in years, and
is the individual year of lifetime (1,2, … n). Also,
is the system’s total capital expenditure, and
is the system’s operation and maintenance expenditure. A flowchart describing the process involved in calculating the LCOE is shown in .
Figure 6. Flow chart for calculating the levelized cost of energy.
Sensitivity analysis helps to study changes in specific parameters on the hybrid system’s key economic metric performances. The selected key parameters to investigate the hybrid system’s resilience are the discount rate, capital subsidy, biomass feedstock price, and variations in electricity demand, as presented in .
Table 5. Salient parameters for sensitivity test
2.8. Carbon emissions and savings
Generally, greenhouse emissions from electricity generation vary depending on the fuel source and plant type. Indeed, using renewable energy sources for electricity generation minimises greenhouse gas emissions compared to fossil fuels. EquationEq. (14)(14)
(14) estimates the total CO2 emissions from the proposed hybrid energy systems (Elkadeem et al., Citation2020; Singh et al., Citation2021):
where, denotes the system’s total CO2 emissions,
denotes the total amount of fuel consumed (L), and
represents the fuel’s lower heating value (MJ/L). Also,
represents the carbon emission factor (tonne carbon/TJ), and
denotes the oxidised percentage of carbon, in which 3.667 gm of CO2 contains 1 gm of carbon.
Consequently, the percentage of CO2 emissions reduction between the hybrid renewable energy systems and diesel-only systems is given by EquationEq. (15)(15)
(15) :
3. Results and discussions
3.1. Community energy demand
The total electricity demand for the Mankramso community is about 96 MWh/yr. Mankramso’s average electricity consumption per capita is estimated at 51 kWh per year based on population size and total energy demand. The estimated electricity consumption per capita is within level 1 (basic human need) and is classified under the incremental levels of access to energy (Bhatia & Angelou, Citation2015). The implication is that the community’s total electricity consumption only satisfies basic needs such as lighting, health, education, communication, and community services. Also, Mankramso electricity consumption per capita is about 160.2% lower than the per capita electricity consumption of 461.7 kWh for Ghana in 2019. However, Ghana’s electricity consumption per capita has shown a growth rate of 1.3% from 2000 to 2019 (Energy Commission, Citation2020).
The distribution of electricity demand in the community is presented in . It can be observed that households have the highest consumption, about 50 MWh (approximately 52%) of electricity. Household demand is dominated by 52% tier 1 and 38% tier 2 appliances. Electricity demand for productive uses such as grain milling, tailoring, bars, salons, etc. is about 34 MWh, mainly dominated by tier 3 (62%) and tier 5 (26%) appliances. Other electricity demand for productive uses emanates from tier 4 (8%), tier 2 (9%), and tier 1 (2%) appliances. Furthermore, electricity demand for community use, which comprises schools, health clinic, streetlights, and churches, is about 12 MWh/yr. All appliances classified under tier 2 contribute about 82% of the total electricity for community use. Other contributions include tier 1 (9%) and tier 3 (8%) appliances. displays the distribution of appliances by tier categories and electricity consumption. It can be observed that tier 2 appliances consume about 36% of the total electricity demand across the various indices. Next are tier 1 (29%), tier 2 (23%), and tier 3 (23%) appliances. Tier 5 and tier 4 appliances’ contributions are low, at about 9% and 3%, respectively, mainly for productive use.
Figure 7. Appliance distribution by tier category, duration, and electricity consumption.
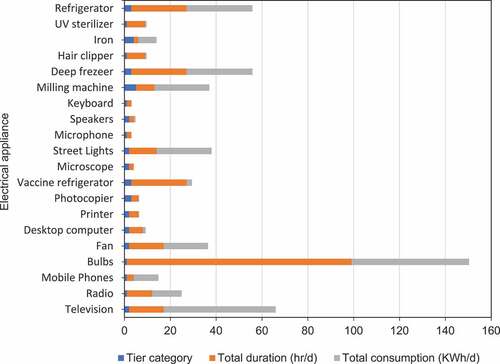
Table 6. Distribution of annual electricity demand
Similarly, it can be observed in that appliances such as bulbs (tier 1) and televisions (tier 2) have the highest share of electricity consumption. This is due to the quantity and usage hours utilised across the various indices, especially households. All households interviewed would want to own an average of three bulbs for lighting. Correspondingly, 50% of households would want to own a television. Likewise, deep freezers and refrigerators that run continuously contribute about 11% of the total energy consumed. Milling machines for productive use and street lights for community use also contribute about 9% each to the total electricity consumed. Besides, milling machines have high power capacity but are limited to only five grain millers available in the community for productive use. Other appliances such as fans, radios, mobile phones, and irons show slightly higher electricity consumption, between 3% and 7%. Although iron has a high power-rating capacity, it is owned by only tailors with a minimum usage hour. Furthermore, the electricity consumption for each remaining appliance is less than 1%.
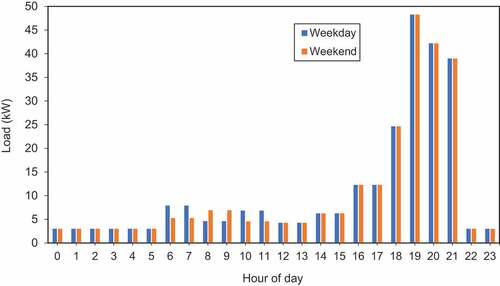
The community’s daily hourly load profile is shown in . It can be seen that both weekday and weekend loads are the same except on Saturdays and Sundays. The lowest and highest daily electric load consumption were estimated at 2.98 kW and 47.26 kW, respectively. The electrical load is low from 22:00 to 06:00 because almost 90% of the population is asleep, and only appliances such as street lights and cold store refrigerators are in use. The highest load is experienced from 16:00 to 21:00.
Figure 8. Mankramso’s daily hourly load profile.
3.2. Hybrid energy system performance
The HOMER optimisation explored the optimally feasible systems amongst the different capacities selected, taking into account the estimated electric load. HOMER ranked the optimum systems according to the lowest NPC. presents the top 10 feasible hybrid system configurations appropriate to meet the community’s electricity demand. The optimum power system configuration comprises PV modules (50 kW), biogas genset (20 kW), converter (42 kW), and battery (237 kWh). The annual electricity generated from the power systems is about 141.573 MWh. The PV modules and biogas genset contribute to 51% and 49%, respectively, to the yearly electricity generated. Also, about 95.896 MWh of the annual electricity generated is consumed by the community electrical loads. The total amount of electricity lost is about 34.288 MWh/yr. The unmet load that the power system can not serve is estimated at 0.02 kWh/yr. The annual capacity shortage, which accounts for the power system’s feasibility, is about 0.1%. The capacity shortage is less than the 0.5–5% minimum capacity shortage for power systems (Givler & Lilienthal, Citation2005). shows the average monthly electricity generation from PV modules and biogas genset. The electricity generated from PV modules is higher than the generation from biogas gensets from December—April. During these periods, the community is expected to experience a clear atmosphere that affects solar irradiation and increases the energy yield. Likewise, electricity generated from PV is low from July—September due to low solar irradiation resulting from frequent rainfall and a cloudy atmosphere. Furthermore, when the PV power output is low, electricity generation from a biogas genset complements it.
Figure 9. Monthly average electricity production.

Table 7. List of top 10 selected feasible PV/biogas hybrid system configurations
The total NPC for the hybrid system is estimated at $506,629. The hybrid system’s initial investment and annual operating costs are about $221,317 and $14,303.73, respectively. Also, the LCOE generated from this system is around 0.265 $/kWh. However, this LCOE is about 64% higher than Ghana’s average electricity end-user tariff of 0.137 $/kWh (Energy Commission, Citation2020). The LCOE is approximately 90% higher than the current electricity tariff of 0.10 $/kWh paid by lifeline customers and about 44% higher than residential customers that consume about 51–300 kWh/month. Similarly, it is only 14% higher than the tariff (0.23 $/kWh) for residential consumers in the highest tier (600+ kWh/month). Nevertheless, this low electricity tariff paid by residential customers in Ghana is heavily cross-subsidised compared to non-residential and other sectors. The LCOE from the PV/biogas system has a good prospect for development when there is a cross-subsidisation of electricity costs. This would enable the consumers, mostly peasant farmers, to afford the electricity to improve their living standards. Additionally, the system LCOE is promising and comparable to the LCOE determined in similar studies in different countries, as summarised in . Salient observations gleaned from are the close similarity in the system configurations and feedstocks utilised for biogas production. This hybrid energy system LCOE of 0.265 $/kWh is promising and outshines the LCOE generated for a UAE study by Ghenai and Janajreh (Citation2016). Correspondingly, the LCOE is almost comparable to the LCOE generated by Sanni et al. (Citation2019) in Nigeria and D’Rozario et al. (Citation2015) in Bangladesh. It can be observed in that the LCOE is higher compared to the studies in Ethiopia by Abaye and Haro (Citation2018) and in India by Mishra et al. (Citation2016). The aforesaid studies’ lower LCOE might be due to the system configuration, which comprises PV, wind, biogas genset, and battery components, compared to PV, biogas genset, and battery for this study, affecting the entire NPC.
Table 8. Similar studies on PV/biogas hybrid energy systems
This study modelled and investigated other power system options for remote area electrification, such as PV/diesel/battery and diesel genset-only systems.The power systems were modelled to have a renewable fraction (percentage of renewables in the electricity generation mix) of 50% (PV/diesel/battery) and 0% (diesel genset only) compared to 100% (PV/biogas/battery). In view of this, the power systems’ environmental and economic performance is compared to the proposed system for justification. The technical performance of the hybrid systems is summarised in . The results show that the PV/diesel/battery and diesel-only power systems can meet the community’s electricity demand from a technical perspective. However, these power plants are not economical compared to the PV/biogas system. For instance, the NPC of PV/biogas/battery is far lower, between 5% and 114%, compared to the other power system options (). This is due to the higher cost of fuel (diesel) affecting the total NPC of the systems. Also, the LCOE generated from PV/biogas is about 52% and 115% cheaper than the LCOE from PV/diesel/battery and diesel only, respectively (). This indicates that consumers might pay more for electricity to perform basic daily activities when diesel gensets are used for electrification in the community. Nevertheless, the upfront cost of PV/biogas/battery is higher than other options. Usually, renewable energy projects have high initial investment costs but lower operating and maintenance costs than fossil-based electrification projects.
Table 9. Comparative summary of hybrid energy systems’ technical performance
Table 10. Comparative summary of hybrid energy systems economic performance
A detailed comparative summary of CO2 emissions from the hybrid energy systems is presented in . The results show that the PV/biogas/battery system has the lowest CO2 emissions released compared to the other power systems. In terms of CO2 emissions savings, PV/biogas/battery systems save about 99.8% and 99.2% of CO2 emissions when compared to PV/diesel and diesel-only systems, respectively. In Ghana’s context, adopting a PV/biogas/battery system for rural electrification could contribute to Ghana’s agenda of saving about 11 million tonnes of CO2 emissions by 2030 (Energy Commission, Citation2019). These findings attest that deploying a PV/biogas/battery mini-grid system is the best option for consumers in rural Ghana rather than operating PV/diesel/battery and diesel genset systems in terms of emission reduction.
Table 11. Comparative summary of hybrid energy systems emissions
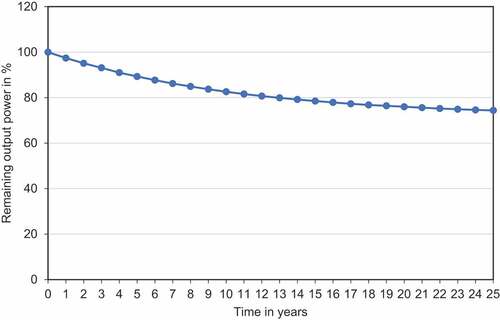
PV module degradation, which describes the module’s performance over the project lifespan, is shown in . Evaluating the energy production of PV modules over their lifespan is contingent on the module’s expected degradation rate (Branker et al., Citation2011). In general, solar PV modules degrade with time, which impacts the efficiency of the module. The degradation mechanism causes a gradual loss of output power over time. It can be seen in that a negative exponential curve exists between the remaining output power and the time of degradation for the modules. Correspondingly, the remaining output power is high from year one and gradually declines over time. The results obtained also show that the module degradation rate for the first few years (1–10 years) is within 2.3–1.6% and subsequently declines to 0.9–0.3% for long-term degradation (11–25 years), with an average degradation rate of about 0.95% per year. The degradation of the modules might be due to factors including climate, lamination materials, harsh environmental conditions, exposure period, and solar irradiation concentration (Lillo-Sánchez et al., Citation2021). Besides, the modules’ average degradation rate (0.95% per year) is within the limit assumed for a typical module degradation rate of 0.5–1.0% per year (Branker et al., Citation2011). The module’s annual average remaining output power is about 82% per year. Moreover, the modules are expected to have about 74% of their output power after the project lifespan.
Figure 10. Degradation of PV modules.
shows the cost breakdown for the PV/biogas/battery hybrid system components. The hybrid system’s NPC comprises capital, replacement, fuel, and O&M costs. The replacement cost dominates the hybrid system’s NPC with 41.3%. Next are capital costs (41.2%), O&M costs (16.3%) and fuel costs (1.3%). The total capital cost is estimated at $221,322.50. This is the initial investment required to commence the project. Other costs (which are needed for the development of a biodigester and the power system’s transmission and distribution systems) contribute about 47% of the total cost. The battery has the highest capital cost, contributing about 24% of the system’s NPC. This high cost is due to the large battery storage capacity, which intends to provide reliable dispatch of electricity when the electricity generated from the power systems is insufficient to meet the load. PV and converter capital cost contributions are about 19% and 6%, respectively. The biogas genset accounts for about 5% of the total capital cost.
Figure 11. Hybrid energy system cost breakdown.
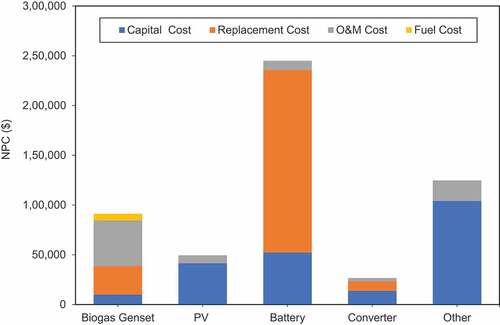
A replacement cost is the amount needed to replace a component when its lifespan is up. The hybrid system’s replacement cost represents about 41.3% of the entire system’s NPC. The PV lifetime equals the project lifetime; thus, its replacement cost is zero. The converter contributes about 4% of the entire system’s replacement cost. Also, the battery contributes about 83% of the system’s replacement cost. This high contribution is due to the battery’s storage capacity and lifetime. However, the disposal of old batteries might be a source of income for consumers due to the high inherent value of lead across the globe. The batteries could be sold to lead smelters operating in Ghana, which specialise in recycling used-lead acid batteries to produce raw lead (Atiemo et al., Citation2016). The smelters could also recycle the plastics from battery cases (mainly polypropylene) and sell them to the domestic or foreign market to manufacture consumer products such as containers, bowls, buckets, etc. (Atiemo et al., Citation2016).
Biogas genset replacement cost contribution is about 13%. Generally, genset engines start to wear down as the genset ages. This reduces the genset’s output power and aggravates some appliances to cut in and out. Also, when mechanical parts age, the engine consumes more fuel to generate the same power. Older gensets require more repairs, so purchasing a new genset saves money. The disposal of old gensets would not have significant environmental implications in the community. Nevertheless, this might instead be a source of revenue for the community. The implication of this is that the replaced gensets can be sold to local scrap dealers. The popularity of the scrap business has forced scrap dealers to travel considerable distances to buy scraps (Andrews et al., Citation2015). Presently, in Ghana, the scraps are recycled to manufacture iron and steel mills used for armour plates, axles, bars, rebar, etc.
O&M costs are required for regular maintenance of the hybrid system components during operation. The biogas genset has high O&M costs due to prompt removal of worn-out parts, fluid level inspection, battery inspection, and fuel and air filter replacement. Other costs for maintaining the biodigester and the distribution and transmission systems are about 24% of the entire O&M cost. The battery, PV modules, and converter contribute about 11%, 9%, and 4%, respectively, to the total O&M cost. The fuel cost is attributed only to the biogas genset. It can be concluded that the hybrid system NPC contribution is dominated by batteries (45.6%), others (23.2%), biogas genset (17%), PV modules (9.2%), and converter (5%). Hence, the battery is the most expensive component for a power system of this nature.
3.3. Sensitivity analysis
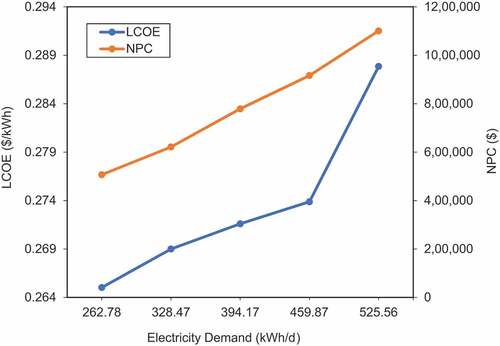
A sensitivity test was performed to envisage the resilience and competitiveness of the hybrid system LCOE when there are rapid variations in specific vital parameters that might affect the system. The impact of increasing electricity demand on NPC and LCOE has been investigated by gradually increasing electricity demand from 25% to 100%, as shown in . This would help to predict the resilience of the system when community demand suddenly increases over time. shows that LCOE increases with NPC as electricity demand surges. However, both the NPC and LCOE are nearly parallel to each other. The variation in NPC is high compared to LCOE as demand increases. For instance, NPC increases by about 22%, while LCOE increases by only 1.5% when electricity demand is 328.47 kWh/d (25% increase). At a 50% increase in electricity demand (394.17 kWh/d), NPC and LCOE increased by 54% and 2.4%, respectively. Also, at a 100% surge in electricity demand (525.56 kWh/d), NPC and LCOE gradually increase by 117% and 8.7%, respectively. It can be observed that the base case LCOE produced at a demand of 262.78 kWh/d is competitive with the LCOE generated as electricity demand gradually increases. Even at a 100% increase in demand, the LCOE is only about 9% lower than the base case LCOE, making the hybrid system cost-effective. Moreover, the abrupt increase in NPC emanates from additional component capacities such as solar PV modules, batteries, and converters added to the power system, which incur other costs as electricity demand increases due to community changes over time. The biogas system was kept constant as electricity demand increased during the sensitivity test.
Figure 12. Impact increasing in electricity demand on NPC and LCOE.
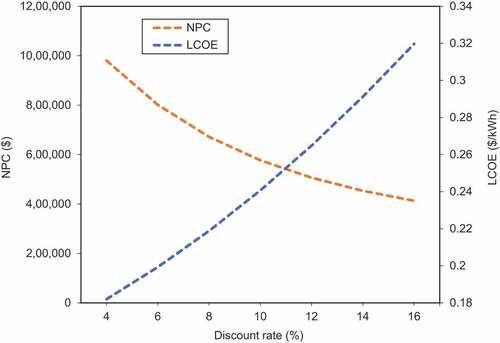
Generally, the discount rate plays a keen role in the financial analysis of investment projects. It is used in the discounted cash flow analysis to evaluate an investment’s value based on the projected future cash flows. The discount rate is applied when an individual borrows money from a local or international bank to execute a project. The discount rate impact on LCOE and NPC is illustrated in . It can be seen that as the discount rate is reduced, the LCOE decreases. Also, the discount rate and the LCOE have a nearly linear relationship. The base scenario discount rate is 12%, and this gives an NPC of $506,629 and an LCOE of 0.265 $/kWh. A discount rate of 8% decreases the base scenario LCOE by 10% and increases the NPC by 33%. Likewise, a lower discount rate of 4% reduces LCOE by about 32%, and NPC increases by 94%. Furthermore, a higher discount rate of 16% increases LCOE by 25% and decreases NPC by 19%. These momentous changes in LCOE are due to the system’s annualised cost being impacted by variations in the discount rate. As the discount rate is reduced, the annualised cost decreases, lowering the LCOE. Capital-intensive technologies are mostly responsive to discount rate fluctuations. Nevertheless, a reasonably high-cost technology may be susceptible to market risks, resulting in higher costs. Despite its high initial cost, the hybrid system is resilient to discount rate changes. In view of this, investment firms could break even on the project and earn acceptable returns on investment due to the discount rate impact.
Figure 13. Effect of discount rate on hybrid system NPC and LCOE.
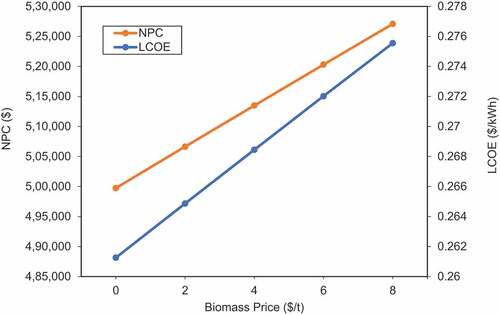
In this study, the biomass feedstock price is mainly the cost of feedstock collection and transportation. Presently, Mankramso farmers dispose of the livestock manure. This study assumes that the farmers would be compensated for gathering the feedstock for anaerobic digestion. The base scenario feedstock price is taken to be 2 $/tonne. The effect of variation in biomass prices on the system’s LCOE and NPC is shown in . It can be seen that there is a positive linear relationship between biomass prices on LCOE and NPC. At a higher price of 4 $/tonne (50% increase), the system LCOE increases by only 1%, and the NPC increases by about 1.4%. Also, at $8/tonne (75% increase), the LCOE increases only by 5%. This result indicates that the impact of biomass price on the system’s LCOE is slightly minimal; thus, it does not significantly influence changes in LCOE.
Figure 14. Impact of biomass price on LCOE and NPC.
shows the capital subsidy’s impact on the hybrid system NPC and LCOE. The resilience of the system NPC and LCOE was investigated using five different upfront capital subsidy scenarios: 0%, 25%, 50%, 75%, and 100%. The 0% is the base scenario when the system is implemented without subsidies such as grants and donor aid from the government or nongovernmental organisations (NGOs). A 25% capital subsidy reduces the LCOE by 13%, and a 50% subsidy declines the LCOE by 24%. Correspondingly, a 100% subsidy reduces the LCOE by about 48%. This sensitivity test indicates that the LCOE is only 32% higher than the current tariffs charged to the lifeline customers when the entire system’s upfront cost is subsidised. This clearly indicates that even with a 100% subsidy, the hybrid system’s LCOE is still high compared to the grid tariff. However, these findings confirm similar studies conducted in Ghana by Adaramola et al. (Citation2017), CEESD (Citation2019), and Agyekum and Nutakor (Citation2020), where the proposed hybrid energy system LCOE could not reach grid parity at a 100% capital subsidy. A recent study attests that an unsubsidised mini-grid costs approximately 0.40–0.50 $/kWh, but with ongoing technological advancements and efficiencies, this cost could decline to less than 0.20 $/kWh by 2030 (United Nations, Citation2021). Similarly, a Tier 1 off-grid solar system is not currently affordable for many households (United Nations, Citation2021).
Figure 15. Effect of capital subsidy on the hybrid system LCOE.
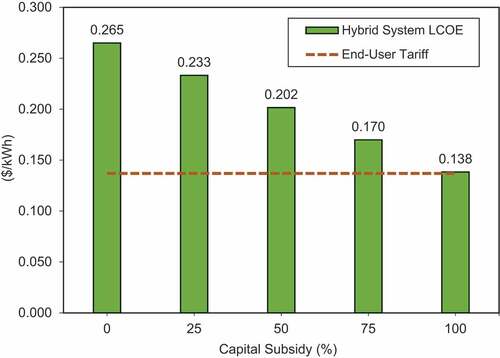
Without these subsidies, the PV/biogas hybrid mini-grid system would be unable to achieve grid parity or operate at a competitive level, which could have an adverse effect on the proposed plant’s acceptability. Moreover, lowering costs of critical components of mini-grid and off-grid solar systems has spurred growth, but costs must decline further to boost expansion and affordability for the poorest. In light of this, extra subsidies on the hybrid system’s replacement and operation and maintenance costs might significantly lower the LCOE and enable the system to achieve grid parity. Although the hybrid system’s LCOE could not reach parity, several studies in different countries show that poor rural households are eager to pay a high price for reliable electricity access to meet their daily needs (Blum et al., Citation2013; World Bank Group, Citation2008).
Moreover, solar home systems (SHS) are other options that could be utilised to provide lighting and power small electrical appliances for communities without access to the national grid. These SHS are rated at 11 Wp and above, and the prices vary depending on system type, size, and complexity (Kolhe et al., Citation2015; REN21, Citation2021). Currently, the SHS can be obtained in Ghana by either paying for the system’s total upfront cost or using the Pay-As-You-Go (PAYGo) model (REN21, Citation2021). The PAYGo companies usually provide “lease-to-own” or “usage-based” payment options for consumers (REN21, Citation2021). PAYGo is cheaper than kerosene but more costly than grid electricity in Ghana. However, PAYGo could be cheaper than the grid when consumers pay for the total up-front costs. SHS can only power a few direct-current gadgets, such as a light bulb, radio, mobile phone, etc. Nevertheless, a large capacity of PV modules, batteries, and inverters is required to power many appliances, which are expensive and seldom economical. Local SHS suppliers usually have smaller operational territories and often sell cash-and-carry, excluding low-income consumers (USAID, Citation2019). Also, poor rural residents can not finance a one-time payment for these systems’ hefty costs (Pelizan et al., Citation2019). A recent study asserts that electricity costs are cheaper with mini-grids than with kerosene or dry cell batteries in Ghana (Ackah et al., Citation2020). Consequently, although crowdfunding has developed into an effective means of financing for local businesses in several countries, Ghanaian businesses are yet to take hold of crowdfunding platforms for the SHS market (USAID, Citation2019). Ghana’s mini-grid market is far more tightly regulated than its SHS market. This implies that electricity generation from this hybrid mini-grid system might receive extensive consideration for deployment in Ghana. It would undoubtedly facilitate and foster the deployment of this hybrid mini-grid in Ghana.
Although the hybrid system LCOE did not match the grid tariff at 100% capital subsidy, the Ghana Mini-Grid Electrification Policy provides a pathway for deploying this hybrid system. The policy ensures that consumers who consume electricity from a mini-grid system are subject to the same price policies as those who consume electricity from the national grid. Establishing the national uniform tariff is regarded as a matter of social fairness, as it ensures that rural consumers do not pay more than their wealthier urban counterparts. Though the government views mini-grid development as completely top-down, private mini-grids’ lack of a licencing system might affect this viewpoint. Accordingly, the interests of private developers are not taken into consideration because mini-grid development is deemed to be within the government’s authority. A big drawback for mini-grids has been private loan financing. Besides, the private mini-grid operators can not cross-subsidise consumer tariffs over a large consumer base compared to the national utility. However, permitting private mini-grid operators to charge cost-reflective tariffs would benefit the country’s private mini-grid development and accelerate private participation interest in a hybrid system of this nature (United Nations, Citation2021). Additionally, government actions such as an incentive policy could assist mini-grids of this sort in achieving grid parity.
Although mini-grids are privately created and operated without government funding in Ghana, few companies have entered this field. One of the first private companies to be licenced to operate solar mini-grids is Ghana’s Black Star Energy. The company already has 15 projects in the Ashanti Region, with more in the pipeline (Ackah et al., Citation2020).
4. Conclusion
This study analyses a PV/biogas/battery hybrid mini-grid system to meet a remote community’s electricity demand in Ghana . Findings from the electrical load investigation revealed that appliances under tier 2 consume about 36% of the total electricity demand across the various indices. Next are tier 1 (29%), tier 2 (23%), and tier 3 (23%). Also, tier 5 and tier 4 appliances contribute about 9% and 3%, respectively, to the total electricity consumption. Mankramso’s community electricity consumption per capita is low, comparable to only level 1 (basic human need) of the incremental levels of access to energy.
Carbon dioxide (CO2) emissions from the PV/biogas/battery system are about 313.68 kg/yr, compared to 41,487.7 kg/yr for the PV/diesel/battery system and 147,322.4 kg/yr for the diesel-only system. Therefore, deploying PV/biogas/battery for rural electrification outshines the other power systems in terms of emission savings. Fortunately, these carbon savings support the Ghana government’s agenda of saving about 11 million tonnes of CO2 emissions by 2030. Accordingly, the PV/biogas/battery hybrid system has the lowest NPC even though it has the highest initial investment cost compared to other power system options. The rising cost of fuel (diesel) affects the other system’s total NPC. Similarly, the LCOE generated from PV/biogas/battery is about 52% cheaper than PV/diesel/battery and 115% cheaper than a diesel-only system. The implication is that consumers may pay more for electricity when diesel generators are utilised for electrification in the community. The annual electricity generation from the PV/biogas hybrid system is approximately 141.573 MWh. PV modules and biogas gensets contribute 51% and 49%, respectively, of the annual electricity generated. The LCOE from the PV/biogas system is about 0.265 USD/kWh, which is relatively higher than the LCOE for Ghana’s household residents. Even with a 100% capital subsidy, the hybrid system’s LCOE is still high compared to the grid tariff. Nevertheless, the LCOE is promising and nearly comparable to the LCOE estimated by different authors in different countries in a similar study. Furthermore, the hybrid system LCOE shows good resilience to the discount rate and capital subsidies, which determines its attractiveness for future development. However, comparing the LCOE with Ghana’s current tariff structure reveals that a substantial subsidy on standalone power systems tariff is expected for rural electrification.
Based on the current uniform tariff, subsidising only upfront costs would not be worthwhile for the private sector. However, a subsidy on the replacement and O & M costs could reduce the system’s LCOE enough to make it cost-effective compared to the uniform tariff. Even though the system is quite costly, social fairness concerns and creative ways of promoting daytime electricity consumption for productive activities can help sustain it. Extending the national grid to the community is likely to be expensive and affected by high transmission and distribution losses. Nevertheless, the government could subsidise this hybrid system LCOE to parity with the LCOE from the national grid for the community dwellers who are mostly peasant farmers to afford this electricity. Future studies could utilise other bioenergy technologies like gasification coupled with solar PV and compare their performance to that of PV/biogas.
Acknowledgements
The authors are thankful to the Mankramso community elders for their enthusiastic support throughout household information gathering.
Disclosure statement
No potential conflict of interest was reported by the author(s).
Additional information
Funding
Notes on contributors

Flavio Odoi-Yorke
Flavio Odoi-Yorke is a Faculty Member at the Department of Renewable Energy Technology, Cape Coast Technical University. He has received his B.Sc. in Physics from Kwame Nkrumah University of Science and Technology and was awarded his M.Sc. in Energy Engineering from Pan African University Institute of Water and Energy Sciences (Including Climate Change). His research interests include Renewable Energy Systems, Energy Modelling, Rural Electrification, Energy Access & Planning, and Climate Change.
References
- Abaye, A. E., & Haro, R. D. (2018). Assessment of resource potential and feasibility study of standalone PV - Wind-biogas hybrid system for rural electrification. 2018 2nd International Conference on Electronics, Materials Engineering and Nano-Technology, IEMENTech, (pp. 18–31). https://doi.org/10.1109/IEMENTECH.2018.8465317
- Ackah, I., Bukari, D., & Suleman, S. (2020). Ghana’s transition to renewable energy mini-grids: An assessment of ownership, management and performance dynamics. International Journal of Strategic Energy and Environmental Planning, 2(3), 24–42.
- Adaramola, M. S., Agelin-chaab, M., & Paul, S. S. (2014). Analysis of hybrid energy systems for application in southern Ghana. Energy Conversion and Management, 88(2014), 284–295. https://doi.org/10.1016/j.enconman.2014.08.029
- Adaramola, M. S., Quansah, D. A., Agelin-Chaab, M., & Paul, S. S. (2017). Multipurpose renewable energy resources based hybrid energy system for remote community in northern Ghana. Sustainable Energy Technologies and Assessments, 22, 161–170. https://doi.org/10.1016/j.seta.2017.02.011
- Agyekum, E. B., & Nutakor, C. (2020). Feasibility study and economic analysis of stand-alone hybrid energy system for southern Ghana. Sustainable Energy Technologies and Assessments, 39(March), 100695. https://doi.org/10.1016/j.seta.2020.100695
- Ahmed, J., Harijan, K., Hameed Shaikh, P., & Ali Lashari, A. (2021). Techno-economic feasibility analysis of an off-grid hybrid renewable energy system for rural electrification. Journal of Electrical and Electronic Engineering, 9(1), 7. https://doi.org/10.11648/j.jeee.20210901.12
- AIMS Power. (2020a). 1000 Watt Pure Sine Power Inverter 12 Volt ETL Listed to UL 458. https://www.aimscorp.net/1000_Watt_Pure_Sine_Power_Inverter_12_Volt.html
- AIMS Power. (2020b). Cost of batteries. https://www.aimscorp.net/12-volt-100-amp-hour-battery.-agm-deep-cycle-sealed-lead-acid.-maintenance-free.html
- Andrews, N., Francis, A., & Engelbert, K. (2015). Scrap metals role in circular economy in Ghana, using Sunyani as a case study. African Journal of Environmental Science and Technology, 9(11), 793–799. https://doi.org/10.5897/AJEST2015.2000
- Ansong, M., Mensah, L. D., & Adaramola, M. S. (2017). Techno-economic analysis of a hybrid system to power a mine in an off-grid area in Ghana. Sustainable Energy Technologies and Assessments, 23(September), 48–56. https://doi.org/10.1016/j.seta.2017.09.001
- Atiemo, F., Faabeluon, L., Manhart, A., Nyaaba, L., & Schleicher, T. (2016). Baseline assessment on E-waste management in Ghana. http://sustainable-recycling.org/sustainable-recycling/wp-content/uploads/2016/07/Sampson_2016_SRI-Ghana.pdf
- Ayamga, E. A., Kemausuor, F., & Addo, A. (2015). Technical analysis of crop residue biomass energy in an agricultural region of Ghana. Resources, Conservation and Recycling, 96(March), 51–60. https://doi.org/10.1016/j.resconrec.2015.01.007
- Bank of Ghana. (2020a). Monthly Interest Rates. Retrieved June 23, 2020, from https://www.bog.gov.gh/economic-data/interest-rates
- Bank of Ghana. (2020b). Bank of Ghana monetary policy report inflation outlook and analysis. Retrieved https://www.bog.gov.gh/monetary_policy_rpts/inflation-outlook-and-analysis-report-may-2020
- Bensah, E. C., Mensah, M., & Antwi, E. (2011). Status and prospects for household biogas plants in Ghana-lessons, barriers, potential and way forward. International Journal of Energy and Environment, 2(5), 887–898. http://www.ijee.ieefoundation.org/vol2/issue5/IJEE_11_v2n5.pdf
- Bhatia, M., & Angelou, N. (2015). Beyond connections: Energy access redefined. In The World Bank. Retrieved https://openknowledge.worldbank.org/handle/10986/24368
- Blum, N. U., Sryantoro Wakeling, R., & Schmidt, T. S. (2013). Rural electrification through village grids - Assessing the cost competitiveness of isolated renewable energy technologies in Indonesia. Renewable and Sustainable Energy Reviews, 22, 482–496. https://doi.org/10.1016/j.rser.2013.01.049
- Branker, K., Pathak, M. J. M., & Pearce, J. M. (2011). A review of solar photovoltaic levelized cost of electricity. Renewable and Sustainable Energy Reviews, 15(9), 4470–4482. https://doi.org/10.1016/j.rser.2011.07.104
- Bruck, M., Sandborn, P., & Goudarzi, N. (2018). A Levelized Cost of Energy (LCOE) model for wind farms that include Power Purchase Agreements (PPAs). Renewable Energy, 122(July), 131–139. https://doi.org/10.1016/j.renene.2017.12.100
- CEESD. (2019). Viability analysis of mini-grid based electrification in Ghana. Retrieved https://snv.org/cms/sites/default/files/explore/download/viability_analysis_of_mini-grid_based_electrification_in_ghana_compressed.pdf
- D’Rozario, J., Shams, S., Rahman, S., Sharif, A., & Basher, E. (2015). Cost effective solar-biogas hybrid power generation system. Proceedings of the IEEE International Conference on Industrial Technology, 2015-June(June), (pp. 2756–2760). https://doi.org/10.1109/ICIT.2015.7125504
- Delano, O., Odou, T., Bhandari, R., & Adamou, R. (2020). Hybrid off-grid renewable power system for sustainable rural electri fi cation in Benin. Renewable Energy, 145, 1266–1279. https://doi.org/10.1016/j.renene.2019.06.032
- Ebenhoch, R., Matha, D., Marathe, S., Muñoz, P. C., & Molins, C. (2015). Comparative levelized cost of energy analysis. In Energy procedia (Vol. 80). Elsevier B.V. https://doi.org/10.1016/j.egypro.2015.11.413.
- Elkadeem, M. R., Wang, S., Azmy, A. M., Atiya, E. G., Ullah, Z., & Sharshir, S. W. (2020). A systematic decision-making approach for planning and assessment of hybrid renewable energy-based microgrid with techno-economic optimization: A case study on an urban community in Egypt. Sustainable Cities and Society, 54(March), 102013. https://doi.org/10.1016/j.scs.2019.102013
- Energy Commission. (2019). Ghana renewable energy master plan. Retrieved http://www.energycom.gov.gh/files/Renewable-Energy-Masterplan-February-2019.pdf
- Energy Commission. (2020). National Energystatistics 2000 - 2019. Retrieved http://energycom.gov.gh/files/2020ENERGYSTATISTICS-revised.pdf
- Ettes Power Solutions. (2021). Cummins biogas gensets. https://www.ettesgenerator.com/cummins-biogas-generator-set.html
- Fadli, D. (2019). Optimal sizing of PV/Diesel/battery hybrid micro-grid system using multi-objective bat algorithm. https://doi.org/10.9790/1813-0807010614
- German Solar Energy Society (DGS), & Ecofys. (2005). Planning and installing bioenergy systems : A guide for installers, architects and engineers/German Solar Energy Society (DGS) and Ecofys. In Processing. James & James (Science Publishers) Ltd. web:www.jxj.com.
- Ghana Statistical Service. (2014). 2010 population & housing census. Retrieved www.statsghana.gov.gh/docfiles/2010_District_Report/Ashanti/OffinsoNorth.pdf
- Ghenai, C., & Janajreh, I. (2016). Design of solar-biomass hybrid microgrid system in Sharjah. Energy Procedia, 103(April), 357–362. https://doi.org/10.1016/j.egypro.2016.11.299
- Girma, Z. (2013). Technical and economic assessment of solar PV/diesel Hybrid power system for rural school electrification in Ethiopia. International Journal of Renewable Energy Research, 3(3), 735–744. https://doi.org/10.20508/ijrer.08621
- Givler, T., & Lilienthal, P. (2005). Using HOMER® software, NREL’s micropower optimization model, to explore the role of gen-sets in small solar power systems case study: Sri Lanka. Retrieved http://www.nrel.gov/docs/fy05osti/36774.pdf
- GlobalPetrolPrices. (2021). Ghana diesel prices. Retrieved https://www.globalpetrolprices.com/Ghana/diesel_prices
- Goswami, A., & Sadhu, P. K. (2021). Adoption of floating solar photovoltaics on waste water management system: A unique nexus of water-energy utilization, low-cost clean energy generation and water conservation. Clean Technologies and Environmental Policy, 0123456789. https://doi.org/10.1007/s10098-021-02077-0
- Goswami, A., Sadhu, P. K., & Sadhu, P. (2020). Development of a grid connected solar-wind hybrid system with reduction in levelized tariff for a remote island in India. Journal of Solar Energy Engineering, 142(4), 044501. https://doi.org/10.1115/1.4046147
- Haghighat, A., Alberto, S., Escandon, A., Naja, B., Shirazi, A., & Rinaldi, F. (2016). Techno-economic feasibility of photovoltaic, wind, diesel and hybrid electri fi cation systems for off-grid rural electri fi cation in Colombia. Renewable Energy, 97, 293–305. https://doi.org/10.1016/j.renene.2016.05.086
- Hailu, E. A., & Mezgebu, C. (2017). Design and simulation of standalone hybrid (solar/biomass) electricity generation system for a rural village in Ethiopia. International Journal of Scientific & Engineering Research, 8(7), 1570–1574.
- Honny Power. (2021). Gas Generator (HGGM) 20kW-1452kW. http://www.honnypower.com/Power8
- IEA. (2017). WEO 2017 Chapter 1: Introduction and scope. IEA: World Energy Outlook. https://doi.org/10.1787/weo-2017-en
- IEA, IRENA, UNSD, WB, & WHO. (2019). Tracking SDG 7: The energy progress report, Washington DC. Retrieved https://trackingsdg7.esmap.org/data/files/download-documents/2019-TrackingSDG7-FullReport.pdf
- IRENA. (2014). Accelerating Off-grid Renewable Energy. Retrieved http://www.irena.org/documentdownloads/publications/iorec/iorec_2014_key_findings.pdf
- IRENA. (2015). ‘REthinking energy: Renewable energy and climate change’. Retrieved http://www.irena.org/-/media/Files/IRENA/Agency/Publication/2015/IRENA-_REthinking_Energy_2nd_report_2015.pdf
- Islam, S., Akhter, R., & Rahman, M. A. (2017). A thorough investigation on hybrid application of biomass gasifier and PV resources to meet energy needs for a northern rural off-grid region of Bangladesh: A potential solution to replicate in rural off-grid areas or not? Energy. https://doi.org/10.1016/j.energy.2017.12.125
- Jinkosolar. (2015). Eagle 72P 320-340 Watt Poly Crystalline Module. Retrieved https://www.jinkosolar.com/uploads/5e93f9cc/Eagle JKM320-340PP-72-(V)-A3,1-EN.pdf
- Jumare, I. A., Bhandari, R., & Zerga, A. (2020). Assessment of a decentralized grid-connected photovoltaic (PV)/wind/biogas hybrid power system in northern Nigeria. Energy, Sustainability and Society, 10(1), 1–25. https://doi.org/10.1186/s13705-020-00260-7
- Junfeng, L., Runqing, H., Yanqin, S., Jingli, S., Bhattacharya, S. C., & Abdul Salam, P. (2005). Assessment of sustainable energy potential of non-plantation biomass resources in China. Biomass & Bioenergy, 29(3), 167–177. https://doi.org/10.1016/j.biombioe.2005.03.006
- Kartha, S., & Larson, E. D. (2000). Bioenergy primer: Moderinized biomass energy for sustainable development. Retrieved https://www.undp.org/sites/g/files/zskgke326/files/publications/BioenergyPrimer_2000.pdf
- Kemausuor, F., Kamp, A., Thomsen, S. T., Bensah, E. C., & Stergård, H. (2014). Assessment of biomass residue availability and bioenergy yields in Ghana. Resources, Conservation and Recycling, 86, 28–37. https://doi.org/10.1016/j.resconrec.2014.01.007
- Khan, A., & Javaid, N. (2020). Optimal sizing of a stand-alone photovoltaic, wind turbine and fuel cell systems. Computers & Electrical Engineering, 85, 106682. https://doi.org/10.1016/j.compeleceng.2020.106682
- KITE. (2008). Feasibility study report on domestic biogas in Ghana – report submitted by Kumasi Institute of Technology, Energy and Environment (KITE) to the Shell Foundation. Retrieved http://docshare02.docshare.tips/files/6185/61854332.pdf
- Kolhe, M. L., Ranaweera, K. M. I. U., & Gunawardana, A. G. B. S. (2015). Techno-economic sizing of off-grid hybrid renewable energy system for rural electrification in Sri Lanka. Sustainable Energy Technologies And Assessments, 11(2015), 53–64. https://doi.org/10.1016/j.seta.2015.03.008
- Krishan, O., & Suhag, S. (2019). Techno-economic analysis of a hybrid renewable energy system for an energy poor rural community. Journal of Energy Storage, 23(March), 305–319. https://doi.org/10.1016/j.est.2019.04.002
- Kumar, A. P. (2016). Analysis of hybrid systems: Software tools. Proceeding of IEEE - 2nd International Conference on Advances in Electrical, Electronics, Information, Communication and Bio-Informatics, IEEE - AEEICB, (pp. 327–330). https://doi.org/10.1109/AEEICB.2016.7538302
- Kumar, V., & Verma, A. (2021). Optimal techno-economic sizing of a solar-biomass-battery hybrid system for off-setting dependency on diesel generators for microgrid facilities. Journal of Energy Storage, 36(May 2020), 102251. https://doi.org/10.1016/j.est.2021.102251
- Lerch, M., De-Prada-Gil, M., Molins, C., & Benveniste, G. (2018). Sensitivity analysis on the levelized cost of energy for floating offshore wind farms. Sustainable Energy Technologies and Assessments, 30(March), 77–90. https://doi.org/10.1016/j.seta.2018.09.005
- Li, J., Liu, P., & Li, Z. (2020). Optimal design and techno-economic analysis of a solar-wind- biomass off-grid hybrid power system for remote rural electri fi cation : A case study of west China. Energy, 208, 118387. https://doi.org/10.1016/j.energy.2020.118387
- Lillo-Sánchez, L., López-Lara, G., Vera-Medina, J., Pérez-Aparicio, E., & Lillo-Bravo, I. (2021). Degradation analysis of photovoltaic modules after operating for 22 years. A case study with comparisons. Solar Energy, 222(5), 84–94. https://doi.org/10.1016/j.solener.2021.04.026
- Milbrandt, A. (2009). Assessment of biomass resources in Liberia. Retrieved https://www.nrel.gov/docs/fy09osti/44808.pdf
- Mishra, S., Panigrahi, C. K., & Kothari, D. P. (2016). Design and simulation of a solar–wind–biogas hybrid system architecture using HOMER in India. International Journal of Ambient Energy, 37(2), 184–191. https://doi.org/10.1080/01430750.2014.915886
- Mohammed, M., Egyir, I. S., Donkor, A. K., Amoah, P., Nyarko, S., Boateng, K. K., & Ziwu, C. (2017). Feasibility study for biogas integration into waste treatment plants in Ghana. Egyptian Journal of Petroleum, 26(3), 695–703. https://doi.org/10.1016/j.ejpe.2016.10.004
- Motjoadi, V., Adetunji, K. E., & Meera Joseph, P. K. (2020). Planning of a sustainable microgrid system using HOMER software. 2020 Conference on Information Communications Technology and Society, ICTAS 2020 - Proceedings, (pp. 0–4). https://doi.org/10.1109/ICTAS47918.2020.233986
- Murugaperumal, K., & Vimal, P. A. D. (2019). Feasibility design and techno-economic analysis of hybrid renewable energy system for rural electrification. Solar Energy, 188(July), 1068–1083. https://doi.org/10.1016/j.solener.2019.07.008
- Nafeh, A. E. S. A. (2011). Optimal economical sizing of a PV-wind hybrid energy system using genetic algorithm. International Journal of Green Energy, 8(1), 25–43. https://doi.org/10.1080/15435075.2010.529407
- Odoi-Yorke, F., Woenagnon, A., & Kalam, A. (2021). Techno-economic assessment of solar PV/fuel cell hybrid power system for telecom base stations in Ghana. Cogent Engineering, 8(1), 0–25. https://doi.org/10.1080/23311916.2021.1911285
- Okedu, K. E., & Uhunmwangho, R. (2014). Optimization of renewable energy efficiency using HOMER. International Journal of Renewable Energy Research, 4(2), 421–427. https://doi.org/10.1234/ijrer.v4i2.1231.g6294
- Olatomiwa, L., Mekhilef, S., Huda, A. S. N., & Ohunakin, O. S. (2015). Economic evaluation of hybrid energy systems for rural electri fi cation in six geo-political zones of Nigeria. Renewable Energy, 83(November), 435–446. https://doi.org/10.1016/j.renene.2015.04.057
- Pelizan, L., Alavi, A. R., & Lickteig, L. (2019). Solar home solutions using a pay-as-you-go model in Ghana: Exploring the opportunity. In IESE business school - University of Navarra. https://doi.org/10.15581/018.OP-319-E
- Rajbongshi, R., Borgohain, D., & Mahapatra, S. (2017). Optimization of PV-biomass-diesel and grid base hybrid energy systems for rural electri fi cation by using HOMER. Energy, 126, 461–474. https://doi.org/10.1016/j.energy.2017.03.056
- REN21. (2021). Renewables 2021 Global Status Report. Retrieved https://www.ren21.net/wp-content/uploads/2019/05/GSR2021_Full_Report.pdf
- Rinaldi, F., Moghaddampoor, F., Najafi, B., & Marchesi, R. (2020). Economic feasibility analysis and optimization of hybrid renewable energy systems for rural electrification in Peru. Clean Technologies and Environmental Policy, 23(3), 731–748. https://doi.org/10.1007/s10098-020-01906-y
- Sakah, M., Amankwah, F., Katzenbach, R., & Gyamfi, S. (2017). Towards a sustainable electrification in Ghana : A review of renewable energy deployment policies. The Indian Journal of Surgery, 79(April), 544–557. https://doi.org/10.1016/j.rser.2017.05.090
- Saleh, A., Faridun, M., Tajuddin, N., Ra, M., Azmi, A., & Ramli, M. A. M. (2019). Optimization and sensitivity analysis of standalone hybrid energy systems for rural electri fi cation : A case study of Iraq. Renewable Energy. 138(C), 775–792 . https://doi.org/10.1016/j.renene.2019.02.004
- Sanni, S. O., Ibrahim, M., Mahmud, I., Oyewole, T. O., & Olusuyi, K. O. (2019). Potential of Off-grid Solar PV/Biogas power generation system: Case study of Ado Ekiti slaughterhouse. International Journal of Renewable Energy Research, 9(3), 1309–1318. https://ijrer.com/index.php/ijrer/article/view/9559
- Sarkar, N., Ghosh, S. K., Bannerjee, S., & Aikat, K. (2012). Bioethanol production from agricultural wastes: An overview. Renewable Energy, 37(1), 19–27. https://doi.org/10.1016/j.renene.2011.06.045
- Shafiullah, G. M., & Carter, C. E. (2016). Feasibility study of photovoltaic (PV)-diesel hybrid power systems for remote networks. Proceedings of the 2015 IEEE Innovative Smart Grid Technologies - Asia, ISGT Asia 2015, November 2015. https://doi.org/10.1109/ISGT-Asia.2015.7387123
- Shen, W., Chen, X., Qiu, J., Hayward, J. A., Sayeef, S., Osman, P., Meng, K., & Dong, Z. Y. (2020). A comprehensive review of variable renewable energy levelized cost of electricity. Renewable and Sustainable Energy Reviews, 133(August), 110301. https://doi.org/10.1016/j.rser.2020.110301
- Sigarchian, S. G., Paleta, R., Malmquist, A., & Pina, A. (2015). Feasibility study of using a biogas engine as backup in a decentralized hybrid (PV/wind/battery) power generation system - Case study Kenya. Energy, 90(Part 2), 1830–1841. https://doi.org/10.1016/j.energy.2015.07.008
- Singh, S., Kanwar, N., Zindani, D., & Jadoun, V. K. (2021). Decision making approach for assessing the suitable hybrid renewable energy based microgrid system for rural electrification in India. Materials Today: Proceedings. https://doi.org/10.1016/j.matpr.2021.04.186
- Sinha, S., & Chandel, S. S. (2014). Review of software tools for hybrid renewable energy systems. Renewable and Sustainable Energy Reviews, 32(April), 192–205. https://doi.org/10.1016/j.rser.2014.01.035
- SUKA. (2020). 1.5KVA-24V Inverter. Retrieved https://suka.com.gh/ecommerce/product/axpert-1-5kva-24-inverter
- TTA. (2017). Minigrid project reference by Trama Tecnoambiental (TTA), Barcelona. Retrieved www.tta.com.es/en/electric-microgrids
- UNFCCC. (2015). Paris Agreement. Retrieved https://unfccc.int/files/essential_background/convention/application/pdf/english_paris_agreement.pdf
- United Nations. (2021). Theme Report On Energy Access: Towards The Achievement of SDG 7 and Net-Zero Emissions. Retrieved https://www.un.org/sites/un2.un.org/files/2021-twg_1-061921.pdf
- USAID. (2019). Off-Grid Solar Market Assessment: Ghana. Retrieved https://www.usaid.gov/sites/default/files/documents/1860/PAOP-Ghana-MarketAssessment-Final_508.pdf
- Vendoti, S., Muralidhar, M., & Kiranmayi, R. (2020). Techno-economic analysis of off-grid solar/wind/biogas/biomass/fuel cell/battery system for electrification in a cluster of villages by HOMER software. Environment, Development and Sustainability, 23(1), 351–372. https://doi.org/10.1007/s10668-019-00583-2
- World Bank. (2021). Access to electricity (% of Population). Retrieved https://data.worldbank.org/indicator/EG.ELC.ACCS.UR.ZS?locations=GH
- World Bank Group. (2008). The welfare impact of rural electrification : A reassessment of the costs and benefits. In International Finance. https://doi.org/10.1596/978-0-8213-7367-5.