
 ?Mathematical formulae have been encoded as MathML and are displayed in this HTML version using MathJax in order to improve their display. Uncheck the box to turn MathJax off. This feature requires Javascript. Click on a formula to zoom.
Abstract
Coronavirus (COVID-19) has captured the attention of the globe very rapidly. Therefore, predicting the spread of the disease has become an indispensable process, this is being due to its extremely infectious nature and due to the negative effects that some courses of actions, which were taken to minimize the spread of the disease, have on economy and key sectors (e.g., health, pharmaceutical and industrial sectors). Therefore, in this research work, the nonlinear autoregressive exogenous model (NARX) is developed to predict the spread of COVID-19 in Jordan by mapping the related factors (i.e. sociodemographic characteristics and government actions) to the number of confirmed COVID-19 cases in the twelve governorates in Jordan. It has been shown that the developed NARX model can predict the number of confirmed cases with a root mean square error of approximately 28. The NARX model developed in this paper can therefore lead to an efficient management of the available resources, and help decision-makers in selecting the best course of actions to minimize the spread of COVID-19.
PUBLIC INTEREST STATEMENT
Coronavirus (COVID-19) has captured the attention of the globe very rapidly. Therefore, predicting the spread of the disease has become an indispensable process, this is being due to its extremely infectious nature and due to the negative effects that some courses of actions, which were taken to minimize the spread of the disease, have on economy and key sectors (e.g., health, pharmaceutical and industrial sectors). Therefore, in this research work, the nonlinear autoregressive exogenous model (NARX) is developed to predict the spread of COVID-19 in Jordan by mapping the related factors (i.e. sociodemographic characteristics and government actions) to the number of confirmed COVID-19 cases in the twelve governorates in Jordan. It has been shown that the developed NARX model can successfully predict the number of confirmed cases. Therefore, it can lead to an efficient management of the available resources, and help decision-makers in selecting the best course of actions to minimize the spread of COVID-19.
1. Introduction
The year 2020 will go down in history as a watershed moment for mankind on this planet, this being due to the fact that Coronavirus disease 2019 (COVID-19) poses a serious and immediate danger to public health. The virus first appeared in China in December 2019 and has since rapidly spread all around the world. Due to the significant number of confirmed cases and death, COVID-19 has, therefore, been characterized as a pandemic. This has led to an emergency among the government bodies in the world in order to carefully manage the resources and deal with the epidemic at all levels to save people’s lives by enforcing actions such as travel restrictions and quarantines.
Since its first appearance in China in December 2019 (Zhou et al., Citation2020), several studies have been conducted to investigate many issues related to COVID-19 (Ardabili et al., Citation2020; Li et al., Citation2020; Rajnik et al., Citation2021; Wieczorek et al., Citation2020; Zhou et al., Citation2020). In general such research papers have focused on (i) identifying and characterizing the new virus; (ii) identifying the etiology of the virus and the main clinical symptoms; (iii) defining the virus’s effects on many sectors such as education, economy and health; and (iv) predicting the spread of the virus and its different variants as well as estimating its intensity and mortality rate. The modelling paradigms that have been developed and employed to predict the spread of COVID-19 have their strengths and limitations. Therefore, eliciting the most appropriate paradigm depends on the data available and the factors that should be considered. In this research work, the main aim is to predict the spread of COVID-19 in Jordan. Indeed, achieving such an aim is not a trivial task, this being due to the many non-measurable factors that may have considerable and, perhaps, conflicting effects. To illustrate, the different sociodemographic characteristics, habits, traditions and social values of the different 12 governorates in Jordan have indeed affected the spread of the disease and its intensity. Therefore, in this research work, the nonlinear autoregressive exogenous model (NARX), as a recurrent dynamic feedback neural network, is developed to predict the spread of COVID-19 in Jordan taken into account various factors including, for example, the government strategies that have been taken to control the spread of the disease and factors related to the different sociodemographic characteristics, habits, traditions and social values of the different governorates in Jordan. The rest of the paper is organized as follows: A summary of the related research papers is provided in Section 2. Data that have been provided and collected using an online survey are discussed in Section 3. In Section 4, the theoretical background of the NARX model is presented. The development of the predictive NARX model, the results obtained and comparative studies are summarized and discussed in Section 5, whereas Section 6 concludes the whole paper and presents some future pointers of the research. Finally, the practical implications are briefly summarized in Section 7.
2. Literature review
Several studies have been conducted to investigate many issues related to COVID-19 (Ardabili et al., Citation2020; Li et al., Citation2020; Rajnik et al., Citation2021; Wieczorek et al., Citation2020; Zhou et al., Citation2020). Some research papers have focused on identifying and characterizing the new virus. For instance, COVID-19 was characterized using full-length genome sequences and it was found that such sequences are 96% identical to the ones in bat coronavirus (Zhou et al., Citation2020). In addition, some research papers have been devoted to identifying the etiology of the virus and the main clinical symptoms (Elibol, Citation2021; Wang et al., Citation2020; Zhou et al., Citation2020). For example, various clinical symptoms that include, but are not limited to, fever, expectoration, dyspnea, headache or dizziness, diarrhea, nausea and vomiting were reported in a study that was conducted on 1995 patients (Zhou et al., Citation2020). Moreover, neurological symptoms such as cerebral haemorrhage and infarction were reported in a study that was conducted on 214 patients with COVID-19 (Wang et al., Citation2020). In addition, an algorithm was presented to employ x-rays to automatically diagnose those who were infected by COVID-19 (Almalki et al., Citation2021). Likewise, some research efforts have been directed towards defining the virus’s effects on many sectors such as education, economy and health. For instance, educational institutions in approximately 188 countries until 6 April 2020 were affected by COVID-19 (Toquero, Citation2020). Such institutions turned to the distance education system (i.e. online learning) in order to maintain the educational services during closures and lockdowns (Mahmut, Citation2020). Such a system resulted in many opportunities and challenges that educational institutions need to consider to update curriculums not only during the pandemic but also in the future to cope well with any uncertainties (Toquero, Citation2020).
In addition to the research work mentioned above, a considerable number of research papers has been directed towards predicting the spread of the virus and its different variants as well as estimating its intensity and mortality rate (Anastassopoulou et al., Citation2020; Zhao et al., Citation2020). Compartmental models such as the Susceptible, Infected Recovered (SIR) and the Susceptible, Exposed, Infected and Recovered (SEIR) models have been extensively utilized to predict the number of COVID-19 cases and estimate the mortality rate (Anastassopoulou et al., Citation2020; Dil et al., Citation2020; Fanelli & Piazza, Citation2020; Zhao et al., Citation2020). For example, the SIR model was adapted to the South Africa case by considering various scenarios of the reproduction number to predict the COVID-19 cases and estimate the required healthcare resources (Mbuvha & Marwala, Citation2020). Such a model was also employed to simulate the dynamic behaviour of the disease across major cities in China (Wu et al., Citation2020). Likewise, the SIRD model was employed to provide estimates of the basic epidemiological parameters in order to forecast the evolution of COVID-19 (Anastassopoulou et al., Citation2020). Mathematical approaches that include simple moving average (SMA) and autoregressive integrated moving average (ARIMA) have also been utilized to predict short-term cases (Ahmar & Del Val, Citation2020). For instance, the SutteARIMA approach was developed to predict the short-term cases of COVID-19. Based on the values of the mean absolute percentage error, it was found that such an approach was more reliable in predicting the daily cases when compared to the ARIMA approach (Ahmar & Del Val, Citation2020). Likewise, different growth models (e.g., a logistic growth model) were adapted to generate forecasts of the reported cases (Ahmadi et al., Citation2020; Roosa et al., Citation2020). Various artificial intelligence paradigms have also been employed to predict the COVID-19 cases and the mortality rate by taking into account different parameters that may affect the number of cases (Al-Qaness et al., Citation2020; Salgotra et al., Citation2020). For example, the evolutionary genetic algorithm was employed to develop two models to predict the number of COVID-19 cases in India (Salgotra et al., Citation2020). In addition, an Adaptive Neuro-Fuzzy Inference System (ANFIS) was presented to estimate the number of confirmed cases in China. The parameters of such a model were determined using the hybrid algorithm integrating the flower pollination and salp swarm algorithms (Al-Qaness et al., Citation2020). Also, an autoencoder was designed to predict the spread of COVID-19 in China (Hu et al., Citation2020). In addition, hybrid deep neural networks were presented to predict the risks in patients infected by COVID-19 (Irfan et al., Citation2021).
The modelling paradigms that have been developed and employed to predict the spread of COVID-19 have their strengths and limitations. For instance, some of these models (e.g., SIR and SEIR) are considered to be deterministic models that require a large population. However, they can show the influence of health interventions on the outcome of the pandemic (Rahimi, Gandomi et al., Citation2021). Although they are based on the intelligent search, other models (e.g., genetic algorithm) depend on their parameters that are usually provided by decision-makers (Rahimi, Gandomi et al., Citation2021). In addition, some models (e.g., ARIMA) are considered to be unstable as the models change when the observations change (Rahimi, Chen et al., Citation2021). Since paradigms, in general, have their strengths and limitations, eliciting the most appropriate paradigm would highly depend on (i) the data available, (ii) the factors and the parameters that need to be taken into account, and (iii) the stability of the model. In this research work, the main aim is to predict the spread of COVID-19 in Jordan. Indeed, achieving such an aim is not a trivial task, this being due to the many non-measurable factors that may have considerable and, perhaps, conflicting effects. To illustrate, the different sociodemographic characteristics, habits, traditions and social values of the different 12 governorates in Jordan have indeed affected the spread of the disease and its intensity. Therefore, in this research work, the NARX is developed to predict the spread of COVID-19 in Jordan taken into account various factors including, for example, the government strategies, habits, traditions and social values of the different governorates in Jordan.
3. Data collection
Several parameters relating to the spread of COVID-19 in Jordan were defined. Defining such parameters was based on an intensified reading of related literature and expert knowledge via structured meetings. The parameters were classified into four main categories, namely, primary parameters, social characteristics, lockdown status, and sector status, as summarized in .
Table 1. The parameters that affect the spread of COVID-19 in Jordan.
The main data source for this study was The National Centre for Security and Crisis Management (NCSCM) in Jordan which has reported the issues related to COVID-19 in Jordan on its official website. The parameters that are obtained from the NCSCM are (i) number of daily and positive tests; (ii) population of the governorates, (iii) lockdown hours in the different governorates; and (iv) sectors status (i.e. religious, entertainment and educational sectors). It is worth emphasizing at this stage that the data collected from the NCSCM was from 1 December 2020 till 21 May 2021. In order to collect and quantify the parameters that relate to the social characteristics, a survey was conducted and distributed online to the twelve governorates. It is worth mentioning that the conducted survey consisted of 13 questions related to the 6 parameters of the social characteristics category. Such questions are listed in . In order to make sure that the sample of the participants (a total of 2867 participants) who completed the online survey is representative to the Jordanian population, demographic information such as gender, age, place of residence and educational level, were also collected via the online survey. For instance, shows the distribution of the participants by the geographic location. It is noticeable that the percentages shown reflect the population of the governorates. To illustrate, Amman, as the capital of Jordan, has approximately half of the Jordan population.
Figure 1. The distribution of the survey participants by the geographic location.
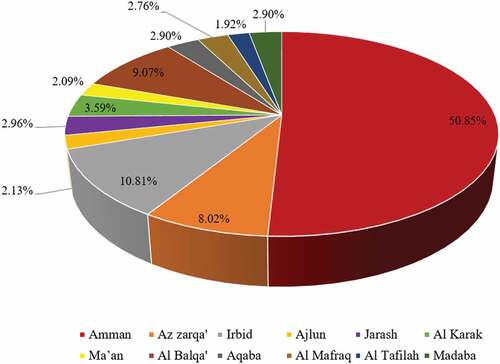
Table 2. The questions related to the 6 parameters of the social characteristics category.
4. The nonlinear autoregressive exogenous model
Due to the advancement in computing power, computational intelligence has recently found its way into many areas such as pharmaceuticals, warehouses and logistics, and medicine (AlAlaween et al., Citation2021, Citation2018, Citation2017). In such areas, data-driven models are, in general, developed as a replacement or complement of physical models that may not exist or be too complex to be designed and implemented (AlAlaween et al., Citation2021). Among the various data-driven models presented in the related literature, Artificial Neural Networks (ANNs), as models that simulate the human biological neural system, have been utilized for clustering, pattern recognition and function approximation and prediction. The type of the ANNs to be elicited depends on the prior knowledge of the case/process under investigation. In medicine, in particular, in predicting the spread of a disease such as the COVID-19, the difficulty of predicting the spread of a virus stems from the need to (i) represent highly nonlinear behaviours; (ii) consider the dynamic nature of such a case; and (iii) take into account many epidemiological, environmental and sociodemographic variables. Therefore, in this research paper, a nonlinear autoregressive exogenous model (NARX), as a recurrent dynamic feedback neural network with exogenous inputs, is employed in order to develop a predictive model for the spread of COVID-19.
depicts the schematic architecture of the NARX neural network. Such a model commonly consists of three layers: input, hidden and output layers. Each layer consists of a number of neurons. Such a number depends on the case under investigation and the predictive performance. To illustrate, the numbers of the neurons in the input and the output layers depend on the number of inputs and outputs and the delay in the case examined, whereas the number of the neurons in the hidden layer is usually the number that leads to the maximum predictive performance (i.e. minimum error value). It is worth mentioning at this stage that more than one hidden layer can be used depending on the complexity of the case under examination and the amount of data available. In general, the mapping between the inputs and outputs can be performed through the transfer functions defined in the hidden and output layers. Different types of transfer functions can be employed (Bishop, Citation2006). In this research work, sigmoid and linear transfer functions were employed in the hidden and output layers, respectively.
Figure 2. The schematic architecture of the NARX neural network.
The network commonly determines the predicted output (y (t + 1)) by using the present and the previous values of the inputs and the outputs. Such a determination of the output taken place in the NARX model can be mathematically represented as follows:
where xn(t), …, xn(t-dx) represent the exogenous n inputs and y(t), …, y(t-dy) represent the previous outputs. The NARX usually predicts the output in a recurrent fashion, where the predicted output is returned to the model as an input for the value of dy in order to be utilized to predict the next value of the output.
5. Results and discussion
5.1. Implementation and results: the nonlinear autoregressive exogenous model
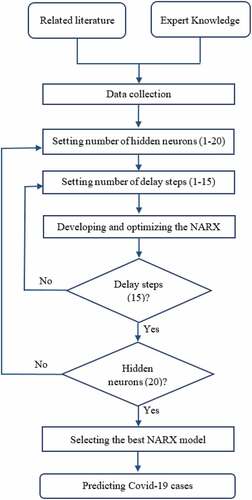
In order to predict the spread of COVID-19 in Jordan, the NARX model was developed, as shown in . The data provided and collected as explained in Section 2 were divided randomly into three sets: training (70%), validation (15%) and testing (15%) sets. In general, the training set is utilized to learn the relationships between the inputs and the output, and to adjust the model parameters, accordingly, while the validation set is usually employed to assess the model generalization capabilities and, thus, to halt the training when such a set performance stops improving. The testing set is commonly used to assess the model reliably by estimating the model performance using such a set which is kept hidden during the development of the model. During the development of the NARX model, different numbers of hidden neurons and delay steps in the ranges of 1 to 20 and 1 to 15, respectively, were utilized. The numbers of hidden neurons and delay steps that were finally selected were the ones that led to the best predictive performance, in other words, they were the ones that led to the minimum error residuals between the predicted and the actual number of COVID-19 cases. It is worth mentioning at this stage that the error was represented by the root mean square error (RMSE). For specific numbers of hidden neurons and delay steps, the NARX parameters (i.e. weights between the layers) were initialized randomly. Then, they were optimized by utilizing the scaled conjugate gradient algorithm integrated with the adaptive back-propagation network (Bishop, Citation2006).
Figure 3. The flowchart of the NARX model development.
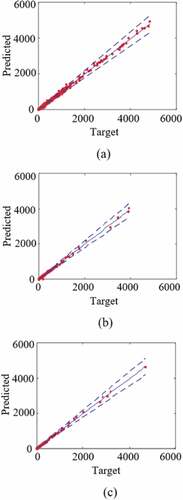
For 10 hidden neurons and 14 delay steps, the best NARX performance for the training, validation and testing sets is presented in , where the RMSE (training, validation, testing) is (29.5, 27.6, 22.8). It is noticeable that the RMSE value for the training set is approximately 24% higher than that for the testing set, this may be an indication of overtraining case. However, this is not the case in this research work, as such a difference is attributed to the number of confirmed cases. To illustrate, several points with greater than 4000 confirmed cases are shown in the training set, whereas only one point out of 309 with greater than 4000 confirmed cases is shown in the testing set. This can be the reason behind the higher value of the RMSE for the training. Such a case can be demonstrated by the coefficient of determination values (R2) for the training, validation and testing which are 0.971, 0.968 and 0.976, respectively. It is also noticeable in that the majority of the predicted values lay within the 90% confidence interval. However, some of the points with a relatively small number of confirmed cases do not lay within the 90% confidence interval, however, the error can be negligible. For example, on 29 January 2021 the actual number of confirmed cases in Ajloun was 3 and the predicted value was 2.4. Thus, such a point was not within the 90% confidence interval; however, the error can be negligible.
Figure 4. The prediction performance of the NARX model: (a) Training set, (b) Validation set, and (c) Testing set.
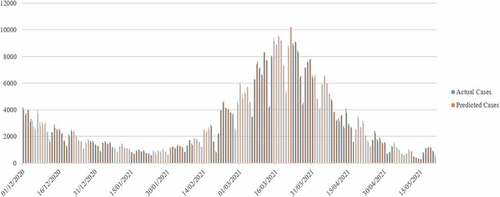
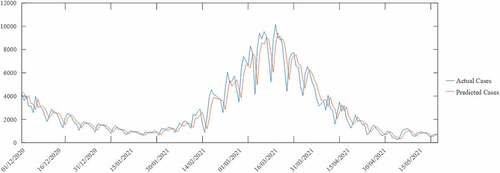
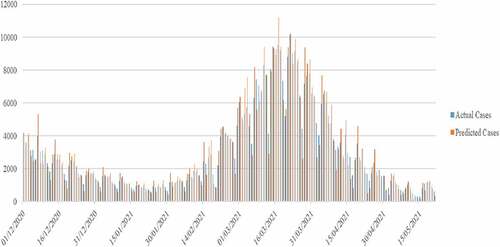
shows the time-series response for the numbers of actual and the predicted COVID-19 cases using the NARX model for all the governorates in Jordan from 1 December 2020 till 21 May 2021. It is noticeable that the model was able to predict the number of COVID-19 cases successfully, where the model was able to understand the behaviour of the second wave that Jordan witnessed in March 2021. In addition, the model was able to consider the relatively low number of cases on Fridays where a lockdown was imposed by the government. Although the model was able to understand the behaviour of the second wave successfully, the difference between the number of the actual and predicted COVID-19 cases needs to be carefully considered by taking into account hospitals’ capacity. For instance, on 1 March 2021 the actual number of confirmed cases in Amman only, which has a population of approximately 4,430,700 inhabitants, was 3526 and the predicted value was 3351. The predicted error value is approximately 175 and the corresponding error percentage is less than 5%, in other words, the point is within the 90% confidence interval as shown in . However, such an error value needs to be carefully considered, in particular, when the hospitals in such a governorate are full.
Figure 5. The time-series response for the numbers of actual and predicted COVID-19 cases in Jordan using the NARX model.
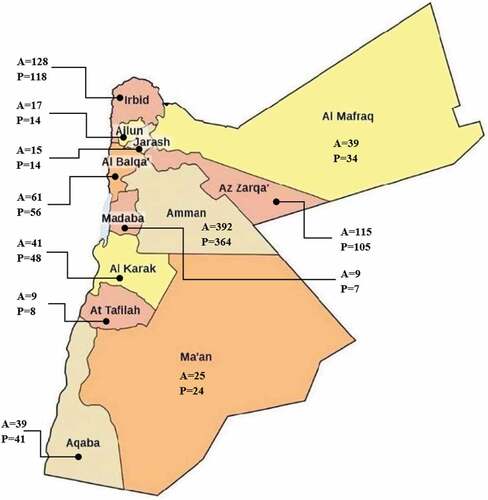
In order to show the effectiveness of the NARX model in predicting the number of COVID-19 cases in Jordan, the model developed was employed to predict the number of cases from May 22 till June 1, of 2021, such a data set is a new one as it was not used during the development of the model. shows the performance of the NARX model for the new data, where the RMSE and the R2 values are is 8.6 and 0.975, respectively. It is noticeable that the RMSE value for the new data set is approximately three times lower than the values obtained for the training, validation and testing sets, as presented above. This can be attributed to the number of COVID-19 cases in the period selected, where the values were less than 400 cases. shows the actual and the predicted numbers of COVID-19 cases for the 12 governorates in Jordan on 24 May 2021 as an example. It is noticeable that the predicted values are close to the actual ones. In addition, it is also apparent that Amman has the highest number of cases, this being due to the fact that it has a population of approximately 4,430,700 inhabitants. Whereas, Madaba and At Tafilah have the lowest number of cases.
Figure 6. The predictive performance for the new data using the NARX.
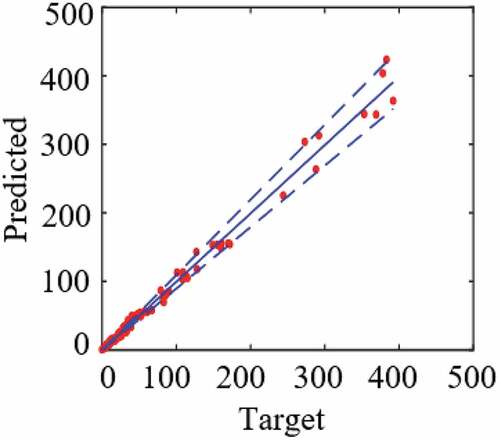
Figure 7. An example of the actual (A) and the predicted (P) numbers of COVID-19 cases for the 12 governorates in Jordan on May 24th of 2021.
In summary, the NARX model presented in this research work was able not only to predict the number of confirmed COVID-19 cases successfully but also to understand the behaviour of the second wave Jordan witnessed in March, 2021. This can be attributed to the ability of taking into account (i) many non-measurable factors that may have considerable and, perhaps, conflicting effects on the spread of COVID-19 in Jordan; and (ii) the different sociodemographic characteristics, habits, traditions and social values of the different 12 governorates in Jordan which indeed affected the spread of the disease and its intensity. In the future, such a model can also be adapted to predict the start of any other wave by considering the number of cases in the world, in particular, the UK and Europe. As the second wave in Jordan started after the second wave in Europe and the UK, this being due to the number of people who travel to/from these areas. In addition, the model should be adapted to consider the number of people who took the vaccine.
5.2. Comparative studies
For comparison purposes, various mathematical approaches were utilized in this research work to predict the number of COVID-19 cases in Jordan. Because of their efficiencies, ARIMA and long short-term memory (LSTM) were employed to predict the number of COVID-19 cases in Jordan. shows the time-series response for the numbers of actual and the predicted COVID-19 cases using the ARIMA model for all the governorates in Jordan from 1 December 2020 till 21 May 2021. It is noticeable that the ARIMA was able to predict the number of COVID-19 cases when the numbers of cases were relatively small and stable. However, the error residuals were relatively high when the numbers of cases were considerable. This can negatively affect the efficient management of the available resources, in particular, the health ones. It is also noticeable that the ARIMA model took few days to adapt to the changes in the number of COVID-19 cases, in particular, during the second wave. In addition, such a model was not able to take into consideration epidemiological, environmental and sociodemographic variables for the different 12 governorates in Jordan.
Figure 8. The time-series response for the numbers of actual and predicted COVID-19 cases in Jordan using the ARIMA model.
The LSTM model, as an artificial recurrent neural network was also developed in this research work to predict the number of COVID-19 cases in Jordan. The data were divided randomly into three sets: training (70%), validation (15%) and testing (15%) sets. During the development of the LSTM model, different numbers of hidden neurons and delay steps in the ranges of 1 to 20 and 1 to 15, respectively, were utilized. The numbers of hidden neurons and delay steps that were finally selected were the ones that led to the best predictive performance. For 10 hidden neurons and 2 delay steps, shows the time-series response for the numbers of actual and the predicted COVID-19 cases using the LSTM model for all the governorates in Jordan from 1 December 2020 till 21 May 2021. It is noticeable that the model overestimated the number of COVID-19 cases during the second wave, while it underestimated the number of cases at the end of the second wave.
Figure 9. The time-series response for the numbers of actual and predicted COVID-19 cases in Jordan using the LSTM model.
summarizes the overall statistical performance measures represented by the values of the RMSE, R2 and R2 adjusted for the NARX, ARIMA and LSTM models for all the governorates in Jordan from 1 December 2020 till 21 May 2021. It is apparent that the developed NARX model outperformed the ARIMA and the LSTM models by an overall performance of 2.79 and 2.97 in the RMSE, respectively. This can be attributed to the ability of the NARX model to represent highly nonlinear and dynamic behaviours and to consider the epidemiological, environmental and sociodemographic variables. It is worth mentioning that the values of the RMSE for the ARIMA and LSTM models represent less than 10% of the actual number of COVID-19 cases which is in the range of 276 to 10,153. It is also noticeable that the performance measures of the ARIMA model are slightly better than the ones of the LSTM model.
Table 3. The overall predictive performance of the models
6. Conclusions
In this research paper, a nonlinear autoregressive exogenous (NARX) model was developed in order to predict the spread of COVID-19 in Jordan. Various parameters such as the sociodemographic characteristics and government actions were successfully mapped to the number of COVID-19 confirmed cases employing the NARX. It is worth mentioning that the required data were collected from related literature, expert knowledge via structured meetings, The National Centre for Security and Crisis Management (NCSCM) in Jordan, and a conducted survey. Validated on new data set that consists of the data for 11 days, it was found that the model was able to predict the number of COVID-19 confirmed cases in the 12 governorates of Jordan. Furthermore, the NARX model developed in this paper can (i) lead to an efficient management of the available resources, in particular, the health ones; and (ii) help decision-makers in selecting the best course of actions that need to be taken in the different governorates to minimize the spread of COVID-19. Since the number of COVID-19 cases in the world was not considered in the NARX model developed, such a model can be adapted in the future to predict the start of any other wave by considering the number of cases in the world. In addition, the number of people who took the vaccine was not considered in this model. Therefore, it is advantageous to consider such a number in an adaptive model.
7. Practice implications
A nonlinear autoregressive exogenous (NARX) model can be employed to predict the spread of COVID-19 in Jordan. The best course of actions that minimize the spread of COVID-19 can be selected for each governorate in Jordan. The available resources, in particular, the health ones can be efficiently managed. Thus, health and wellbeing can be significantly improved.
correction
This article has been republished with minor changes. These changes do not impact the academic content of the article.
Acknowledgements
The authors wish to thank King Abdullah II Fund for Development (KAFD) and Jordan Design and Development Bureau (JODDB) for the financial and technical support under Grant 6/2021. The authors also wish to thank The National Centre for Security and Crisis Management (NCSCM) in Jordan for providing the required data and for their support.
Disclosure statement
No potential conflict of interest was reported by the author(s).
Additional information
Funding
Notes on contributors
Wafa’ H. AlAlaween
Wafa’ H. AlAlaween is currently an Assistant Professor at The University of Jordan. She received the PhD degree from The University of Sheffield, UK in 2018, and since then she has been teaching various courses related to artificial intelligence and deterministic and stochastic optimization. Her research interests include artificial intelligence, biologically inspired computing and optimization, and fuzzy and neural fuzzy systems in various applications including manufacturing, pharmaceuticals as well as healthcare. She has published many research papers in reputable journals and conferences. She has been recently working on various funded projects. One of these projects aims at developing a systems-engineering model based on artificial computing to predict the spread of COVID-19 in Jordan by taking into consideration the sociodemographic characteristics and government actions. Such a project has been performed by a number of undergraduate students at The Department of Industrial Engineering and under the direct supervision of Dr. AlAlaween.
References
- Ahmadi, M., Sharifi, A., Dorosti, S., Ghoushchi, S. J., & Ghanbari, N. (2020). Investigation of effective climatology parameters on COVID-19 outbreak in Iran. Science of the Total Environment, 729, 138705. https://doi.org/10.1016/j.scitotenv.2020.138705
- Ahmar, A. S., & Del Val, E. B. (2020). SutteARIMA: Short-term forecasting method, a case: Covid-19 and stock market in Spain. Science of the Total Environment, 729, 138883. https://doi.org/10.1016/j.scitotenv.2020.138883
- Al-Qaness, M. A., Ewees, A. A., Fan, H., & Abd El Aziz, M. (2020). Optimization method for forecasting confirmed cases of COVID-19 in China. Journal of Clinical Medicine, 9(3), 674. https://doi.org/10.3390/jcm9030674
- AlAlaween, W. H., AlAlawin, A. H., Al-Durgham, L., & Albashabsheh, N. T. (2021). A new integrated modelling architecture based on the concept of the fuzzy logic for the turning process. Journal of Intelligent & Fuzzy Systems, 41(1), 655–15. https://doi.org/10.3233/JIFS-202457
- AlAlaween, W. H., Khorsheed, B., Mahfouf, M., Gabbott, I., Reynolds, G. K., & Salman, A. D. (2018). Transparent predictive modelling of the twin screw granulation process using a compensated interval type-2 fuzzy system. European Journal of Pharmaceutics and Biopharmaceutics, 124, 138–146. https://doi.org/10.1016/j.ejpb.2017.12.015
- AlAlaween, W. H., Mahfouf, M., & Salman, A. D. (2017). Integrating the physics with data analytics for the hybrid modeling of the granulation process. AIChE Journal, 63(11), 4761–4773. https://doi.org/10.1002/aic.15831
- Almalki,Y.E., Qayyum,A., Irfan,M., Haider,N., Glowacz,A., Alshehri,F.M., & Alduraibi,A. (2021). A Novel Method for COVID-19 Diagnosis Using Artificial Intelligence in Chest X-ray Images. In Healthcare, 9(5), 522. Multidisciplinary Digital Publishing Institute.
- Anastassopoulou,C., Russo,L., Tsakris, A., & Siettos, C. (2020). Data-based analysis, modelling and forecasting of the COVID-19 outbreak. PloS one, 15(3), 0230405. https://doi.org/10.1371/journal.pone.0230405
- Ardabili, S. F., Mosavi, A., Ghamisi, P., Ferdinand, F., Varkonyi-Koczy,A. R., Reuter,U., Atkinson, P. M., & Atkinson, P. M. (2020). Covid-19 outbreak prediction with machine learning. Algorithms, 13(10), 249. https://doi.org/10.3390/a13100249
- Bishop, C. M. (2006). Pattern recognition. Machine Learning, 128(9), 225–284. http://research.microsoft.com/∼cmbishop/PRML
- Dil, S., Dil, N., & Maken, Z. H. (2020). COVID-19 trends and forecast in the eastern mediterranean region with a particular focus on Pakistan. Cureus, 12(6). https://doi.org/10.7759/cureus.8582
- Elibol, E. (2021). Otolaryngological symptoms in COVID-19. European Archives of Oto-Rhino-Laryngology,278(4), 1233–1236. https://doi.org/10.1007/s00405-020-06319-7
- Fanelli, D., & Piazza, F. (2020). Analysis and forecast of COVID-19 spreading in China, Italy and France. Chaos, Solitons, and Fractals, 134, 109761. https://doi.org/10.1016/j.chaos.2020.109761
- Hu, Z., Ge, Q., Li, S., Jin, L., & Xiong, M. (2020). Artificial intelligence forecasting of covid-19 in China. arXiv preprint arXiv:2002.07112, 6(1), 71–94. https://doi.org/10.18562/IJEE.054
- Irfan, M., Iftikhar, M. A., Yasin, S., Draz, U., Ali, T., Hussain, S., Glowacz, A., Alwadie, A. S., Rahman, S., Glowacz, A., & Althobiani, F. (2021). Role of hybrid deep neural networks (HDNNs), computed tomography, and chest x-rays for the detection of COVID-19. International Journal of Environmental Research and Public Health, 18(6), 3056. https://doi.org/10.3390/ijerph18063056
- Li, L. Q., Huang, T., Wang, Y. Q., Wang, Z. P., Liang, Y., Huang, T. B., & Wang, Y. (2020). COVID‐19 patients’ clinical characteristics, discharge rate, and fatality rate of meta‐analysis. Journal of Medical Virology, 92(6), 577–583. https://doi.org/10.1002/jmv.25757
- Mahmut, Ö. (2020). Educational policy actions by the ministry of national education in the times of COVID-19 pandemic in Turkey. Kastamonu Egitim Dergisi, 28(3), 1124–1129. https://doi.org/10.24106/kefdergi.722280
- Mbuvha, R. R., & Marwala, T. (2020). On data-driven management of the COVID-19 outbreak in South Africa. medRxiv. https://doi.org/10.1101/2020.04.07.20057133
- Rahimi, I., Chen, F., & Gandomi, A. H. (2021). A review on COVID-19 forecasting models. Neural Computing & Applications, 1–11. https://doi.org/10.1007/s00521-020-05626-8
- Rahimi, I., Gandomi, A. H., Asteris, P. G., & Chen, F. (2021). Analysis and prediction of COVID-19 using SIR, SEIQR and machine learning models: Australia, Italy and UK Cases. Information, 12(3), 109. https://doi.org/10.3390/info12030109
- Rajnik, M., Cascella, M., Cuomo, A., Dulebohn, S. C., & Di Napoli, R. (2021). Features, Evaluation, and Treatment of Coronavirus (COVID-19). StatPearls.
- Roosa, K., Lee, Y., Luo, R., Kirpich, A., Rothenberg, R., Hyman, J., Chowell, G. B., & Chowell, G. (2020). Real-time forecasts of the COVID-19 epidemic in China from February 5th to February 24th, 2020. Infectious Disease Modelling, 5, 256–263. https://doi.org/10.1016/j.idm.2020.02.002
- Salgotra, R., Gandomi, M., & Gandomi, A. H. (2020). Time series analysis and forecast of the COVID-19 pandemic in India using genetic programming. Chaos, Solitons, and Fractals, 138, 109945. https://doi.org/10.1016/j.chaos.2020.109945
- Toquero, C. M. (2020). Challenges and opportunities for higher education amid the COVID-19 pandemic: The Philippine context. Pedagogical Research, 5(4), 5(4), https://doi.org/10.29333/pr/7947
- Wang, H.-Y., Li, X.-L., Yan, Z.-R., Sun, X.-P., Han, J., & Zhang, B.-W. (2020). Potential neurological symptoms of COVID-19. Therapeutic Advances in Neurological Disorders, 13, 1756286420917830. https://doi.org/10.1177/1756286420917830
- Wieczorek, M., Siłka, J., & Woźniak, M. (2020). Neural network powered COVID-19 spread forecasting model. Chaos, Solitons, and Fractals, 140, 110203. https://doi.org/10.1016/j.chaos.2020.110203
- Wu, Y., Xu, X., Yang, L., Liu, C., & Yang, C. (2020). Nervous system damage after COVID-19 infection: Presence or absence?. Brain, Behavior, and Immunity, 87, 55. https://doi.org/10.1016/j.bbi.2020.04.043
- Zhao, C., Tepekule, B., Criscuolo, N. G., Wendel-Garcia, P. D., Hilty, M. P., Fumeaux, T., & Van Boeckel, T. P. (2020). icumonitoring. ch: A platform for short-term forecasting of intensive care unit occupancy during the COVID-19 epidemic in Switzerland. Swiss Medical Weekly, 150, 20277. https://doi.org/10.3929/ethz-b-000415258
- Zhou, P., Yang, X.-L., Wang, X.-G., Hu, B., Zhang, L., Zhang, W., & Huang, C.-L. (2020). A pneumonia outbreak associated with a new coronavirus of probable bat origin. nature, 579(7798), 270–273. https://doi.org/10.1038/s41586-020-2012-7