
 ?Mathematical formulae have been encoded as MathML and are displayed in this HTML version using MathJax in order to improve their display. Uncheck the box to turn MathJax off. This feature requires Javascript. Click on a formula to zoom.
Abstract
This paper presents the design of an ELC to control the frequency of the MHPP for a purely resistive unbalanced 3-phase load. This is necessary since most of the researches done on ELC in MHPPs considered the design using balanced 3-phase load. However, in real world the 3-phase load at each phase varies due to the different consumers connected to each phase. In this work, a fuzzy-PI controller was designed to reduce the steady state error of the frequency variations and also optimize the gains of the conventional PI controller. These gains were then used to generate equivalent Pulse Width Modulation (PWM) signals to control the firing of Insulated Gate Bipolar Transistors (IGBTs) to dump excess power to the damper loads when the consumer loads change to maintain the power at the generator output constant. Simulation results of the MHPP under varying unbalanced loads showed that the designed ELC was efficient in maintaining the frequency of the MHPP at 50 Hz with a tolerance of ±2. The ELC also maintained the output power of the generator by ensuring the balance of power between the consumer and damper loads.
Public Interest Statement
Micro Hydro Power Plants (MHPPs) are widely used in remote areas for power generation due to their economic advantages coupled with their simple and easy construction. However, like any other power system, MHPP mostly suffers frequency and voltage instability due to varying consumer loads. Again, as a cost-effective solution to control the instabilities, there have been the introduction of Electronic Load Controllers (ELCs) and Automatic Voltage Controllers (AVCs) to control frequency and voltage, respectively. This paper describes the former. It explains how ELC is used to control frequency by maintaining the output of generator constant regardless of varying consumer loads. It mainly addressed the challenge of application of ELC to 3-phase varying resistive loads. This paper designed an ELC using MATLAB/Simulink software and simulated the generator on a 3-phase varying resistive loads. The results showed that the ELC was able to control the frequency under varying conditions of the 3-phase resistive loads.
1. Introduction
Electrical power generation has been a great contributor towards the economic growth of a nation. Concerns over high cost and rapid depletion of fossil fuel have led to the developments of other alternative sources to power generation. Among such new developments are the solar and hydro energy. Solar energy lags behind hydropower due to its dependency on weather conditions. Within hydro energy, cost-effective developments have been made to provide power to rural communities that are not connected to the national grid due to farther locations of those communities. One of such development is the Micro Hydro Power Plant systems (MHPPs). MHPP is a kind of a hydropower system that produces power in the range of 5 kW-100 kW from runoffs of rivers (Anaza et al., Citation2017, 5–12). In operation, the potential energy of the falling water is converted to mechanical energy by the turbines that in turn convert from mechanical energy to electrical energy using the synchronous generators. Considering no losses in the system, the total available power through the turbine can be defined in terms of the product of water head and flow as shown in equation
where, = output power or potential from flowing water (W);
= flow rate in the pipe (m3/s);
= water head (m);
= gravitational constant (9.81 m/s);
= density of water (1000 kg/m3),
= efficiency of the turbine.
Since MHPPs are small-sized type of hydro-power plant system, they do not require the construction of expensive dams and so this cuts down the overall cost. Moreover, due to its small size, it is easily deployed and require less maintenance unlike the large hydro-power plants and are generally used to power homes and small industries isolated from the national grid. However, just like any other power system, the MHPP has a major drawback in terms of power quality. Synchronous generators that are used, have poor frequency regulation as a result of the varying load conditions by the consumers. When the consumer loads decreases, the frequency increases, which causes the rotor of the generator to rotate at a high speed (Ofosu et al., Citation2019, 13–20). This speed can result in damage of the rotor or any other component connected to the generator. Contrastingly, an increase in consumer load can cause the frequency to decrease, which can also cause damage to consumer loads, especially machines that operates under a fixed frequency.
These drawbacks have resulted in the implementation of speed governors, to control the frequency by regulating the flow of water to the turbine based on the load variations. However, this method of control has over the years been seen as expensive and require frequent maintenance. As a result, Electronic Load Controllers (ELCs) which are cost effective have been used to replace the speed governors. An ELC is an electronic device used to control the output power and hence the frequency of a MHPP system by maintaining a near constant load on the generator. It therefore acts as an electronic governor to regulate the frequency of a generator. The ELC works based on the principle explained mathematically by Equationequation (2)(2)
(2) .
where; = power generated (W);
= power dissipated through damper load (W),
= power consumed by consumers (W).
It is observed from Equationequation (2)(2)
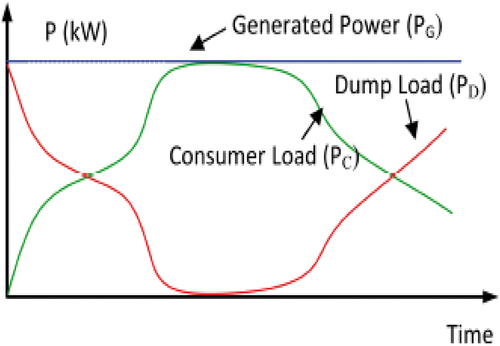
(2) that, the power generated is equal to the summation of dissipated power by damper loads and power used by consumers. Additionally, Figure (Nan & Aung, Citation2015, 6–12) shows that as
increases,
also decreases to maintain the generated power at a constant value.
Figure 1. Power response of an ELC.
Several research works have been reported in the literature regarding the development of ELC to control the frequency of MHPP. Notable amongst them are using phase angle control, binary load configuration, PWM control and mark-to-space ratio control method. Erika et al. (Citation2013) designed an ELC consisting of six series-arranged ballast loads to divert excess power to maintain frequency and power output of a single-phase permanent magnet generator. Ponnam et al. (Citation2014) designed an ELC for frequency control of self-excited induction generator using fuzzy and PI controllers. In their work, an independent PWM signal without a controller was used to control switches to 3-phase balanced ballast loads. Raj and Kumar (Citation2014) investigated the robustness of self-excited induction generators under 3-phase linear and non-linear loads using phase angle technique with Fuzzy-PID strategy to control frequency. Yadav et al. (Citation2015) implemented an ELC to control the frequency of synchronous generator using a closed loop PWM generator. However, their work did not consider the use of a controller to check steady state error of frequencies. Clark et al. (Citation2016) conducted phase angle, PWM, mark-to-space ratio and binary control methods for controlling frequency of a single-phase synchronous generator. Ofosu et al. (Citation2016) implemented a BFA optimized fuzzy ELC to control frequency of an MHPP with 3-phase balanced loads.
By comparing a PWM wave with the output of PI controller, Sanampudi and Kanakasabapathy (Citation2020), controlled the switching of chopper to dump surplus power through ballast loads. This was used in controlling frequency and voltage of 3-phase synchronous generator connected to balanced loads. Karmakar (Citation2020) designed an ANN-built ELC using the Scaled Conjugate Gradient (SCG) and Bayesian Regularization (BR) algorithms. The performance of these methods was studied and compared with conventional PI controller during the frequency control of Self-Excited Induction Generator (SEIG) feeding single-phase loads. Chaurasia et al. (Citation2020) developed an ELC to control the performance of SEIG on varying load conditions. Different parameters such as voltage, current and power characteristics were represented for different balanced load conditions. Chandran et al. (Citation2021) studied the voltage and frequency performances of a single-phase permanent magnet synchronous generator using improved third-order generalized integrator. A voltage source converter was used to control reactive power compensation, whiles the duty ratio from the frequency controller was used to control IGBT switches connected in series with diode bridge rectifier circuit to dump excess power to auxiliary load. Praptodiyono et al. (Citation2021) implemented an ELC prototype for a single-phase Pico hydropower system. In this work, for every change in frequency, a programmed microcontroller increases or decreases firing delay of TRIAC so that output power to dummy loads is controlled.
The common subject of matter amongst these literatures is the application of controllers on 3-phase or single-phase balanced loads. However, in real world, the existence of balanced loads is highly unlikely. Hence, these previous works on balanced loads cannot be applied to real-world power systems. Therefore, the novelty of this work is the application of an artificial intelligence technique to design an ELC to control the frequency of unbalanced 3-phase loads to address the applicability of study findings in real-world power systems.
2. Proposed methodology
In this section, the design concept of frequency control in MHPP is presented. The design concept encompassed the design of synchronous generator for providing AC power to the consumer loads. The design of frequency sensor to sense the frequency of the synchronous generator at any instantaneous time. The sensed frequency was then passed through a designed Fuzzy-PI controller to find an error in frequency in order to reduce the steady state error of the frequency. This reduction of steady state was possible due to the ability of the designed controller to obtain optimal PI gains of the conventional PI controller. The output of the Fuzzy-PI controller was then passed through a designed PWM circuit, which took the optimal gains and converted them into equivalent PWM signal to control the firing angle of the IGBTs. Finally, the ELC itself was designed to divert excess power to the damper loads. This ELC presented comprised an uncontrolled rectifier which rectified the dump power, and the IGBTs which controlled the amount of dump power to the damper loads. Figure shows the design concept of the frequency control in MHPP.
Figure 2. Design concept of frequency control in MHPP.
2.1. Design of a conventional pi controller
The conventional PI controller was designed using derived values of and
gains. These gains were derived using the Ziegler-Nichols first method of tuning. With this method, when the open-loop transfer function of the synchronous generator was plotted, the time delay
and the time constant
were 12.15 ms and 4.05 ms, respectively. Hence, using Equationequation (3)
(3)
(3) and Equationequation (4
(4)
(4) ; Kushwah & Patra, Citation2014, 2924–2929), the values of the gains were calculated as 0.3 for
and 40.5 for
.
These gains were used to design the conventional PI controller in Simulink using a unit step input as reference. As shown in Figure , the Simulink model of the conventional PI controller included the transfer function of the synchronous generator. The values of inertia constant and the damping factor
were 0.05 and 1.3, respectively. These values were arbitrarily chosen to suit the simulation.
Figure 3. Model of conventional pi controller.
2.2. Design of fuzzy-pi controller
The block diagram of the designed Fuzzy-PI controller is shown in Figure . The Fuzzy-PI controller measures the output frequency of the generator and compares it with the reference frequency. The results of the subtractive comparison are called error (e) and a derivative of the error (ė) is called the rate of change in error. These two parameters were used as antecedents in the fuzzy rule-based system to tune the gains to produce optimal gains, which are termed as and
.
Figure 4. Block diagram of designed fuzzy-pi controller.
Using fuzzy to obtain the optimal gains is necessary because the fixed gains of the conventional PI controller are not often properly tuned for non-linear systems (MHPP) which results in unpredictable parameter variations (Pandey, Citation2010).
2.2.1. Fuzzification
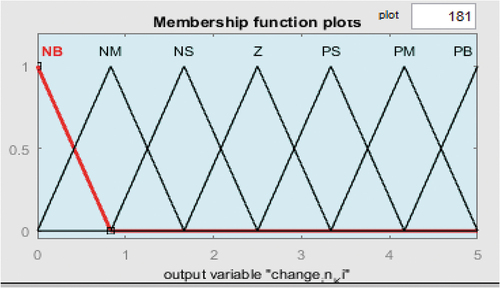
For simplicity sake, seven triangular membership functions were used in this work. Each of these membership functions was mapped to a unique linguistic value. The two fuzzy inputs named error (e) and rate of change in error (ė) and the two outputs, and
were each fuzzified using seven membership functions. These membership functions are namely, NB = Negative Big, NM = Negative Medium, NS = Negative Small, Z = Zero, PS = Positive Small, PM = Positive Medium, PB = Positive Big. The ranges of input variables e and ė were −2 to 2 and −2 to 2, respectively. The ranges of output variable
and
of the controller were 0 to 10 and 0 to 5, respectively. The range of the input error (e) represents the acceptable range of frequency in Ghana. The ranges of the rate of change in error (ė) and the output variables
and
were generated using try and error process. Figure and Figure show the membership functions for the two inputs whiles Figure and Figure shows the membership functions for two outputs, respectively.
Figure 5. Input membership functions(error).
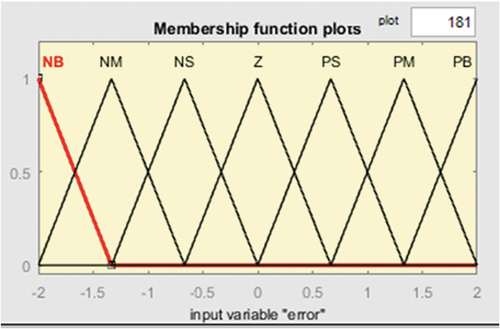
Figure 6. Input membership functions (change in error).
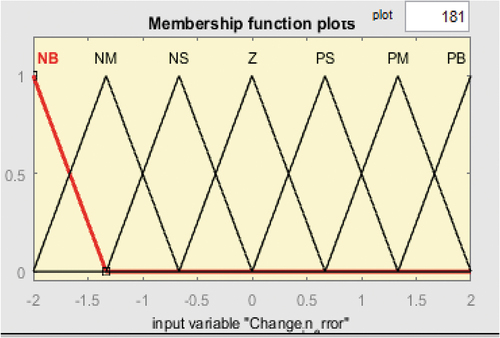
Figure 7. Output membership functions (change in Kp).
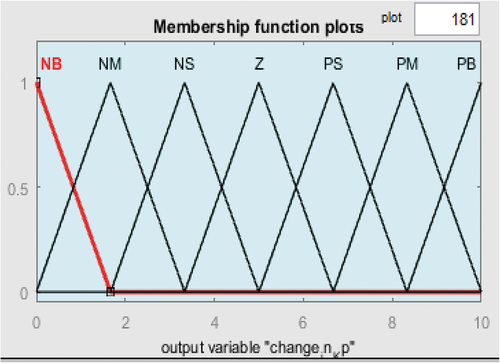
Figure 8. Output membership functions (change in Ki).
2.2.2. Formulation of fuzzy rule base
In this work, the fuzzy inference system was made using the Mamdani type inference system because it is more intuitive, easier to understand and has widespread acceptance. The rules were made to have the IF-THEN rules format. The optimization due to the formulation of the rules were because of the operation of the PI controller. The constant of the PI controller offers an effective control action when the error is high. The
constant also offers an effective control action when the system is operating near the set point. Consequently, it is expected that, when the error is large, the
must be increased and vice versa. The same way, the
value is expected to be minimum when the system operates away from the set point and vice versa.
With the input variables having seven memberships functions, the total number of rules for the output variables are 49 rules. The rules are in the if-then format as illustrated below.
If error is NB and rate of change in error is NB, then ∆Kp is PB and ∆Ki is NB
If error is Z and rate of change in error is Z, then ∆Kp is Z and ∆Ki is Z
If error is PM and rate of change in error is PM, then ∆Kp is NM and ∆Ki is PB
With this analogy, the control rules for and
were formulated as shown in Table and Table respectively.
Table 1. Fuzzy rule base table for
Table 2. Fuzzy rule base table for
The adaptive updating approach to modelling a fuzzy-pi controller was employed to determine the new and
values. These new values were calculated as (Ofosu et al., Citation2016; Wang-Xiao et al., Citation2008),
where, = initial proportional gain and
= initial integral gain
2.3. Design of ELC circuit
2.3.1. PWM firing circuit
In this work, a firing circuit was used to fire the IGBTs. Figure shows how the firing circuit was used to produce PWM signals for firing the IGBTs. It can be observed form the circuit that, the output of the Fuzzy-PI controller, which was sinusoidal, was converted to PWM signals by comparing that signal to a sawtooth signal. The sawtooth signal acted as the carrier wave, which was made to have a higher frequency than the reference wave to make the comparison viable, hence, the frequency of the sawtooth signal generator was set to 1000 Hz and the amplitude was set to 1.
Figure 9. Circuit for generation of PWM signals.
2.3.2. Design of ELC using PWM control
For the PWM method of control, due to the different loads in each phase, the power dumped through each damper load should be different. That is each phase was connected to a separate ELC as shown in . Due to that, mathematical computations were done for each phase to determine the power to dump in each phase. Since each phase is controlled by a damper load, a single-phase ELC formula was used. The following steps were used to design the ELC:
Without any ELC connected the 3-phase unbalanced resistive load was connected to determine the maximum output voltage and current that could give a constant frequency of 50 Hz.
The product of this voltage and current of a particular phase was assumed to be the maximum output power of that phase. Hence, each phase had a certain main load.
The main load together with their recorded voltage and current of a particular phase were used to calculate for the parameters of the capacitor, diode and IGBT used in that phase. Also, the main load in each phase was used to determine the resistance of damper loads for that phase.
Figure 10. Simulink model for ELC for phase A.
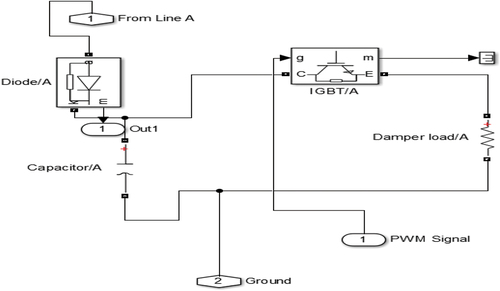
The voltage and current values for each were phase A = 372 V, 9.8 A; phase B = 660.1 V, 20.7 A; and phase C = 717.7 V, 40 A. With these values, the main load for each phase was calculated by multiplying the voltage and current in each phase. For phase A, the main load was 3645.6 W, phase B was 13,662 W and phase C was 28,708 W. Since each phase was controlled, the design of the ELC was considered singly for each phase, hence in each phase the same formulas were used to calculate important parameters such as the snubber resistance, snubber capacitance, DC link voltage, resistance of damper loads and maximum current due to overvoltage and harmonics. Hence, for a single-phase ELC, the DC link voltage (Singh et al., Citation2006, 293–295) is:
Hence for Phase A:
A single-phase uncontrolled rectifier including a diode, snubber resistance, and a capacitor were used to rectify the AC signal from the generator into a DC signal. The snubber resistance withholds any overshoot in current or voltage during operation. Hence, assuming a 10% overvoltage of VLL, then, the new VLL will be 409.64 V. This over-voltage was used to calculate the maximum current and hence the snubber resistance. The maximum current was calculated as:
where = main load for phase A (3645.6 W),
= overvoltage (409.64 V),
= maximum current due to overvoltage.
(Singh et al., Citation2006, 293–295) included a distortion factor in PWM control to reduce the effect of harmonics in the MHPP system. Hence, taking a distortion factor of 0.9, the new maximum current Imax caused by harmonics will be:
Snubber resistance (SR) as defined as:
For these computations, the resistance of each damper load was considered. For phase A, the resistance of the damper load was:
For an uncontrolled rectifier a capacitor is used to smoothen the ripple effect of the rectified signal such that it approaches the waveform of a DC signal. The capacitance for each is also calculated considering a 5% ripple as (Singh, Murthy, and Sushma, 293–295);
where, = frequency (50 Hz),
= resistance of damper loads (Ω),
= Ripple factor. For phase A, the capacitance is:
Following through, the same mathematical computations were done for phases B and C, respectively, as shown in Table .
Table 3. Mathematical computations for phases B and C
Lastly, (Anurang et al., Citation2015, 514–520) defined the snubber capacitance as;
where, = snubber capacitance,
= main load,
= frequency,
= maximum voltage in each phase. Hence, for phases A, B, and C were calculated as
,
and
respectively.
2.4. Simulink model of MHPP system
The combined Simulink model of the MHPP system is shown in . It summarises all the various design concepts discussed earlier into one MHPP system. In the diagram, the ELC design for each phase was made into subsystems for simplicity and clarity. The design of the MHPP encompasses the design of the synchronous generator. In this work, a default modelled synchronous generator in Simulink was used as power source to the loads. As a result, certain parameters such as rated power, line-to-line voltage, number of poles and frequency were changed to suit the simulation purpose. With regard to these changes, an unbalanced 90 kVA, 400 V, 4-pole, 50 Hz, 1500 rpm synchronous generator was used. Also, an inertia constant of 0.05, damping factor of 1.3 and generator’s mechanical input of 0.7516 pu, respectively, were used.
Figure 11. Combined simulation model of MHPP system.
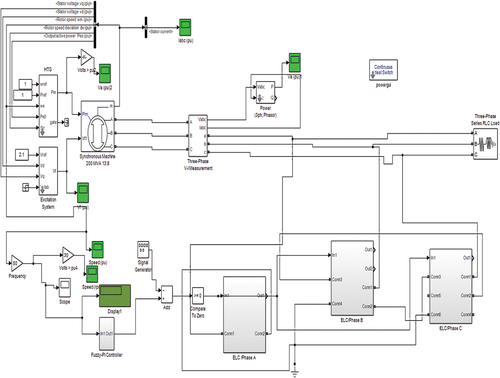
The unbalanced nature of the generator was observed because of the different voltages and currents in each phase. This unbalanced 3-phase generator was able to show its stator voltage (), rotor speed (
) rotor speed deviation (
) and the electrical output power (
). These generator parameters were fed to the excitation system to control the field excitation to the generator. The reference voltage (
) of the excitation system had great impact on the frequency of the generator, hence this value was obtained by a try and error process such that a 50 Hz was recorded as the consumer loads were varied. After the try and error process, the value of the field exciter was obtained as 2.1 pu. Also, as seen from , the reference mechanical power (
) and the reference speed of the turbine (
) in the Hydraulic Turbine and Governor (HTG) block were maintained at constant values of 1 pu to mimic the absence of the speed governor.
3. Results and discussion
In this work, a fuzzy-PI controller was designed and simulated. The and
values were 7.766 and 0.83, respectively. The initial
and
values used for the design of the conventional PI controller were 0.3 and 40.5, respectively. Using the adaptive updating gain Equationequation (5)
(5)
(5) and (Equation6
(6)
(6) ), the new values for
and
form the fuzzy-PI controller were calculated as shown in Table .
Table 4. System response of various controllers
The performance of the synchronous generator using a unit step under conventional PI controller and the Fuzzy-PI controller is shown in .
Figure 12. A graph of combined control response.
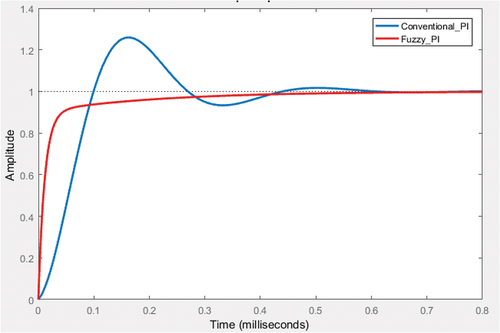
From and in , it can be observed that the Fuzzy-PI controller gave a good control response in terms of settling time, rise time and overshoot as compared to the conventional PI controller. Hence, from , the percentage improvement of the Fuzzy-PI controller in terms of settling time was 16%. Also, there was a 100% improvement in terms of overshoot with the Fuzzy-PI controller. Lastly, there was a 40% reduction in rise time as compared to the conventional PI controller. Obviously, these results show that using an AI technique like fuzzy logic to optimally tune the gains of a conventional PI controller can greatly improve the performance of the controller in frequency control of MHPP. That is, the problem of high overshoot and long rise and settling time associated with the conventional controllers are reduced thereby resulting in stable frequency control.
3.1. Generator’s load variation without ELC
Considering a 90 kVA, 400 V, 4-pole, 1500 rpm, shows the behaviour of frequency of the synchronous generator under varying consumer load when no ELC was connected to the MHPP. To mimic the unbalanced varying consumer loads, different values were taken for each phase. These values were used in decreasing order to observe the behaviour of the frequency of the generator. The graphical representation of is shown in
Figure 13. Frequency variations of generator without ELC.
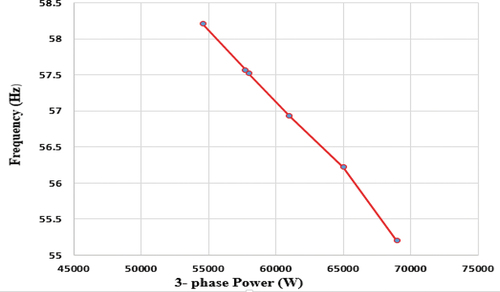
Table 5. Frequency variation of generator loaded without ELC
It can be observed that as the loads in each phase were decreased, the frequency of the synchronous generator increased and this was due to the reduced load on the synchronous generator. It can be observed from the last values in that, the lowest consumer loads gave a dangerously high frequency of 58.21 Hz. This frequency can cause damage to both the consumer loads, the rotor of the generator and the components connected to the generator. In , the power in each phase was added to represent a single 3-phase power for easy plotting against the frequency. It can be observed from and that they show the same behaviour of frequency.
3.2. Generator’s load variation with ELC
The variations of consumer loads, damper loads, main load, frequency and power across the capacitor in each phase are shown in . In the table, represents consumer loads;
represents dump power;
is the main load whiles
represents the power across the capacitor. It is observed from that, as the load is decreased to lower values, the damper loads, together with the power across the capacitors also showed a corresponding increase in power.
Figure 14. A graph of power used by damper load and consumer load for phase C.
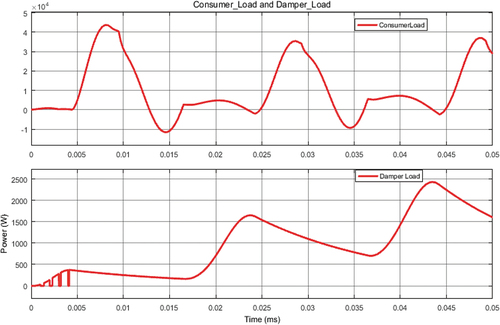
Table 6. Frequency variation of loaded generator loaded with ELC
Again, from the table, the main load or output power of each of the phases was maintained within permissible limits. The main load in phase A was maintained between 3622.4 W and 3645 W. In phase B, the main load was between 13,406 W and 13,918 W. However, phase C’s main load increased significantly between 25,443 W and 30,846 W. Another observation from is that, power dumped is not only across the resistive damper loads but across the capacitors too, which contributed greatly to maintain a constant frequency. The relation between these four parameters is shown by Equationequation (13)(13)
(13)
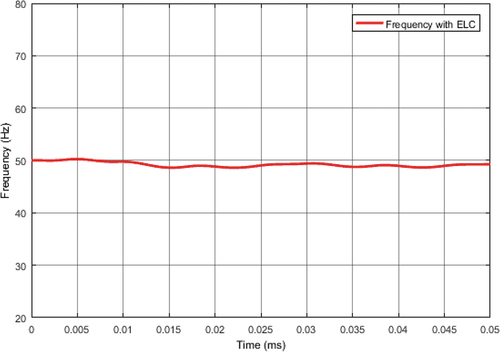
The graphical representation of frequency variation with consumer and damper loads are shown in , and . shows the relation between the consumer loads and the damper loads in phase C when that phase was loaded with 28,400 W. It can be observed that as the consumer load decreased or increased, the damper load increased or decreased respectively to maintain the main load in that phase. This same effect was observed with many other consumer loads in phase A and phase B. and also show the graphical representations of the frequency behaviour without and with the ELC, respectively. These results were obtained from phase C when a consumer load of 30,000 W was connected in the case of no ELC and 28,400 W was connected in the case of an ELC. It can be observed from that, frequency increased sharply from 50 Hz to 55.2 Hz. However, when the ELC was connected and the load was further reduced to 28,400 W, the frequency rather maintained at a value of 49.3 Hz as shown in . All these results shown from, to indicate that the ELC was effective in dumping excess power to the damper loads to maintain a constant frequency and output power. Also, the minimum frequency obtained was 49.3 Hz and a maximum frequency of 51.92 Hz, which fell within the range of ±2 as, depicted in the fuzzy inference system and the frequency tolerance of Ghana.
Figure 15. Graph representing frequency with no ELC.
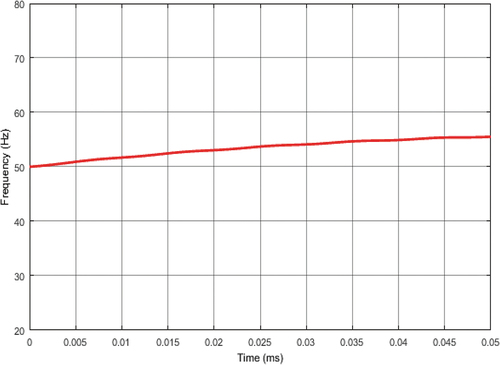
Figure 16. Graph representing frequency with ELC.
4. Conclusion
In this work, the design of ELC to maintain the frequency of MHPP using purely resistive unbalanced 3-phase loads has been achieved. The ELC was able to dump excess power to the damper loads when the consumer loads were varied, thereby maintaining the frequency of the synchronous generator between 49.3 Hz and 51.92 Hz. Also, the Fuzzy-PI controller made it possible to design the ELC to maintain the frequency within a tolerance of ± 2. The Fuzzy-PI controller also showed good stability performance of the generator as compared to the conventional PI controller, hence its ability to stabilise the frequency of the generator within that specified range or tolerance.
Acknowledgement
The authors appreciate Jiangsu University, University of Mines and Technology and Jomo Kenyatta University of Agriculture and Technology for making available the necessary resources for the completion of this research work.
Disclosure statement
No potential conflict of interest was reported by the author(s).
Additional information
Funding
Notes on contributors

Robert Agyare Ofosu
Robert Agyare Ofosu is a Lecturer in the Electrical and Electronic Engineering Department (EEED) at the University of Mines and Technology (UMaT), Tarkwa, Ghana. He is a PhD candidate in Control Science and Engineering at Jiangsu University, China. He is a member of IEEE. His research interests include control engineering, artificial intelligence and electric drives. Erwin Normanyo is a Senior Lecturer in the EEED at UMaT, Tarkwa, Ghana. His research interests include energy management, control engineering, automated electric drives and mechatronics. Keren Kanuthu Kaberere is a Senior Lecturer in the EEED at the Jomo Kenyatta University of Agriculture and Technology (JKUAT), Kenya. Her area of interests includes power system stability, renewable energy, distributed generation and electricity market. Stanley Irungu Kamau is an Associate Professor in the EEED at JKUAT, Kenya. His main research is in control Engineering. Ernest Otu Kumi is an assistant project Engineer at Genser Energy Ghana Limited. His research interests include power system analysis, design, protection and control.
References
- Anaza, S. O., Abdulazeez, M. S., Yisah, Y. A., Yusuf, Y. O., Salawu, B. U., & Momoh, S. U. (2017). Micro hydro-electric energy generation- an overview. American Journal of Engineering Research, 6(2), 5–20 https://www.ajer.org/papers/v6(02)/B06020512.pdf.
- Anurang, Y., Singh, S. N., & Appurva, A. (2015). A fuzzy logic based electronic controller for three-phase alternator. International Journal Of Engineering Technology And Advanced Engineering, 5(3), 514–520 https://1library.net/document/zw59nn7z-fuzzy-logic-based-electronic-load-controller-phase-alternator.html.
- Chandran, V. P., Murshid, S., & Singh, B. (2021). Improved TOGI-based voltage and frequency control for PMSG feeding single-phase loads in isolated pico-hydro generation. IETE Journal of Research, 67(6), 882–898. https://doi.org/10.1080/03772063.2019.1571953
- Chaurasia, R., Viral, R., Asija, D., & Bahar, T. (2020). Performance analysis of self-excited induction generator with ELC for the wind energy system. Innovation in Electrical and Electronic Engineering 661 219–236 . https://doi.org/10.1007/978-981-15-4692-1_17
- Clark, D. M., Gozon, R. C., & Morcilla, R. V. (2016). Analysis and comparison of switching techniques of electronic load controller for micro hydro power plants. Mindanao Journal of Science and Technology, 14(5), 120–130 https://mjst.ustp.edu.ph/index.php/mjst/article/view/102/78.
- Erika, S. M., Paulo, C. R., & Enio, R. R. (2013). Electronic load controller of a micro hydro generator for stand-alone operation. Institute of Electrical and Electrical Engineers, 2(1), 718–723 doi:10.1109/COBEP.2013.6785194.
- Karmakar, S. (2020). Artificial neural network-built electronic load controller for three-phase self –excited induction generator feeding single-phase loads. Michael Faraday IET International Summit 2020 185– 190 . https://doi.org/10.1049/icp.2021.1073
- Kushwah, M., & Patra, A. (2014). PID controller tuning using Ziegler-Nichols method for speed control of DC motor. International Journal of Scientific Engineering and Technology, 3(13), 2924–2929 http://ijsetr.com/uploads/361425IJSETR1550-497.pdf.
- Nan, W. A., & Aung, Z. Y. (2015). Design of electronic load controller by using combination method for micro-hydro power plant and its control and monitoring program simulation. International Journal of Electrical, Electronics and Data Communication, 3(6), 6–12 http://IJEEDC-IRAJ-DOIONLINE-2257.
- Ofosu, R. A., Kaberere, K. K., Nderu, J. N., & Kamau, S. I. (2019). Design of BFA-optimized fuzzy electronic load controller for micro hydro power plants. Energy for Sustainable Development, 51, 13–20. https://doi.org/10.1016/j.esd.2019.04.003
- Ofosu, R. A., Kamau, S. I., Nderu, J. N., Kaberere, K. K., & Muhia, A. M. (2016). Determination of optimal PI gains for Fuzzy-PI controller using Bacterial Foraging Algorithm (BFA. IOSR Journal of Electrical and Electronics Engineering, 11(2), 26–33 https://www.slideshare.net/IOSR/d1102032633.
- Pandey, M. K. 2010. Analysis of self tuning fuzzy PID internal model control, MSc thesis, Thapar University.
- Ponnam, Y., Kumar, P. R., & Kumar, V. V. (2014). Electronic load controller for self-exited induction generator using fuzzy logic controller. IOSR Journal of Electrical and Electronics Engineering, 5(3), 49–53. https://doi.org/10.9790/1676-534954
- Praptodiyono, S., Maghfiroh, H., Nizam, M., Hermanu, C., & Wibowo, A. (2021). Design and prototyping of electronic load controller for pico hydropower system. Jurnal Ilmiah Teknik Elektro Komputer Dan Informatika (JITEKI), 7(3), 2338–3070. https://doi.org/10.26555/jitek.v7i3.22271
- Raj, M. P., & Kumar, K. R. (2014). Fuzzy logic control strategy for stand-alone self-excited induction generator for a variable speed wind turbine. International Journal of Innovative Research in Science, Engineering and Technology, 3(1), 847–853 http://www.ijirset.com/upload/2014/icets/189_EE466.pdf.
- Sanampudi, N., & Kanakasabapathy, P. 2020. Integrated voltage control and frequency regulation for stand-alone micro-hydro power plant 46 (10), 5027–503 https://doi.org/10.1016/j.matpr.2020.10.403 .
- Singh, B., Murthy, S. S., & Sushma, G. (2006). Analysis and design of electronic load controller for self-excited induction generators. IEEE Transactions on Energy Conversion, 21(1), 293–295. https://doi.org/10.1109/TEC.2005.847950
- Wang-Xiao, K., Zhong-Liang, S., Wnglei, & Dong-qing, F. 2008. Design and research based on fuzzy self-tuning PID using MATLAB. Proceedings of international conference on advanced computing theory and engineering Massachusetts, United States (IEEE Computer Society).
- Yadav, A., Singh, S. N., & Appan, A. (2015). A fuzzy logic based electronic load controller for three phase alternators. International Journal of Emerging Technology and Advanced Technology, 5(3), 514–520 https://ijetae.com/files/Volume5Issue3/IJETAE_0315_94.pdf.